
Monitoring Accropodes Breakwaters using RGB-D Cameras
D. Moltisanti
1
, G. M. Farinella
1
, R. E. Musumeci
2
, E. Foti
2
and S. Battiato
1
1
Image Processing Laboratory, University of Catania, Viale Andrea Doria 6, Catania, Italy
2
Department of Civil Engineering and Architecture, University of Catania, Viale Andrea Doria 6, Catania, Italy
Keywords:
3D Breakwaters Monitoring, RGB-D Cameras, Iterative Closest Point, Point Cloud Alignment.
Abstract:
Breakwaters are marine structures useful for the safe harbouring of ships and the protection of harbours from
sedimentation and coasts from erosion. Breakwater monitoring is then a critical part of coastal engineering
research, since it is crucial to know the state of a breakwater at any time in order to evaluate its health in terms
of stability and plan restoration works. In this paper we present a novel breakwaters monitoring approach
based on the analysis of 3D point clouds acquired with RGB-D cameras. The proposed method is able to
estimate roto-translation movements of the Accropodes, building the armour layer of a breakwater, both under
and above still water level, without any need of human interaction. We tested the proposed monitoring method
with several laboratory experiments. The experiments consisted of the hitting of a scale model barrier by
waves in a laboratory tank, aiming to asses the robustness of a particular configuration of the breakwater (that
is, the arrangement of the Accropodes building the structure). During tests, several 3D depth maps of the
barrier have been taken with a RGB-D camera. These point clouds, hence, have been processed to compute
roto-translation movement, in order to monitor breakwater conditions and estimate its damage over time.
1 INTRODUCTION
RGB-D cameras are nowadays used in a lot of ap-
plications which spread over many purposes. In this
paper we use such cameras in a hydraulic engineer-
ing context with the goal of monitoring the status of
a Accropode breakwater attacked by waves. During
an experiment a scale model barrier is hit by waves in
a laboratory tank, aiming to asses the robustness of a
particular configuration of the breakwater. Several 3D
models of the barrier are acquired throughout the test
with a RGB-D camera, in order to monitor the condi-
tions of the breakwater and estimate its damage over
time through Computer Vision algorithms.
To compute the shifts of the Accropodes occurred
during an experiment, we use as reference a 3D model
of the barrier taken at the beginning of the experiment.
From this 3D model we extract a set of control points
used to estimate roto-translational movements in lo-
cal regions of the barrier. Every control point defines
a portion of the breakwater and Accropodes shifts are
computed by performing radius searches on the spher-
ical neighbourhoods of such points.
The rest of the paper is organized as following.
In Section 2 the motivations of this work are given.
Section 3 provides an overview of the setup in which
tests have taken place, also describing the involved
experimental scenario. In Section 4 we analyse the
proposed approach, whereas Section 5 discusses the
experimental results. Finally, Section 6 provides con-
clusions and hints for future works.
2 MOTIVATIONS OF THE WORK
Rubble mound breakwaters play an important role in
the protection of ports or beaches from wave attacks.
Indeed, by inducing wave breaking on the structure,
they allow to dissipate a great portion of the inci-
dent wave energy, generating several beneficial ef-
fects, such as the control of wave height within har-
bour basin, reduction of the impacts of storms along
the coasts, minimisation of coastal erosion, etc.
The armour layer of the rubble mound breakwater,
i.e. the external layer of large blocks facing offshore,
is the most important part of the structure. Depending
on the structure function, wave conditions, material
availability and breakwater shape, the armour layer
may be built by using natural stony blocks or artificial
concrete blocks. Amongst the artificial blocks, one of
the most used is the Accropode (Kobayashi and Kai-
hatsu, 1984), which has been proposed by Sogreah
76
Moltisanti D., Farinella G., Musumeci R., Foti E. and Battiato S..
Monitoring Accropodes Breakwaters using RGB-D Cameras.
DOI: 10.5220/0005297000760083
In Proceedings of the 10th International Conference on Computer Vision Theory and Applications (VISAPP-2015), pages 76-83
ISBN: 978-989-758-089-5
Copyright
c
2015 SCITEPRESS (Science and Technology Publications, Lda.)
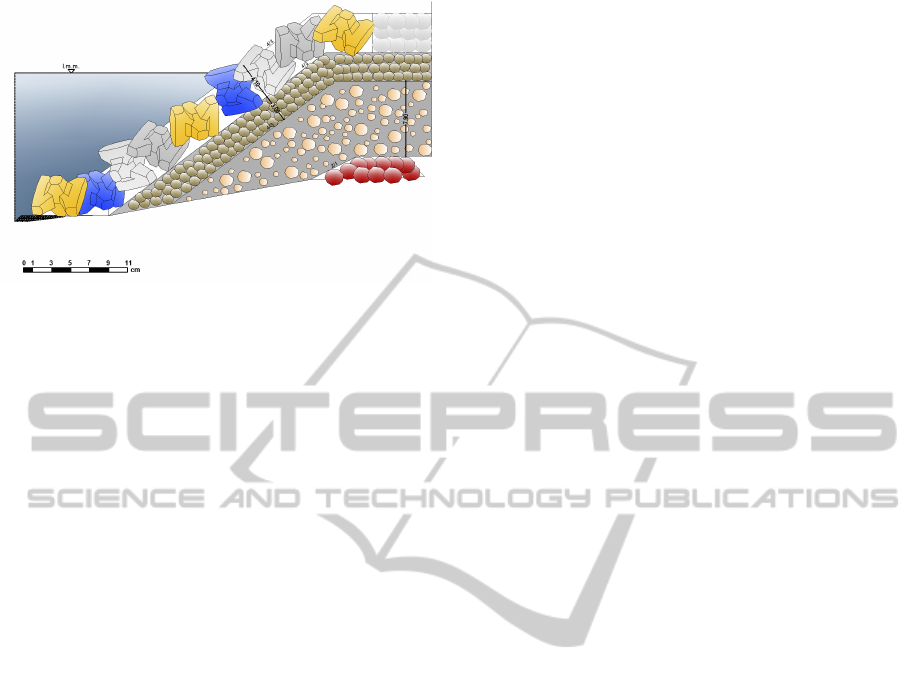
Figure 1: Schematic section of one configuration of the 2D
breakwater model, where the armour layer is made up by
Accropode blocks.
in 1981. Such kind of blocks is often used to build
coastal structures, thanks to the interlocking proper-
ties which guarantees an high stability, when both a
large mass of the block and a steep slope of the struc-
ture are required (Van der Meer, 1987; Kobayashi and
Kaihatsu, 1984).
The action of the waves during storms may dam-
age the armour layer of rubble mound breakwaters
and this can importantly compromise the overall sta-
bility of the structure. Due to the complexity of the
problem, neither analytical nor numerical predictions
are able to provide damage estimates, and coastal en-
gineers rely on the results of laboratory experiments
carried out on properly scaled physical models to as-
sess the level of damages under known wave condi-
tions.
Traditionally, at field site, breakwaters are visu-
ally inspected using limited, qualitative and subjective
methods, like underwater video monitoring effectu-
ated by professional scuba divers, which entails both
cost and security issues. Also, traditional underwa-
ter monitoring systems require expensive devices, like
acoustic beams emitters or laser scanner (Auld, 2010;
Caimi and Kocak, 1997). An interest in reducing such
costs is growing up over time: relatively low cost de-
vices like RGB-D cameras, for instance, have more
and more resolution, whilst the related supporting
Computer Vision algorithms are increasingly precise.
Additionally, RGB-D cameras can see both under and
above the water, combining so in only one device the
capability to observe the whole structure. The devel-
opment of new Coastal Engineering systems based on
low cost solutions with a high accuracy level is then
a new challenge for Computer Vision. The proposed
breakwater monitoring method is particularly focused
on this context, since it requires affordable devices
(indeed, we used a Microsoft Kinect).
Using an automated methodology allows also to
investigate a bigger amount of data, that is more ex-
perimental results to be analysed. Our method re-
quires only a minimal user interaction via a friendly
graphic interface for the alignment phase of the point
clouds. Furthermore, this is a stage which has to be
done only after the experiment: the only operation
which engineers must care about is the proper loca-
tion of the RGB-D camera for the acquisition of the
3D models from an appropriate point of view.
3 EXPERIMENTS SETUP
The experimental campaign has been carried out at
the Hydraulic Laboratory of the University of Cata-
nia within an experimental wave tank, which is
equipped with an electronically controlled flap-type
wavemaker, able to produce both regular and irregu-
lar water waves. The wave tank is 18m long, 3.6m
wide and 1.0m high. In order to test the proposed
approach, the stability of a rubble mound breakwater
with the armour layer made up by artificial Accrop-
ode blocks has been investigated. Such a structure is
inspired by a real structure to be built in the Eolian
Islands to protect an existing marina, by using a scale
1:80 between the model and the prototype. In par-
ticular, during the present experiments only a section
1m wide of the tank has been used, in order to better
control both the construction and the stability of the
two-dimensional structure. Figure 1 shows a section
of the model of the breakwater, where it can be no-
ticed the armour layer made up by Accropodes, while
the underlying layers, starting from the filter and go-
ing down to the core of the structure, are made up by
natural stones. The Accropode blocks were built on
purpose by using a mixture of a resin, basaltic sand
and iron powder in order to obtain the desired den-
sity. The side of the Accropode was 4.64 centimetres.
It should be noted that Accropodes are painted. This
has been done in order to reduce scale effects related
to the different roughness we have at prototype scale
and at model scale. The different colours used helped
also to identify the movement of each single Accrop-
ode.
The RGB-D camera is positioned on a specific
stand supported by a scaffolding in front of the struc-
ture at a distance of approximately 1.2m from the toe
of the structure, in order to be able to recover the en-
tire structure, both above and below water level.
Several irregular wave conditions, corresponding
to different stages of the design storm, have been run
in order to test the stability of the armour layer. Af-
ter each wave conditions, a depth map of the armour
layer was obtained by stopping the wavemaker, but
MonitoringAccropodesBreakwatersusingRGB-DCameras
77
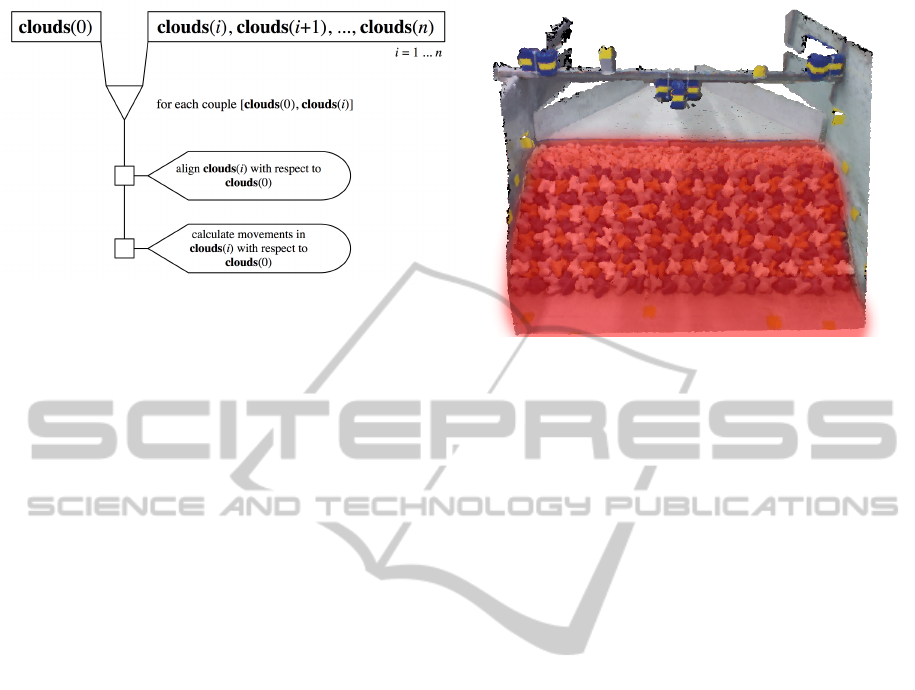
Figure 2: Workflow of the proposed approach.
without empting the wavetank. Indeed the emptying
and filling of wavetanks, which is often performed
in hydraulic laboratories to obtain clear pictures, is
a time-consuming task which in some cases may even
perturb the stability of the structure itself.
4 PROPOSED APPROACH
Before starting to expose the proposed approach, we
first define a simple notation to refer to the 3D models
of a test sequence. We call “clouds” the ordered list of
meshes that have been reconstructed during an exper-
iment: at position i of the clouds list is stored the i-th
3D model captured at time i. A special cloud is the
one stored at position 0: this is the mesh of the barrier
at the initial condition, that is before the experiment
started. We use the cloud at time 0 as reference mesh
to evaluate movements in every subsequent cloud at
time i-th.
The pipeline of our method is reported in Fig-
ure 2. Since the barrier is hit by waves throughout
the experiment, the Accropodes are subject to roto-
translation movements over time: to evaluate these
shifts we compare every cloud i-th with the reference
clouds(0). The first step we run is the alignment of
the cloud i-th with respect to the reference cloud, as
discussed below. Thereafter, we evaluate Accropodes
movements by calculating local differences between
the point clouds, as explained in Subsection 4.2.
4.1 Point Clouds Alignment
Although the Kinect employed in the proposed sys-
tem has been fastened to a rigid bar, it may happen
that two 3D models belonging to the same testing se-
quence are not aligned, that is the models don’t over-
lap exactly one with the other. This can occur due
to slight vibrations transmitted to the Kinect by the
Figure 3: Region of a cloud where movements can take
place (marked in red).
waves during the experiment, causing thus little shifts
of the camera.
We align every clouds(i) of the test sequence with
respect to the reference clouds(0). We use the It-
erative Closest Point algorithm (Chen and Medioni,
1992) to align the clouds by considering specific sub-
clouds selected by the user on the reference mesh. A
sub-cloud is a mesh composed of sub-sets of points
of the source cloud; in particular, we are interested in
picking those parts of the clouds where no movements
can occur (for instance, the bar upon the barrier, or the
wall limiting the Accropodes). We call this sub-cloud
“icp-cloud”: icp-cloud(0) refers then to the sub-cloud
of the reference clouds(0), while icp-cloud(i) refers to
the i-th cloud of the sequence.
Given that ICP operates by finding matches be-
tween points and minimising their distance, a region
where some movements take place would lead to a
failure of the alignment algorithm. In Figure 3 we
can see an example of such region, marked in red.
In this part of the cloud are located the Accropodes,
which move both slightly and considerably, accord-
ing to the intensity of the flooding waves. You might
notice that the steel rod at the bottom of the barrier is
marked too; this is because it could happen that some
Accropodes fall down and get to the bottom due to a
barrier break. In these cases, if we were considering
those part for the alignment, we would cause the fail-
ure of the ICP procedure as the matching between the
reference mesh and the cloud to be aligned would fail.
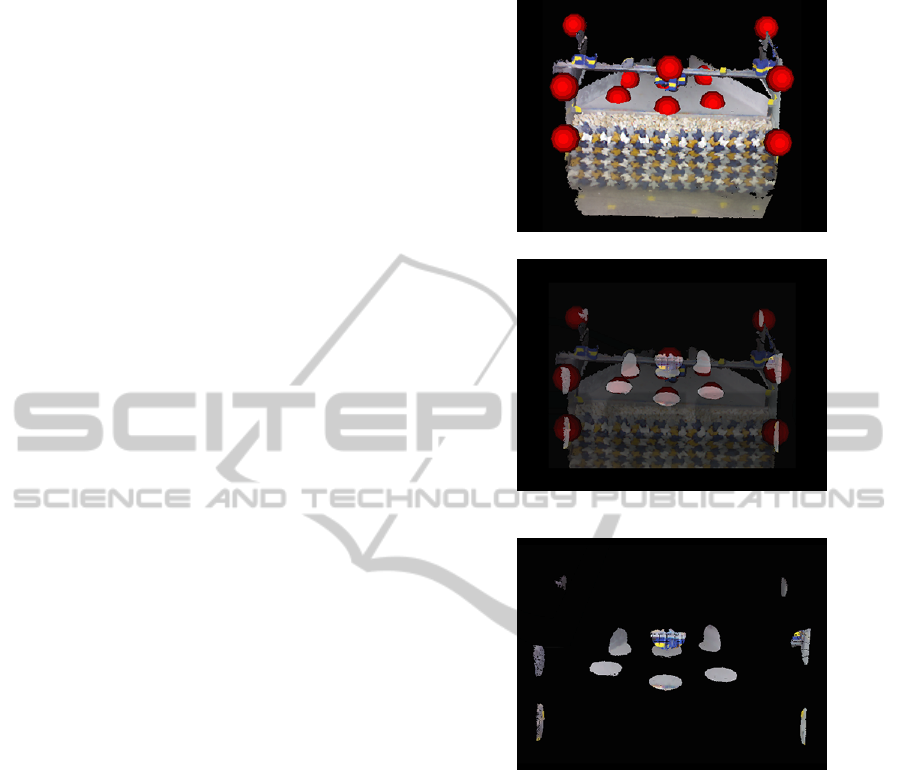
In Figure 4 we can observe the building phase of
the icp-cloud. The software asks the user to pick some
spheres from the reference clouds(0): the points lying
inside the red spheres are extracted from the source
cloud and put in the icp-cloud. We build the sub-
cloud asking the user only once per test sequence.
Specifically, we build the icp-cloud on the reference
VISAPP2015-InternationalConferenceonComputerVisionTheoryandApplications
78
clouds(0): then, for every clouds(i) to be aligned, we
create the corresponding icp-cloud by taking those
points in clouds(i) which lie in the spheres defined by
the user. This means that the (x, y, z) coordinates of
each sphere centre are referred to clouds(0) space and
are the same every time we build a icp-cloud; given
that the meshes are slightly shifted each other, though,
the points lying inside the spheres will (or might, at
least) change a little in every clouds(i). We find these
shifts with the ICP algorithm and we then apply the
resulting transformation matrix to the clouds(i).
4.1.1 ICP Alignment
For each couple [clouds(0), clouds(i)], after the cre-
ation of the corresponding icp-clouds, we run the ICP
algorithm, which can be resumed as follows:
1. For each P
k
i
point in icp-cloud(i), find the nearest
point P
k
0
in icp-cloud(0);
2. Estimate the roto-translation matrix M which best
aligns P
k
i
points to the corresponding P
k
0
. The ma-
trix is evaluated by calculating the Mean Square
Error (MSE) over each point;
3. Apply the transformation matrix M to clouds(i);
4. Repeat from point 1) until a stop criterion is satis-
fied.
ICP has three stop criteria:
1. A certain number of iteration is reached;
2. The difference between the previous transforma-
tion and the current estimated transformation is
smaller than a certain value;
3. The sum of Euclidean squared errors is smaller
than a defined threshold.
We use both 1 and 3 criteria, by setting 100 as
maximum number of iteration and 1
−8
as threshold
for the Euclidean squared errors sum. In Figure 5 we
can observe the result of the alignment process be-
tween two clouds.
4.2 Calculating Accropodes Movements
After the alignment phase, the next step in the work-
flow is the evaluation of the roto-translation move-
ments of the Accropodes composing the barrier. First,
we subsample the reference clouds(0) dividing its
space in cubes of side n (which is set by default to 2
centimetres). For each cube j the points contained in
it are substituted and represented by their mass centre
P
j
: we use these P
j
as control points to calculate both
rotational and translational shifts between the refer-
ence cloud and a mesh clouds(i) from the sequence.
(a) Spheres of points picked by the user
(b) Overlap between the picked spheres and
the resulting icp-cloud
(c) The resulting icp-cloud
Figure 4: icp-cloud for the reference mesh. The user picked
some spheres in regions where no movements can occur,
such as the bar upon the barrier, the walls and the rod
beyond the breakwater (a). The points included in these
spheres will populate the icp-cloud. In (b) the reference
clouds(0) is superimposed over the points included by the
spheres, so that we can observe the points that are extracted
to create the icp-cloud, which is shown in (c). The diame-
ter of the spheres can be adjusted and is set by default to 7
centimetres.
Figure 6 reports a result of such subsampling process.
Every point showed in this mesh represents a control
point P
j
, that is the mass centre of the points contained
in the corresponding j-th cube of the cloud.
4.2.1 Estimate Translation
To estimate translation shifts for a clouds(i), we run a
radius search on each mass centre P
j
:
MonitoringAccropodesBreakwatersusingRGB-DCameras
79
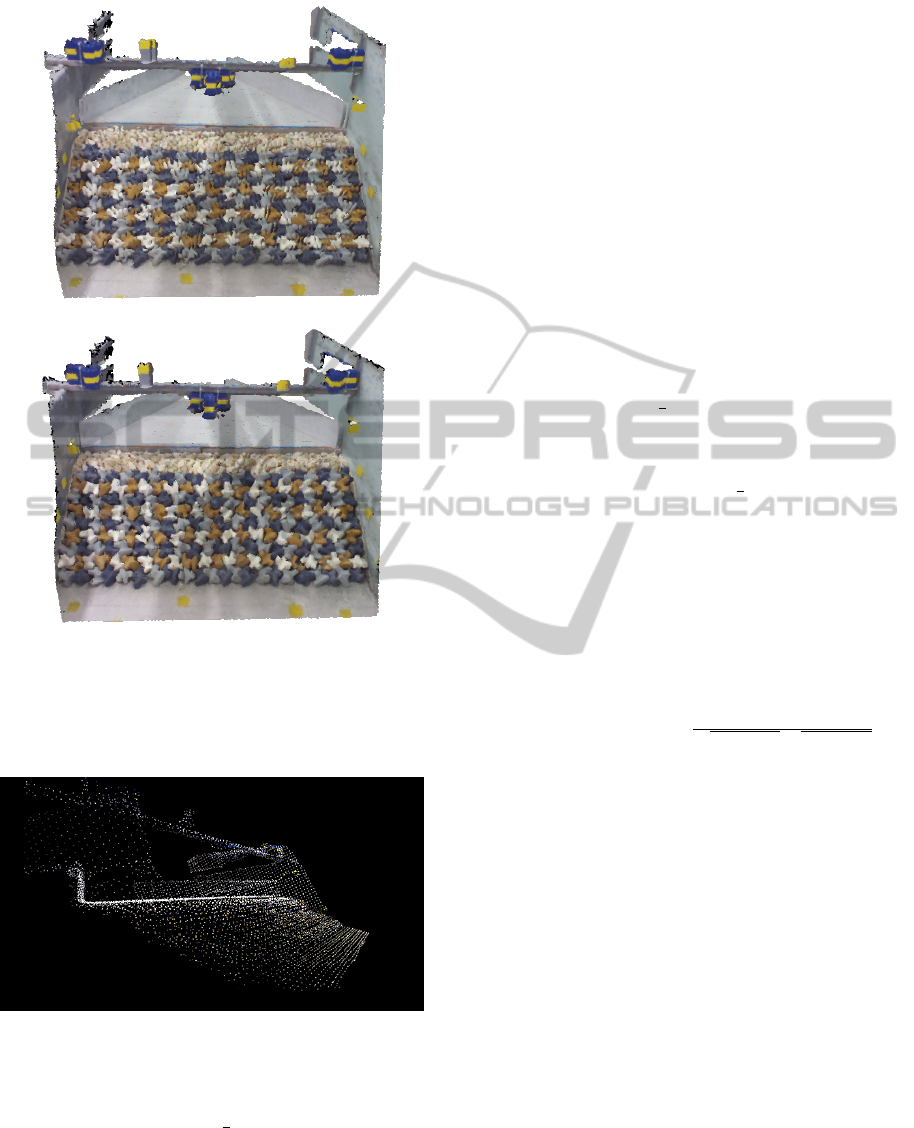
(a) Overlapped 3D models before alignment
(b) Overlapped 3D models after alignment
Figure 5: Clouds alignment. Before the alignment pro-
cess, a noticeable shift between the overlapped 3D models
is clearly visible. After the alignment, the clouds are per-
fectly overlapped and the two meshes are not distinguish-
able.
Figure 6: Point Cloud subsampling result.
• For each P
j
= (x
j
, y
j
, z
j
), we find in clouds(i)
the points lying in the neighbourhood given by
the sphere of radius
n
2
and centre P
j
. Let
neighbours(P
j
) be the set of these points;
• Calculate the mass centre P
0
j
for the points in
neighbours(P
j
);
• The movements occurred in the space portion of
clouds(i) located by the sphere centred in P
j
is
given by the Euclidean distance between P
j
and
P
0
j
.
We use K-d tree (Bentley, 1975) implementation
of PCL library to run radius search over the clouds.
4.2.2 Estimate Rotation
To estimate the rotation of the Accropodes for a
clouds(i) we compute surface normals in the mesh.
More precisely, to calculate the rotation in a portion
of a clouds(i) located by a control point P
j
, we pro-
ceed as follows:
• Given the point P
j
= (x
j
, y
j
, z
j
), estimate in
clouds(0) the normal vector
−→
N
0
( j) of the surface
given by the points lying on the spherical neigh-
bourhood of radius
n
2
and centre P
j
;
• Estimate in clouds(i) the normal vector
−→
N
i
( j) of
the surface given by the points lying on the spher-
ical neighbourhood of radius
n
2
and centre P
j
;
• The angle θ between
−→
N
0
( j) and
−→
N
i
( j) vectors
gives an estimation of the rotation occurred in the
portion of clouds(i) located by P
j
.
To calculate the angle between
−→
N
0
( j) =
(A
1
, B
1
, C
1
) and
−→
N
i
( j) = (A
2
, B
2
, C
2
) we calcu-
late the angle between their perpendicular planes,
that is:
θ(
−→
N
0
( j),
−→
N
i
( j)) = arccos
|A
1
·A
2
+B
1
·B
2
+C
1
·C
2
|
√
A
2
1
+B
2
1
+C
2
1
·
√
A
2
2
+B
2
2
+C
2
2
(1)
We estimate normals vector using the method pro-
posed in (Berkmann and Caelli, 1994), which is based
on Principal Component Analysis. Figure 7 illus-
trates an example of normal estimation and compar-
ison for a couple [clouds(0), clouds(i)], considering
only a small region of the meshes. Red lines are
−→
N
i
( j)
vectors, while green lines are
−→
N
0
( j) vectors; the mesh
drawn in the picture is the reference cloud. In this
example we can see that almost every
−→
N
i
( j) vector is
parallel to the correspondent reference vector
−→
N
0
( j),
since no noticeable movements have occurred in this
part of clouds(i).
5 EXPERIMENTAL RESULTS
The resulting software is written in C++ using the
Point Cloud Library (PCL) (Rusu and Cousins, 2011),
and a Microsoft Kinect device as RGB-D camera. The
output of the proposed method of a sequence is a
VISAPP2015-InternationalConferenceonComputerVisionTheoryandApplications
80
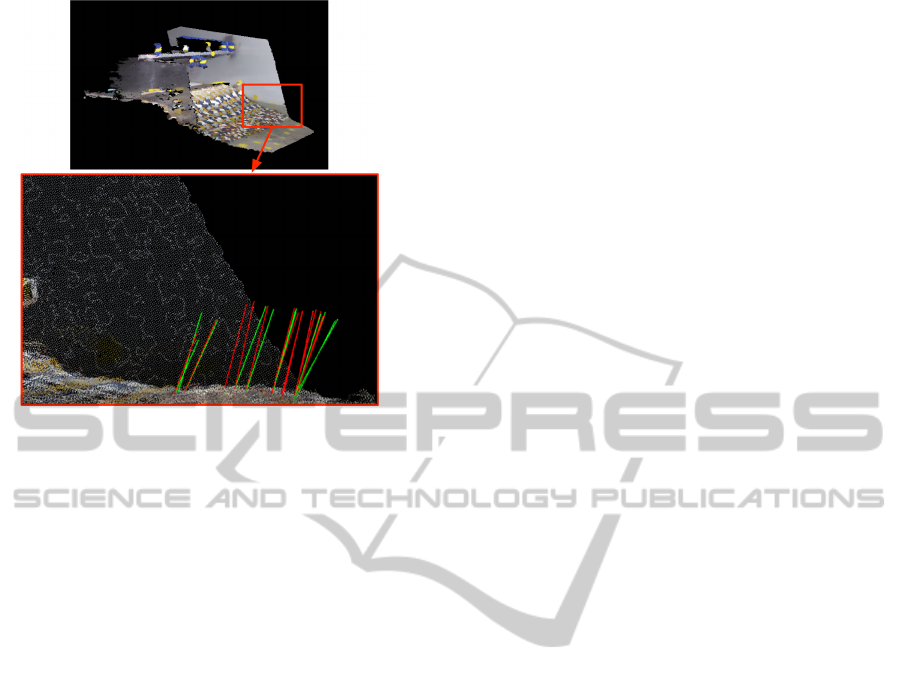
Figure 7: Normals estimation and comparison on a portion
of mesh. Green lines are normal vectors computed for the
reference cloud, while red lines are normals vectors com-
puted for a following cloud in the sequence. For clarity sake
only a subset of vectors is drawn.
text file containing the roto-translation evaluations for
each clouds(i). Every j-th line of the file contains the
translation and rotation shifts estimated in the spheri-
cal neighbourhood of the control point P
j
. Every row
of the output is then composed of:
• P
j
.x, P
j
.y and P
j
.z, respectively the x, y, z coordi-
nates of the control point P
j
;
• d(P
j
, P
0
j
), distance between P
j
and P
0
j
;
• θ(
−→
N
0
( j),
−→
N
i
( j)), angle between normal vectors
−→
N
0
( j) and
−→
N
i
( j);
•
−→
N
i
( j).x,
−→
N
i
( j).y,
−→
N
i
( j).z, respectively the x, y, z
coordinates of the normal vector
−→
N
i
.
To visually represent the results, we draw con-
tour plots of both translational and rotation values.
In order to produce a more readable chart, we plot
the values in two dimensions. We are then discard-
ing the z component of the mesh points by projecting
the cloud into a two dimensional space; the point of
view of such projection is frontal to the scene, and
corresponds exactly to the point of view of the Kinect
camera. The coordinates of the resulting plane are
expressed in centimetres, as well as the colour based
legend of the movements.
We can resume the contour plot function with the
following equation:
contourPlotColour(x, y) ∝ d(P
j
, P
0
j
) (2)
where (x, y) are the coordinates of the control
point P
j
in the two dimensional projection. In the case
of rotational movements contour plot, the same holds
by substituting in Eq. 2 the distance d by the angle θ
between the normals vectors.
Figure 8 shows contour plots of translational
movements for a sequence of clouds obtained during
an experiment. As we can see, it is possible to eas-
ily track the status of the barrier at a glance. As long
as waves hit the barrier over time, Accropodes moved
increasingly: at the beginning of the test (first three
plots of the first row) only few Accropodes moved,
whilst at the central and ending phase of the exper-
iment a lot shifted. We can observe that the upper
region of the breakwater is the most damaged part.
Figure 9 shows contour plots of rotational move-
ments for the same clouds sequence. These plots, al-
beit more noisy than the translation shifts plots, con-
tribute to prove an incremental damage of the break-
water. The noise of rotational movements is mainly
due to the fact we are estimating normals on very tiny
region of the clouds (a sphere with radius of 1 cen-
timetre).
Notice that the proposed monitoring technique al-
lows an immediate understanding of the breakwater
conditions over time. The provided series of plots are
a precious help for an expert to visually assess the
damage of the breakwater in a quick and precise way.
6 CONCLUSIONS AND FUTURE
WORKS
The proposed breakwater monitoring method is a
good starting point for future improvements. The
three dimensional tracking of every single unit of the
monitored breakwater is an arduous and stimulating
feature that could be investigated: such an ability for
a monitoring system does not exist yet, and would be
an innovative capacity that would bring coastal engi-
neers to completely new stability analysis techniques.
The monitoring phase of our system is currently
offline: users first fulfil the flooding experiment ac-
quiring point clouds used later to evaluate the oc-
curred movements in the breakwater. The stability
monitoring of a protection structure requires a con-
stant surveillance and, consequently, a responsive sys-
tem. The complexity of the involved data processing
techniques and the big magnitude of the data itself
(3D imaging require big resources to be represented
and stored) make real time handling of 3D data an
important challenge.
MonitoringAccropodesBreakwatersusingRGB-DCameras
81
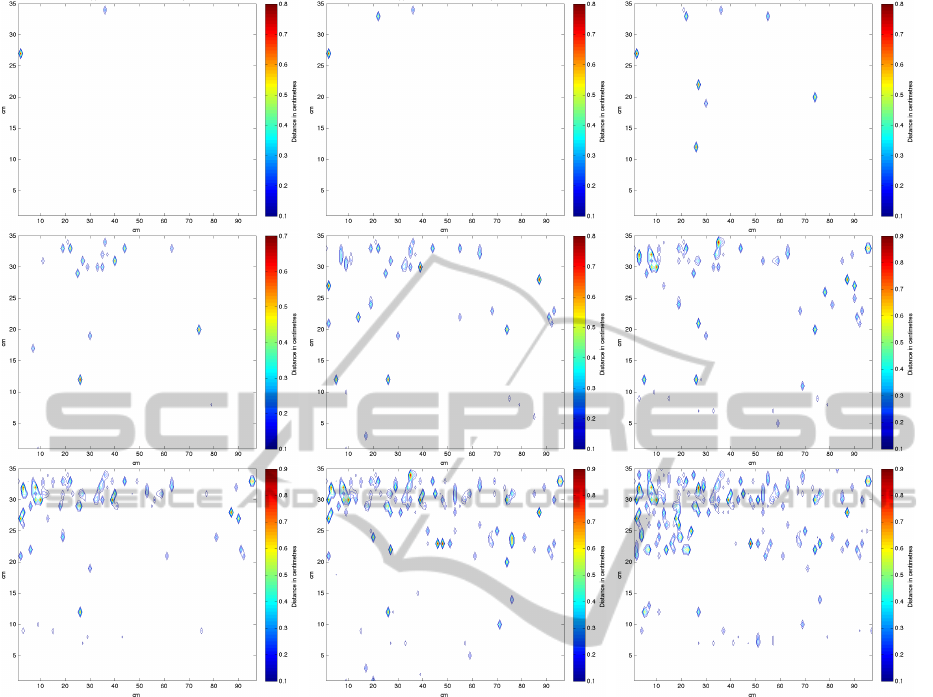
Figure 8: Translation contour plots on X-Y plane from a test sequence (from top left to bottom right).
Application in a Real Scenario
Our system has been designed for laboratory studies,
which take place on a controlled scenario considering
a scale model. Nevertheless, it is important to high-
light that the proposed method and measures are ef-
fectively applicable to a real scenario, since the break-
water movements estimation phase is uncoupled from
the data acquisition, independently from the consid-
ered scale. However, a real world application entails
some issues, which represent an interesting case of
investigation for future works.
A weather-beaten environment involves intrinsic
difficulty. The necessary equipment must be sealed
because of wind and water power causing damages.
This complicates the point clouds acquisition stage
(e.g. stabilization might be needed), but actually
doesn’t directly affect the calculation of the breakwa-
ter units shifts (that is, the movements calculation al-
gorithm would be the same). Despite that, bad light
and visibility conditions can cause unclear point cloud
reconstruction and lead consequently to an inaccu-
rate evaluation of the movements. This introduces
the need of a data processing procedure, aimed at the
enhancement of the point clouds for a precise move-
ments calculation.
In our experiments we used a Microsoft Kinect as
RGB-D camera to acquire point clouds. Like most of
the existing RGB-D cameras, the Kinect infers scene
depth by projecting an infrared light pattern (Zhang,
2012). Infrared light is not usable in scenes concern-
ing long distances and, above all, is not usable with
sun light. For real world application, hence, other
types of RGB-D cameras based on stereo vision tech-
niques must be used (e.g. (Woodfill et al., 2004)).
Dealing with bigger scenes does not imply only draw-
backs: we have discussed in Section 5 that rotation
contour plots suffer a certain amount of noise (see
Figure 9), given by the very reduced region where
normals are estimated (a sphere with radius of 1 cen-
timetre). In the case of a real breakwater, the cal-
culation of normal vectors would be done by using
VISAPP2015-InternationalConferenceonComputerVisionTheoryandApplications
82
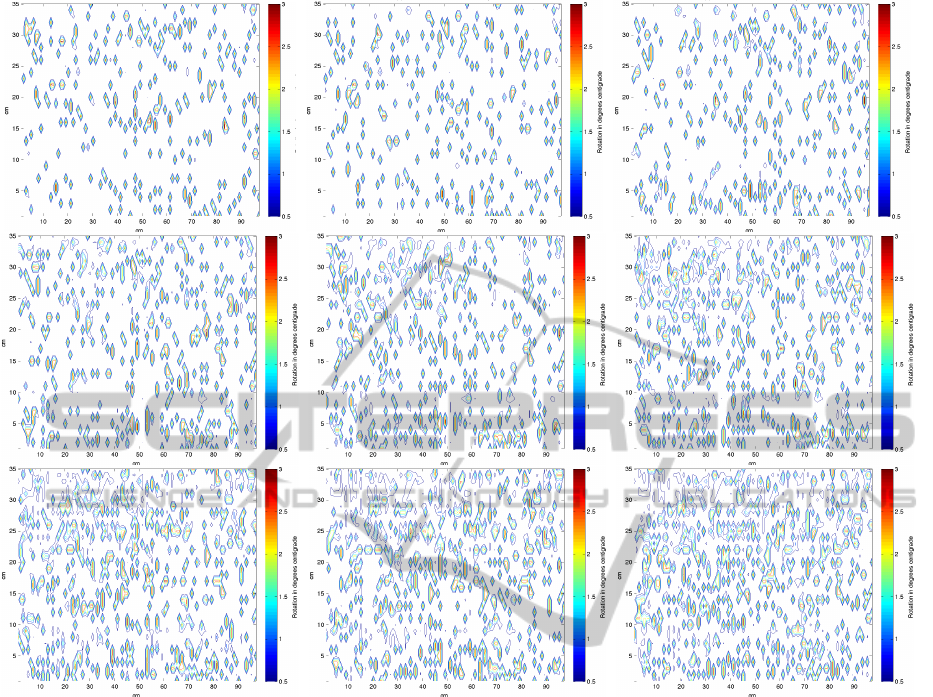
Figure 9: Rotation contour plots on X-Y plane from a test sequence (from top left to bottom right).
much bigger portions of the point cloud: this would
make the precision of the normal vector consider-
ably higher, boosting thus the accuracy of the rotation
movements monitoring.
REFERENCES
Auld, S. (2010). Innovation in underwater construction:
Benefits of real-time 3d imaging. CodaOctopus Prod-
ucts Ltd.
Bentley, J. L. (1975). Multidimensional binary search trees
used for associative searching. Communications of the
ACM, 18(9):509–517.
Berkmann, J. and Caelli, T. (1994). Computation of surface
geometry and segmentation using covariance tech-
niques. Pattern Analysis and Machine Intelligence,
IEEE Transactions on, 16(11):1114–1116.
Caimi, F. M. and Kocak, D. M. (1997). Real-time 3d un-
derwater imaging and mapping using a laser line scan
technique. In Optical Science, Engineering and In-
strumentation’97, pages 241–252. International Soci-
ety for Optics and Photonics.
Chen, Y. and Medioni, G. (1992). Object modelling by reg-
istration of multiple range images. Image and vision
computing, 10(3):145–155.
Kobayashi, M. and Kaihatsu, S. (1984). Hydraulic charac-
teristics and field experience of new dissipating con-
crete blocks (ACCROPODE). In Proceedings of 19th
Conference on Coastal Engineering, Houston, Texas.
Rusu, R. B. and Cousins, S. (2011). 3D is here: Point Cloud
Library (PCL). In IEEE International Conference on
Robotics and Automation (ICRA), Shanghai, China.
Van der Meer, J. (1987). Stability of breakwater armour lay-
ers - Design formulae. Coastal Engineering, 11:219–
239.
Woodfill, J. I., Gordon, G., and Buck, R. (2004). Tyzx
deepsea high speed stereo vision system. In Com-
puter Vision and Pattern Recognition Workshop, 2004.
CVPRW’04. Conference on, pages 41–41. IEEE.
Zhang, Z. (2012). Microsoft kinect sensor and its effect.
MultiMedia, IEEE, 19(2):4–10.
MonitoringAccropodesBreakwatersusingRGB-DCameras
83
