
System for Posture Evaluation and Correction
Development of a Second Prototype for an Intelligent Chair
Hugo Pereira
1
, Leonardo Martins
1,2
, Rui Almeida
1
, Bruno Ribeiro
1
, Cláudia
Quaresma
1,3
,
Adelaide Ferreira
1
and Pedro Vieira
1,4
1
Department of Physics, Faculty of Sciences and Technology New University of Lisbon,
Quinta da Torre, 2829-516, Caparica, Portugal
2
UNINOVA, Institute for the Development of New Technologie, Quinta da Torre, 2829-516, Caparica, Portugal
3
CEFITEC, Faculty of Sciences and Technology New University of Lisbon, Quinta da Torre, 2829-516, Caparica, Portugal
4
Centre of Atomic Physics, Faculty of Sciences and Technology New University of Lisbon,
Quinta da Torre, 2829-516, Caparica,, Portugal
Keywords: Posture Classification, Posture Guidance, Pressure Distribution, Sensing Chair, Sitting Posture.
Abstract: The sitting position has become one of the most common postures in developed countries. However,
assuming a poor sitting posture leads to several health problems, namely back, shoulder and neck pain. In a
previous work, an intelligent chair was developed and was shown to classify and correct the seating
position. This work describes improvements on this intelligent chair prototype culminating with the
development of a new prototype. The improvements of this new prototype are presented, resulting in new
studies for posture identification. Pressure maps for 12 sitting postures were gathered in order to
automatically detect user’s posture through a neural network algorithm, obtaining an overall posture
classification of around 81%.
1 INTRODUCTION
Nowadays, due to the rapid technological
development, automation and computerization of the
workplace, sitting has become the most common
posture in developed countries (Maria et al. 2007;
Chau et al. 2010; Hartvigsen et al. 2000; Graf et al.
1995). When a sitting position is adopted, most of
the bodyweight is supported by the ischial
tuberosities, thigh and the gluteal muscles. The rest
of the weight is distributed to the ground through the
feet and to the backrest and armrest when they are
available (Pynt et al. 2001). Furthermore, assuming
a poor posture can lead to back and neck pain due to
the anatomical changes of the spine and the
degeneration of the intervertebral discs and joints
(Lis et al. 2007; Graf et al. 1995). This fact has a
huge impact in the cost of work-related illness
(Waters 2004). Good posture is defined as the state
of balance between musculoskeletal structures that
prevents the appearance of lesions or their
progressive deformation, and its adoption should
prevent compensatory movements and evenly
distribute the weight (Pynt et al. 2001).
Through the years, several investigations have been
made to solve the problem of incorrect sitting
posture. Most of these researches are focused on
automatically detecting and classifying of the test
subject based on pressure maps given by pressure
sensors placed in chairs. Tan et al. (2001) used a
chair as an interface for human-computer
interactions. They used two Tekscan® sensor sheets,
with 42-by-48 sensing units for real time capturing
of contact information between the chair and its
occupant in both seat pad and backrest. The use of
pattern recognition technics to develop a static
posture classification algorithm, such Principal
Component Analyses (PCA), achieved an overall
classification of 96% and 79% for familiar and
unfamiliar users, respectively. Using the same
sensing system, Mota & Picard (2003) managed to
classify 9 static postures in real time, achieving an
accuracy of 87.9% when tested with postures from
new subjects. Zhu et al. (2003) compared several
classification algorithms regarding their static
posture classification capabilities and found that
PCA and Sliced Inverse Regression (SIR)
outperformed, in terms of overall posture detection,
204
Pereira H., Martins L., Almeida R., Ribeiro B., Quaresma C., Ferreira A. and Vieira P..
System for Posture Evaluation and Correction - Development of a Second Prototype for an Intelligent Chair.
DOI: 10.5220/0005286002040209
In Proceedings of the International Conference on Biomedical Electronics and Devices (BIODEVICES-2015), pages 204-209
ISBN: 978-989-758-071-0
Copyright
c
2015 SCITEPRESS (Science and Technology Publications, Lda.)

the k-Nearest Neighbour and Linear Discriminant
Analysis.
Andreoni et al. (2002) combined a motion
capture optoelectronic system and suitable pressure
sensor matrices to measure a car driver’s posture
parameters.
With the aim of reducing the number of pressure
sensors for posture identification Mutlu et al. (2007)
and Zheng & Morrell (2010) made another
approach. The first group studied a way to reduce
the number of sensors to 19, obtaining an overall
classification accuracy of 78%, improving the
classification when the number of sensors was
increased to 31, to 87%. The second group
developed a system with only 7 sensors and 6
vibrotactile actuators, designed to posture guidance
through haptic feedback. With a classification
algorithm based on the mean squared error between
the pressure measurements and the reference
pressure for each static posture, an overall accuracy
of 86.4% was achieved when distinguishing among
10 postures. This study also showed that is possible
posture guidance trough haptic feedback.
Daian et al. (2007) developed a simple system
where they used a chair equipped with force sensors,
one in the seat pad and other in the backrest. The
first one detects if someone is sitting and the other
informs about the adequateness of the sitting
position. The feedback to the subject, regarding
posture and time, is given trough a computer
program that identifies 3 different situations: the
person is not sitting, the person is sitting in an
adequate position, and the person is sitting in an
inadequate position. These 3 situations were
determined comparing the pressure values received
from the sensor with preset threshold values. The
threshold values were determined through repeated
measurements values in the same way that the
sensors' positions on the chair were determined. If an
inadequate posture was taken for more than 20
seconds or the user was sitting for more than a 20,
40 and 60 minutes a feedback to the user is given.
The feedback to the user is provided by a warning
agent placed on the desk next to the computer
display. Its warning should be understood as the
need to do a break.
Other approaches that do not need the use of
classification algorithms and interfaces with pressure
sensors can be taking in consideration. One of that’s
approaches can be the use of software like
WorkPace (Blangsted et al. 2004). This kind of
software is intended to educate users about muscle
fatigue and recovery. It recommends regular
exercises and stretching, displays alerts when breaks
are recommended, monitors the exposure and
intensity of computer use, and provides feedback.
In previous works (Martins et al. 2014; Lucena
et al. 2012), a chair prototype was built with the
objective of correcting and preventing poor posture.
In this first prototype the pressure cell concept was
introduced and its capabilities of differentiating 11
different posture using 8 air bladders distributed in a
matrix of 2 by 2 in the backrest and in the seat pad.
These air bladders were able to obtain pressure maps
and change their conformation (the amount of air
inside the bladders) by inflation and deflation. Our
main hypothesis is that by increasing discomfort
when a poor posture is adopted, the user will be
encouraged to change his position. That discomfort
will be made by inflating and deflating the air
bladders. We can also induce changes in the chair
conformation over a period of time, which can help
to eventually distribute the applied pressure on
contact zones, reducing user fatigue and discomfort
due to the pressure relief on compressed tissues. In
order to classify 11 different postures, the pressure
maps were used as input for an Artificial Neural
Network (ANN). The ANN were exported to a
mobile application and have been able to execute
postural classification in real-time. Results show
that, for 11 postures, in real-time classification the
overall score was 70%, but when the number of
positions decreases to 8, the overall classification
score was 93%. Two correction algorithms were
integrated in the mobile application in order to test if
the user is seated for long periods of time and also if
he or she is seated in an incorrect posture. In both
situations the chair’s conformation automatically
changes, inducing the user to adopt a more correct
posture. Despite significant achievements of this
previous work, some improvements are needed to
develop a better intelligent chair capable of real-time
classification and correction of sitting posture. For
that reason, the aim of this paper is present a new
prototype with improved features.
2 EQUIPMENT DEVELOPMENT
As in Martins et al. (2014) work, the aim of this
project was to adapt a regular office chair for sitting
posture detection and correction. Taking into
account the limitations in the previous prototype, we
propose to build a new improved one. With this
intent, several changes were made regarding the
design and control of the air bladders.
In order to posture guidance and correction, is
required an interface capable of measure the applied
SystemforPostureEvaluationandCorrection-DevelopmentofaSecondPrototypeforanIntelligentChair
205
pressure and change the chair´s conformation. For
that purpose air bladders were developed that are
able to inflate and deflate. One of the limitations
existing in the old prototype was the fact that the air
bladders were made manually using off the shelf
materials such as water bags used in back packs. The
problem with this approach lies in the fact that the
air bladders were not all identical, creating a
problem at the time of system calibration and
control. Therefore, for the new prototype, new air
bladders were design. The new air bladders were
design by NGNS Ingenious Solutions and
industrially built by Aero Tec Laboratories Inc. This
way we can guarantee all pressure cells have the
same dimensions and correctly fit the chair. In
Figure 1 it is possible to see the design of the air
bladders and how each one is distributed into a
matrix of 2 by 2.
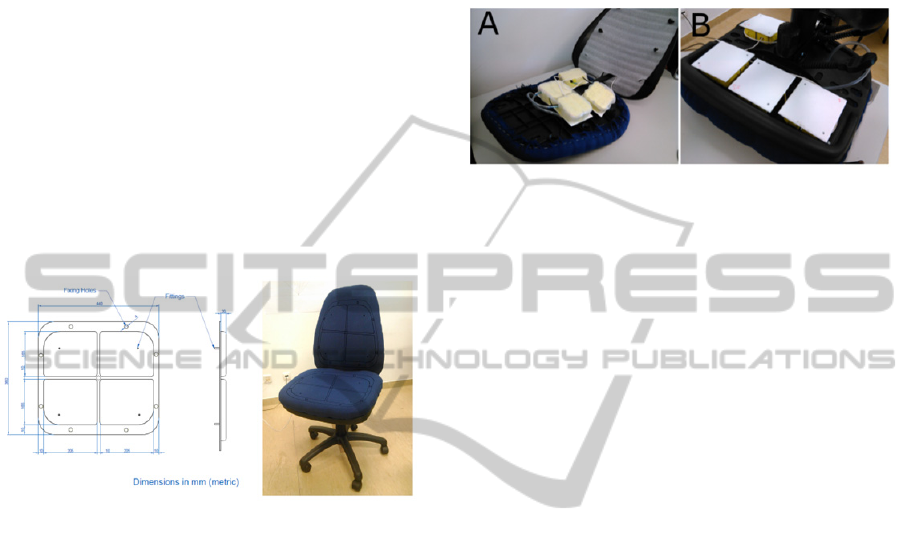
Figure 1: On the left is shown the design of the new air
bladders and on the right their position on the chair.
Two matrices containing the bladders were
placed under the original padding foam of the chair
in order to maintain the anatomical cut of the seat
pad and the back rest, totaling 8 air bladders. While
building the previous prototype, the calculated
pressure inside the bladders were shown to not be
significantly altered by using the original padding
foam of the chair.
Air bladders placement was strategically chosen.
According to previous literature, there are two types
of approaches: a pure mathematical and statistical
approach (Mutlu et al. 2007) and an anatomical
approach (Zheng & Morrell 2010). Based on the
second method we placed the air bladders in order to
cover the most important and distinguishable areas
of the body for detecting a seated posture, such as
the ischial tuberosities, the posterior thigh region,
the lumbar region of the spine and the scapula.
These are also the areas where most of the
bodyweight is distributed (Pynt et al. 2001).
In the previous prototype, all instrumentation
responsible for the control and measure of pressure
in the bladders was centralized in two places, one for
the backrest and other to the seat pad. In this new
prototype we approach the problem in a modular
way. Each one of the eight bladders is connected
through a rubber pipe to its control module. In case
of malfunction in a control module, it can easily be
replaced without compromising the others.
Figure 2: A – Placement of the control modules in the
back rest; B – Placement of the control modules in the seat
pad.
The control module is, in itself, an improvement.
Previously, each bladder would be connected to an
air pump and a solenoid valve. Air would flow out
of the bladders when the valve would open and
through gravity’s action, meaning there was no
effective control when decreasing pressure. Since
the system’s goal is to correct the user’s sitting
posture, it was understood that it would be an asset
to have a better control over the amount of air that
leaves the air bladders. For that reason, a vacuum
pump was added to each control module. In each
control module we can also find a piezoelectric
gauge pressure sensor to measure the internal
pressure of the bladder. The piezoelectric gauge
pressure sensors used were the Honeywell 26PC
Series rated to 5 psi with a sensitive of 10 mV/psi.
The placement of the control modules in the chair
can be seen in Figure 2.
In Martins et al. (2014), control and processing
of the pressure maps from the chair was essentially
made by the use of a smartphone. To achieve
independence from the use of a smartphone, a
single-board computer, the Raspberry Pi, was used
to control the chair’s instrumentation through an I
2
C
connection. A Bluetooth interface was added to the
RPi in order to connect it to the outside world,
enabling one to retrieve data and statistics through a
smartphone.
3 CLASSIFICATION OF SITTING
POSTURE
To create a Seated Posture Classification Algorithm,
one experiment for data acquisition was conducted
with the dataset presented in Table 1.
BIODEVICES2015-InternationalConferenceonBiomedicalElectronicsandDevices
206
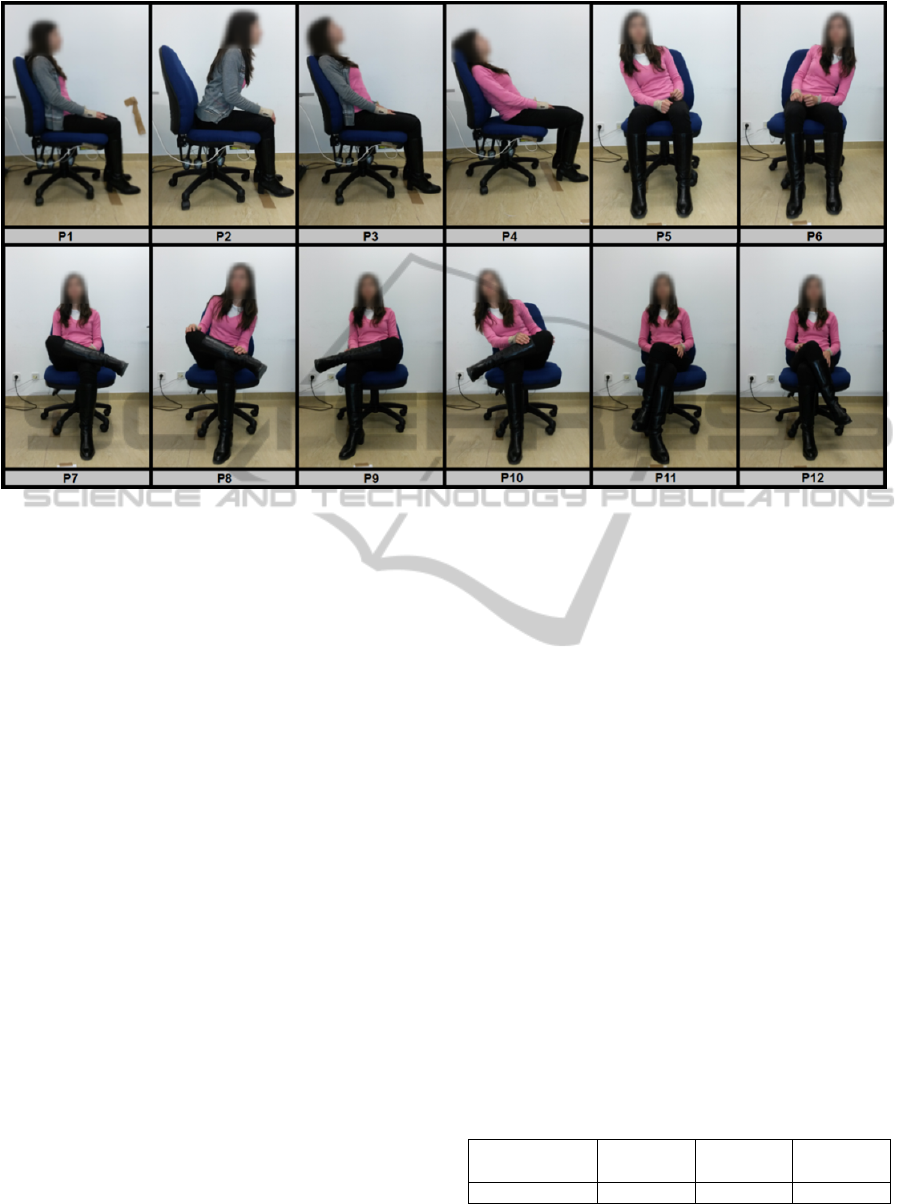
Figure 3: Seated postures used in the experiments and their respective class label: (P1) seated upright, (P2) leaning forward,
(P3) leaning back, (P4) leaning back with no lumbar support, (P5) leaning left, (P6) leaning right, (P7) right leg crossed,
(P8) right leg crossed, leaning left, (P9) left leg crossed, (P10) left leg crossed, leaning right, (P11) left leg over right, (P12)
right leg over left.
Before the experiment starts, it was necessary to
inflate the air bladders in order for them to have
enough air to accurately obtain the pressures maps.
It is important to say that the time of inflation must
be carefully chosen because is essential that the air
inside the air bladders doesn’t be enough to cause
discomfort to the users. For that reason, after some
tests, we decided to use a value of 5 seconds for
inflation. Before undergoing any experiment,
subjects were asked to empty their pockets and to
adjust the stool height so that the knee angle (angle
between the thigh and the leg) was at 90º and to
keep their hands on their thighs.
The experiment was comprised of two tests, the
first test involved showing a presentation of the
postures from P1 to P12 (for a duration of 20
seconds each), asking the subject to mimic those
postures without leaving the chair.
The second consisted in showing the same
presentation, with every posture being repeated two
times, but after every 20 seconds we asked the
subject to walk out of the chair, take a few steps and
sit back. The twelve postures chosen were based on
previous works and are represented in Figure 3 (Zhu
et al. 2003; Forlizzi et al. 2005; Tan et al. 2001;
Zheng & Morrell 2010; Mutlu et al. 2007; Vergara
& Page 2000).
Not all of the data acquired was used for the
classification, because when a user changes his
posture, the pressure maps will oscillate (Transient
zone) until they stabilize (Stable zone) as shown in
Figure 4. Here, we focus our study on the Stable
zone of the pressure maps and therefore, 12.5 out of
the 20 seconds were used. Since our sampling rate is
8 Hz, we were able to extract 100 data-points out of
the 12.5 seconds, which were divided in groups of
20 points. The average of those groups was used to
create 5 pressure maps for posture classification,
giving a total of 1080 maps for each posture (72
subjects x 3 repetitions x 5 pressures maps) and a
total of 12960 maps (1080 x 12 postures). All the
12960 maps were normalized to an input interval of
[-1, 1] for the ANNs. For the creation of the ANNs
we used the MATLAB® Neural Network
Toolbox™.
Table 1: Data of the participants in the experiment,
namely, Sex, Age, Weight and Height. Note: a Values for
Average ± Standard Deviation and (M/F) corresponds to
(Male/Female).
No. of
subjects (M/F)
Age
(years)
a
Weight
(Kg)
a
Height
(cm)
a
72 (37/35) 26,6±9,3 67,7±12,7 170,8±9,4
SystemforPostureEvaluationandCorrection-DevelopmentofaSecondPrototypeforanIntelligentChair
207
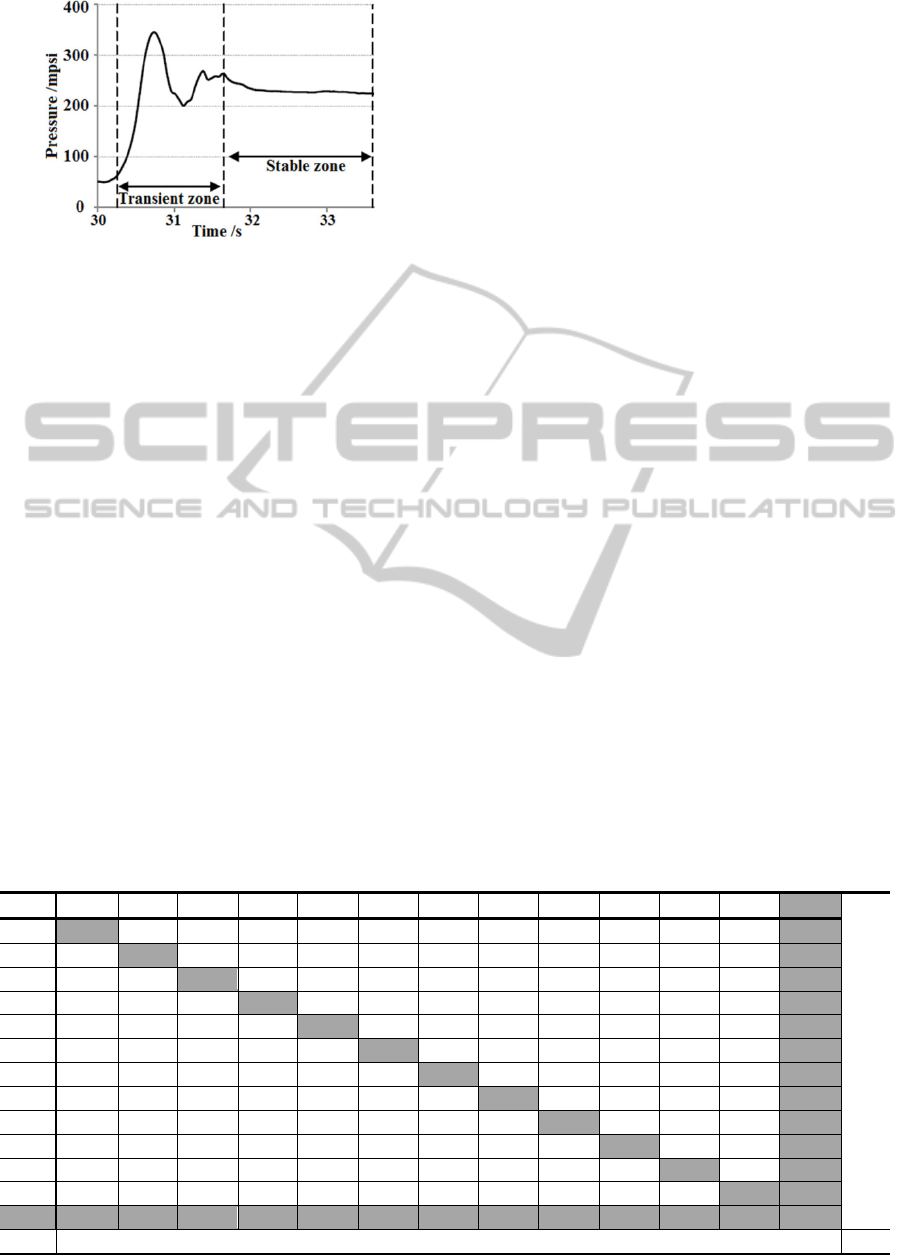
Figure 4: Pressure measurement from one air bladder,
when a subject went from posture P7 to P8, showing the
transient zone and the stable zone.
4 RESULTS AND DISCUSSION
4.1 Improvements of the Prototype
With the new prototype ready, it is possible to
compare it with its predecessor. Looking at Figure 5,
it can be seen that the changes made to the chair’s
structure were virtually inexistent when compared to
the previous model. In the previous one, great
number of important adaptions was required in order
to accommodate all the necessary components for
the functioning of the classification system. This
implies that this new prototype is closer to being an
easily adaptable system, regardless of the used chair.
The introduction of a vacuum pump in the
pneumatic module greatly improved the correction
control, since, as it was already mentioned, it is now
possible to effectively monitor the amount of air that
leaves the bladders.
4.2 Seated Posture Classification
Algorithm
For the parameterization of the ANN we used a
combination of 1 layer, 40 neurons and resilient
back propagation algorithm as the network training
function. We trained a new ANN to gather the
weights and bias in order to export them for real
time posture classification. For this we divided the
entire dataset in 60% for the ANN training, 15% for
the validation and the rest for the ANN testing. The
confusion matrix for all data is represented in Table
2 with the respective overall scores for each posture
class and the overall classification score. We
obtained an overall classification of 80.9%. This
result is comparable with the overall classification in
the work done by Martins et al. (2014). It is
important to notice that for this new test two new
positions were added, the P11 and the P12. As
expected postures with lateral inclination (P5, P6, P8
and P9) weren’t well distinguish between them. The
same problem is verified in positions with the legs
cross. To solve this situation, in a parallel work, we
are developing other classification alghoritms to
combine icnclination and leg crossing positions.
In the previous prototype (Martins et al. 2014), a
problem with the classification of posture P1 was
identified. The solution to solve that problem was to
use decision trees with specific threshold values to
divide into two neural networks (one specialized
Table 2: Confusion Matrix for posture classification of the training data, where rows indicate the Output Class and columns
indicates the Target Class. The Target Class labels correspond to the respective postures from figure 3. The grey boxes in
the main diagonal give the output classes that were correctly classified as the target class. The row and column in grey give
the percentages of correct classification in relation to the respective class and the overall classification score.
P1 P2 P3 P4 P5 P6 P7 P8 P9 P10 P11 P12 (%)
Output Class
P1 911 7 54 4 1 4 6 2 30 5 0 4 88.6
P2 19 989 11 6 21 8 31 9 8 9 8 7 87.8
P3 27 9 815 42 0 11 102 4 41 16 0 1 76.3
P4 0 3 26 957 13 0 5 9 21 5 19 28 88.1
P5 0 6 5 1 860 1 33 5 1 137 16 0 80.8
P6 0 0 0 1 5 815 5 115 27 5 0 30 81.3
P7 19 0 63 0 14 7 671 27 22 16 17 27 76.0
P8 0 0 2 2 0 102 26 777 7 0 3 54 79.9
P9 44 1 13 1 2 31 14 20 722 58 30 45 73.6
P10 0 1 24 4 86 0 11 0 35 721 23 7 79.1
P11 0 1 1 6 23 0 71 14 22 46 900 10 82.3
P12 5 8 11 1 0 46 50 43 89 7 9 812 75.1
(%) 88.9 96.5 79.5 93.4 83.9 79.5 65.5 75.8 70.4 70.3 87.8 79.2
80.9
Target Class
BIODEVICES2015-InternationalConferenceonBiomedicalElectronicsandDevices
208

Figure 5: Representation of the old (A) and new (B)
prototype.
identifying posture P1 and the other to classify the
remaining postures). However, preleminary tests
show that this new prototype will not need the
division in two ANNs due to its higher structural
stability, which caused classification problems in the
previous prototype. In the future, real-time
classification tests must be conducted to evaluate the
accuaracy of this new Prototype.
ACKNOWLEDGEMENTS
This project (QREN 13330 – SYPEC) is supported
by FEDER, QREN – Quadro de Referência
Estratégico Nacional, Portugal 07/13 and
PORLisboa – Programa Operacional Regional de
Lisboa. The authors wish to thank Eng. Pedro
Duque, Eng. Rui Lucena, Eng. João Belo and Eng.
Marcelo Santos for the help provided in the
construction of the first prototype.
REFERENCES
Andreoni, G. et al., 2002. Method for the analysis of
posture and interface pressure of car drivers.
Applied
Ergonomics
, 33, pp.511–522.
Blangsted, A.K., Hansen, K. & Jensen, C., 2004.
Validation of a commercial software package for
quantification of computer use.
International Journal
of Industrial Ergonomics
, 34(3), pp.237–241.
Chau, J.Y. et al., 2010. Are workplace interventions to
reduce sitting effective ? A systematic review.
Preventive Medicine
, 51(5), pp.352–356.
Daian, I. et al., 2007. Sensitive Chair : A Force Sensing
Chair with Multimodal Real-Time Feedback via
Agent. In
ECCE ’07 Proceedings of the 14th
European conference on Cognitive ergonomics:
invent! explore!
pp. 163–166.
Forlizzi, J. et al., 2005. The SenseChair : The lounge chair
as an intelligent assistive device for elders. In
DUX
’05 Proceedings of the 2005 conference on Designing
for User eXperience
. p. Article No. 31.
Graf, M., Guggenbuhl, U. & Krueger, H., 1995. An
assessment of seated activity and postures at five
workplaces.
International Journal of Industrial
Ergonomics
, 15(2), pp.81–90.
Hartvigsen, J. et al., 2000. Is sitting-while-at-work
associated with low back pain? A systematic , critical
literature review.
Scand J Public Health
, 28(3),
pp.230–239.
Lucena, R. et al., 2012. INTELLIGENT CHAIR
SENSOR-ACTUATOR - A Novel Sensor Type for
Seated Posture Detection and Correction. In
Proceedings of the International Conference on
Biomedical Electronics and Devices
. SciTePress -
Science and and Technology Publications, pp. 333–
336.
Maria, A., Katia, L.Æ. & Hayley, M.B.Æ., 2007.
Association between sitting and occupational LBP. ,
pp.283–298.
Martins, L. et al., 2014. Intelligent Chair Sensor:
Classification and Correction of Sitting Posture.
International Journal of System Dynamics
Applications
, 3(2), pp.65–80.
Mutlu, B. et al., 2007. Robust , Low-cost , Non-intrusive
Sensing and Recognition of Seated Postures. , 4(1).
Pynt, J., Higgs, J. & Mackey, M., 2001. Seeking the
optimal posture of the seated lumbar spine.
Physiotherapy Theory and Practice
, 17(1), pp.5–21.
Street, A., Automated Posture Analysis for detecting
Learner ’ s Interest Level Selene Mota and Rosalind
W . Picard Cambridge , MA 02139 , USA Abstract. ,
pp.1–6.
Tan, H.Z. et al., 2001. A Sensing Chair Using Pressure
Distribution Sensors.
IEEE/ASME TRANSACTIONS
ON MECHATRONICS
, 6(3), pp.261–268.
Vergara, M. & Page, D., 2000. System to measure the use
of the backrest in sitting-posture o $ ce tasks. , 31,
pp.247–254.
Waters, T.R., 2004. National efforts to identify research
issues related to prevention of work-related
musculoskeletal disorders.
Journal of
electromyography and kinesiology
, 14(1), pp.7–12.
Zheng, Y. & Morrell, J., 2010. A Vibrotactile Feedback
Approach to Posture Guidance. In
IEEE Haptics
Symposium
. pp. 351–358.
Zhu, M., Mart, A.M. & Tan, H.Z., 2003. Template-based
Recognition of Static Sitting Postures. In
Proceedings
of The Workshop on Computer Vision and Pattern
Recognition for Human Computer Interaction, held at
the IEEE Conference on Computer Vision and Pattern
Recognition (CVPR03), IEEE Computer Society,
Madison, Wisconsin
. pp. 1–6.
SystemforPostureEvaluationandCorrection-DevelopmentofaSecondPrototypeforanIntelligentChair
209
