
Data Acquisition in Cast Iron Foundries by Image Analysis
Bernd Dreier, Florian Blas and Alexander Kostgeld
Research projekt - IDA, University of Applied Sciences Kempten, Bahnhofstr. 64, 87439 Kempten, Germany
Keywords:
Image Processing, Data Acquisition, Process Monitoring, Object Detection, Industrial Applications.
Abstract:
The project IDA - Intelligent Data Acquisition is an interdisciplinary project in the fields of applied informat-
ics and mechanical engineering. Its purpose is to collect process relevant information in industrial foundry
processes like iron casting with handmade and mechanically made molds. Currently a lot of data sets are col-
lected by hand. But these contain inaccuracies and errors and are not available digitally for further analysis.
As a result it is not possible to evaluate them automatically. In particular it is not possible to conclude from a
defect cast part to the whole set of its production parameters. We develop several procedures to collect these
data sets and prepare them for computation in data analysis algorithms. The acquisition of digitally available
data in IDA is done mostly by optical sensors. In this paper we describe our approach especially regarding
marking and recognition of relevant objects. Furthermore we show first results in environments close to reality.
1 INTRODUCTION
In foundries the main problems in data acquisition
are missing continuity in the manufacturing processes
and difficult environmental conditions, for example
high temperatures above 1300 degree Celsius. As
an obvious result it is for example not possible to
work with transmitters like RFID tags. The operating
range for common RFID tags is up to 200 degree Cel-
sius, (Nicholson and Monahan, 1999). Other prob-
lems like difficult lighting conditions, air contamina-
tion and colorless elements complicate the data acqui-
sition by optical sensors, some of them are shown in
Figure 1.
Figure 1: Air contamination and difficult light conditions
during furnace tapping.
During the first project phase we analyzed the ex-
isting processes and identified the main reasons of
faulty parts. From common knowledge about foundry
processes we then gathered the different pieces of
data, which are necessary to identify the circum-
stances leading to the errors. Different procedures
must be implemented to collect the necessary data
mostly with digital image processing operations. At
this stage one main subject has been identified: Map-
ping of cast parts and sand cores to their date of cast-
ing respectively their use in a mold. This mapping is
essential for an assignment of faulty parts to the pa-
rameters of the casting process.
In the following section we want to motivate re-
search investigation in foundries. After that we de-
scribe the approach of our project and the current state
of two main subjects in our project, especially object
identification (tracking). The comparison with related
work in industrial research will be done in the subsec-
tions because the relevant research activities are quite
distinct for our different subjects. Finally, we will
give an overview of our achievements and an outlook
to further work.
1.1 Economic Dependency
Resources needed for production of cast parts are
mostly imported, like pig iron or coal. Other impor-
tant components are the seldom earth elements (SEE)
like Cerium or Bismuth. These elements are neces-
sary to influence the metallurgical structure of the cast
iron. For the extraction of these SEE strong econom-
ically hazardous procedures are exercised.
63
Dreier B., Blas F. and Kostgeld A..
Data Acquisition in Cast Iron Foundries by Image Analysis.
DOI: 10.5220/0005281600630070
In Proceedings of the 10th International Conference on Computer Vision Theory and Applications (VISAPP-2015), pages 63-70
ISBN: 978-989-758-091-8
Copyright
c
2015 SCITEPRESS (Science and Technology Publications, Lda.)
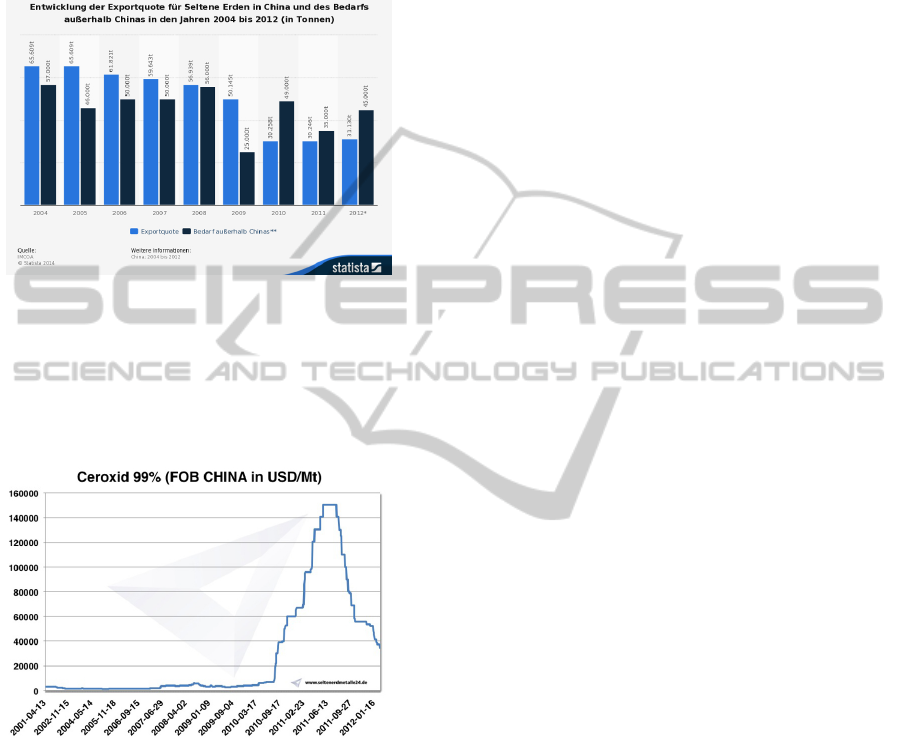
Main exporter of SEE is China, according to a re-
cent study the annual demand of SEE remains con-
stant, but the export rate of China decreased in the
last years. This is shown in Figure 2, an evaluation of
”Statista”, about the consumption of SEE.
Figure 2: Evaluation about the SEE consumption toward the
export value of China - the main exporter of SEE.
The low export rate since 2011 led to increasing
prices for the raw materials as described in Figure 3.
This trend was very difficult for the German foundry
branch. Since the last years the price fluctuation is
also occurred from the stock exchange.
Figure 3: Cost trend of SEE in the last years.
2 PROJECT DESCRIPTION
The research project IDA develops new ways to com-
bine existing iron casting processes with modern im-
age processing operations to collect process specific
information. There are no existing procedures to col-
lect such information yet, at least in medium sized
foundries. The main target is to record data sets which
are currently not collectable. With these data sets
it will be possible in the future to make predictions
of the cast part during the running production pro-
cess. An early intervention is possible and can reduce
scrap. However, the creation of the described predic-
tions is not subject of IDA. These were developed in
an earlier research project, (D. Hartmann, 2014).
2.1 Process Analysis
As described in Section 1 it is possible to make qual-
itative forecasts about a cast part, if data sets of the
casting process are available. However, different cast-
ing processes must be analyzed separately. Most of
the problems can be found in middle class foundries.
In IDA we work with three foundries and we eval-
uated the individual data situation of each project
partner. Each foundry has been analyzed concerning
their current data acquisition. It could be found that
the data situation strongly depends on the different
production processes. Foundries that produce high-
volume use molding machines that provide a good
data situation, but it is difficult to assign the given
data to an individual cast part or to a casting defect
as mentioned before.
However, in low-volume foundries which produce
with handmade molds the identification of cast parts
is not problematic, but the processes depend on the
situation and can change during the production and
data acquisition is mostly not realized at the moment.
To improve the general data situation it is necessary
to collect additional data sets and improve the data
assignment. These data sets can be categorized by the
following keywords:
• Cast part marker
• Sand core identification
• The way of melt
• Optical character recognition
• Cast spurt monitoring
• Flask layout
The main area of research in cast iron foundries
was the metallurgical properties. Whereby most of
the usable data sets come from the spectral analysis
of the melt, and the mechanical properties like im-
pact strength or tensile strength. Data correlations be-
tween the sand core and the mold and their influences
for an individual cast part cannot be rated at the mo-
ment. Professional literature describes the high influ-
ence rate of the molding sand to the cast part errors.
Values more than 70% are described in (Gagne, 2004)
at page 87.
2.2 Acquisition Methods
Error causes have been identified for the development
of the acquisition methods. For the data acquisition
new procedures were established who are capable to
VISAPP2015-InternationalConferenceonComputerVisionTheoryandApplications
64

integrate into the foundry process. To collect the im-
age data different camera types are necessary to col-
lect the image data:
• Industrial Cameras are used for:
– Cast part identification
– Object detection and tracking
– Optical character recognition
• Thermal image cameras are used for:
– Temperature detection
– Slag detection
– Fill level detection
The data transfer can be realized by a local area
network. For smaller data sets it is also possible to
use a wireless network. The data transfer in wireless
networks is not affected by the electromagnetic emis-
sion. Nowadays temperature measuring lances work
with wireless LAN in front of the furnace.
3 CURRENT STATE
Based on decisions about platform independency,
availability and real time usage, the test application
is developed in Qt using C++. For common image
processing operations OpenCV is used. The graphi-
cal user interface is developed as a debug and moni-
toring tool. The implementation of data interfaces is
not planed by IDA but can be done in the future.
To simplify the implementation we decided to de-
fine different modules. Every module works as an
own workflow and can be started and managed from
the graphical user interface. The user can decide
which module should be observed and can interact
with it.
The combination of these modules can change by
the field of application. A foundry with mold ma-
chines can define other module constellations than a
foundry with hand made molds.
3.1 Individual Marker Detection
The implementation of individual marker detection
was developed to solve the individualization of the
production of cast parts in molding machines. This
is also demanded by the automotive industry, leading
to cast parts with a complete traceability, (Clemens,
2008). During the implementation and further analy-
sis of the marker elements another field of application
could be found with the labelling of ladles and molds.
3.1.1 Recent Work
Several different ways are available for the marking of
castings. Most of them are very expensive or not pre-
cise enough. The availability of procedures depends
also on the cast way. Handmade forms can be labeled
with pre-made numbers that are inserted into the neg-
ative form. However, machine made molds can just be
marked during the short production process. The list
of available marker elements is as short as the corre-
sponding academic literature described in (Wadhwa,
2013).
Cast clocks are not precise enough, because they
use one number for a specified time span. In the
professional journal ”Giesserei”, the University Harz
presents an innovative cast clock (Meissner, 2011)
but the device cannot be integrated into a molding
machine because of the relatively big control unit.
Whereby the procedure with laser marker can be done
precise enough, but the devices are too expensive
(Meissner, 2011).
The United States Patent (Hovorka, 1996) de-
scribes a procedure using an expandable plastic tag
and a slot in the cast part. The main problem of
this process is the size requirement, also described in
3.1.3. Another problem is that cast parts produced in
molding machines cannot be marked in the order they
are produced. The plastic tag must be inserted to the
cast part by hand but they travel a long distance in
the automatical molding machine and overtake each
other. At least in the shaker or the sandblaster, which
are necessary to release them from the molds. We
found that cast parts got a delay of nearly 10 - 15 min-
utes. By a clock cycle up to 7 seconds the procedure
is not exact enough for the data mapping.
The test of the availability of other code elements
for example the gray code described in (E.N.Gilbert,
1957) showed that the redundance is absolutely suf-
ficient but the size requirements based on the neces-
sary individual marker elements and the forgeability
in cast parts are not suitable. Figure 4 shows a gray
code element with 8 different positions. The individ-
ual positions are not enough as it has been described
in 3.1.2. In our experience it was also not possible to
scale them down to our size requirements from 3.1.3.
Figure 4: Gray code with 8 positions from (Gray, 1947).
DataAcquisitioninCastIronFoundriesbyImageAnalysis
65
3.1.2 Marker Specific Requirements
The requirements to the representable area are also
different. The area for the marker detection depends
on the mold machine. At the moment every cast part
gets the cast day and the nest number. The cast part
can just be identified to the production day and to the
nest number. With the current available data sets it is
not possible to define exactly which melt was used for
the production of a specific part.
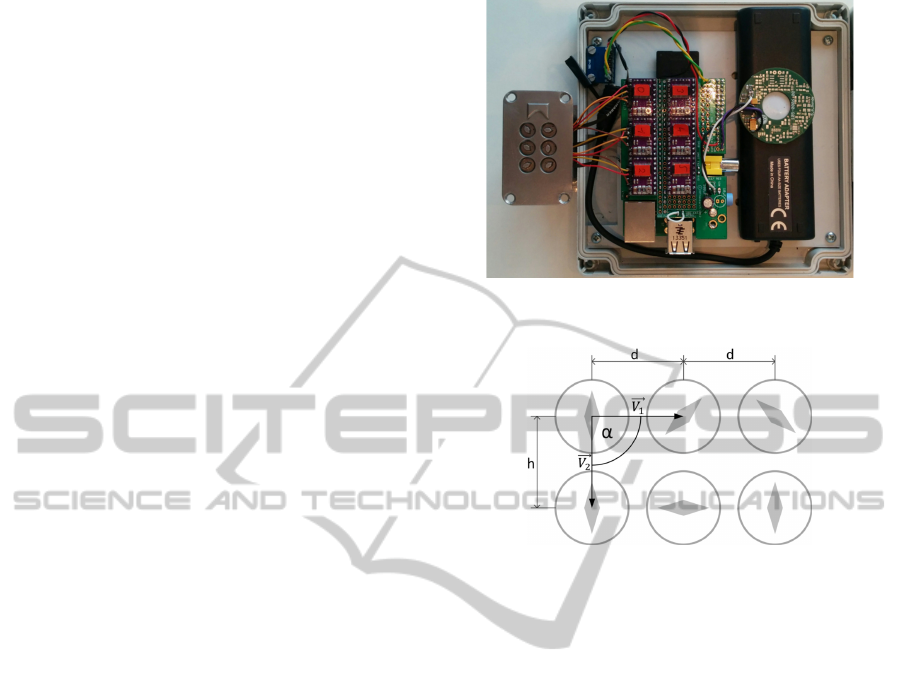
Based on these findings, we developed a new code
and a corresponding marking element. It is based on
currently 6 needles, which can have different orienta-
tions. A picture of the marking element in a test sce-
nario is shown in Figure 5. With the new procedure
the mold number can be added to the cast part. Every
cast part gets an additional identification element and
is individual determinable. To test the usage of the
marker elements in foundries different test cases were
defined. To ensure the usability, six needles are suffi-
cient to mark every cast part in a production charge.
With the six needles a maximum count of 4096 in-
dividual positions are available. Assumed by a cycle
time of 7 seconds nearly 1000 molds can be molded in
a charge of 2 hours, without idle time. If more mark-
ers are necessary more needles can be added to the
marker device. On the current used prototype every
needle has 4 positions. The results of an test proto-
type showed that more positions are not detectable, as
described in Section 3.1.8.
3.1.3 Size Requirements
To secure a minimal modification on the cast part and
on the molding machine a few specific values must
be added. The actual available size on the cast parts
is 30mm x 16mm. The available size for the marker
control device depends on the negative mold actually
a mold thickness of 40mm is necessary.
The device is designed to work completely auto-
nomic. No additional connections like external en-
ergy supply or a connection to a control device are
necessary. Figure 5 shows the test arrangement to
controll the marker device.
3.1.4 Detection Procedure
For detection of a cast part the location and interpre-
tation of the needle positions is needed. The detec-
tion procedure is separated into different steps, all of
them are necessary for a complete rating. Through the
following steps the surrounding circles of the needles
can be detected with processes like hough transforma-
tions. The circles must be rated based on their posi-
tions. This process is similar to the described process
Figure 5: Test arrangement of the marker device. As a mo-
tor controller a raspberry Pi was used with a breakout kit.
Figure 6: Schematically dimensioning of the marker detec-
tion element.
of the traffic sign detection from (Lorsakul, 2007).
Difficult light conditions and air contaminations like
fog are also comparable problems.
The whole image processing pipeline for this task
can be seen in Figure 7.
In the following subsections we will outline our
solutions for the different stages above.
3.1.5 Orientation Detection
A position helper element was defined and integrated
to the marker device, to detect the position and ori-
entation. But the dimensions of the orientation ele-
ment was to small, especially with draughts. Figure 8
shows the result of the line detection. It was planned
to use the Hough line detection, as described in (Duda
and Hart, 1972), and evaluate the detected lines in ref-
erence to their orientation and length. But the results
are not applicable.
The detection and interpretation of the needles are
not affected. The problem is the orientation and clas-
sification of the needles, and must be noted in the code
interpretation 3.1.9. At the moment two different ori-
entations are possible.
VISAPP2015-InternationalConferenceonComputerVisionTheoryandApplications
66
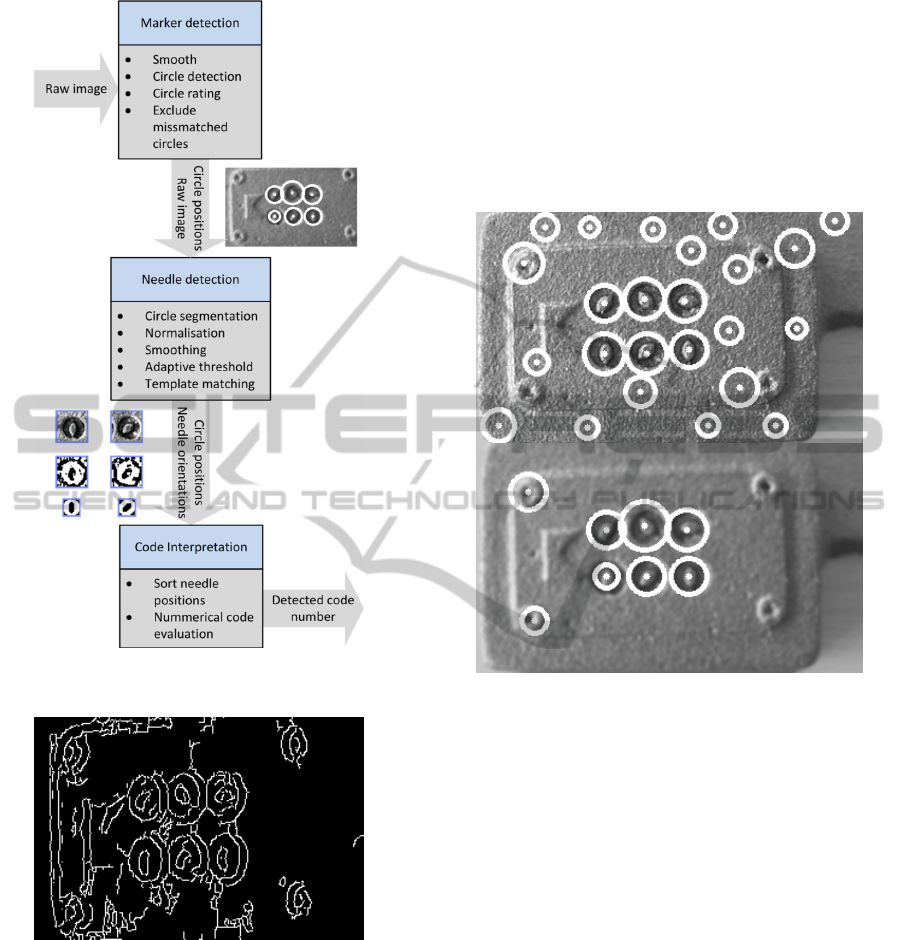
Figure 7: The image processing pipeline of the marker de-
tection procedure.
Figure 8: The line detection generates quite good results by
the circles, but the orientation helper on the left side can not
be detected.
3.1.6 Circle Detection
With the OpenCV method houghCircles it is possi-
ble to detect the needle positions. The method offers
some parameters like a threshold for the canny edge
detector or some circle features as described in (La-
ganiere, 2011) at page 176. Another influence to the
Hough transformation can effect with a Gaussian blur.
It is necessary to smooth the structure of the cast part
to reduce the mismatches, and improve the quality of
the circle detection.
Figure 9 shows the detected circles, in the upper
image a lot of wrong circles are detected, the image
below was done with the described blur. This ef-
fect was described from (Laganiere, 2011) on page
176 and (Lorsakul, 2007). Similar operations are de-
scribed by (Kimme et al., 1975), in this case the circle
detection was improved with thresholding operations.
Figure 9: Circle detection: Original grayscaled image - a
lot of circles are detected because of the cast part structure,
the smoothed image shows just a few mismatches.
If the smooth effect is too much the circle detec-
tion does not deliver all needle positions. The marker
element can’t be detected if too many needles are
missing and the circle rating can not be done.
3.1.7 Circle Rating
A cast part can show more circles than given by the
marker element. Beside the cast part structure dif-
ferent influences like borehole markers, cast errors
and other geometric elements can be detected as mis-
matches by the circle detection. To handle this situa-
tion we developed a procedure based on our geomet-
ric properties as described in Figure 6. The first step is
to create cluster with circle accumulations. After this
preselection all single detected circles lying outside
are no longer considered.
In the following procedure we define ”used cir-
cles”. A used circle describes the position of a nee-
dle and will be used to make a segmentation of the
original image data. The definition of a used circle
depends on the dimensioning of the marker detection
DataAcquisitioninCastIronFoundriesbyImageAnalysis
67
element. Each circle needs two or three neighbours
in a specified distance according to the position. Fig-
ure 10 shows the needle position after the building of
clusters.
Caused by irregularities of different influences
like lightning conditions, cast structure or cast errors
the detected center can differ from the real needle po-
sition. Affected by these variations it is necessary to
define thresholds for the rating.
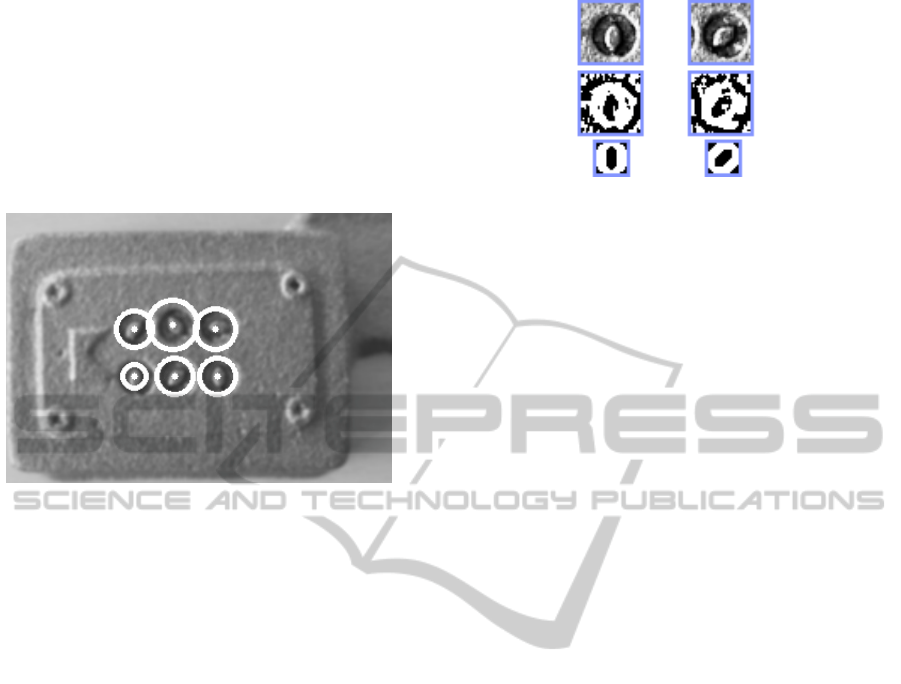
Figure 10: Detected needle positions after the clusterisation
procedure.
To ensure that the circles are part of the marker
element it is necessary to calculate the distance be-
tween them. Another advantage of the arrangement is
that the circles are connected with a square angel. The
scalar product of the vectors between the neighbours
is nearly 0, because of the before described irregular-
ities.
3.1.8 Needle Identification
The needle identification needs the original image
data. The positions of the detected circles from sec-
tion 3.1.7 indicates the needle positions. These posi-
tions are used to create for each needle a segment of
the original image. To detect the needle orientation,
different matching procedures can be used. Because
of irregularities like cast defects and cast structure it
is necessary to work with similar image processing
operations as described in section 3.1.6. Every needle
has 4 predefined positions.
To detect the needle orientation different match-
ing procedures are available, the best results are de-
termined by the template matching with 4 position
templates. With more than 6 positions in the given
size and in average lighting conditions a lot of miss
matches occurred and detecting rate drops below
80%. These errors are attributed to inaccuracies and
cast errors, which we will find in realistic environ-
ments.
For the template matching it was necessary to de-
fine an extraction process to ensure that the influences
Figure 11: Template for the template matching procedure -
the Figure shows the possible orientations {0, 1, 2, 3}.
caused by cast structure, color differences and differ-
ent light conditions can be minimized. This effect is
also described by (Parker, 2011) on page 333.
The best results of the matching procedure could
be determined by the usage of the needle shape. To
extract the needle contour of the segmented image
we are using different algorithms. The first step is
a downscale of the segmented image. This reduces
the influences of the cast defects and the cast struc-
ture. The normalization increases the contrast of the
image and optimizes the differences between the nee-
dle and the circle. By a Gaussian blur influences of
cast defects and structure can also be minimized.
For shape extraction we are using an adaptive
threshold. Threshold methods with an constant value
were not sufficient. Furthermore an adaptive thresh-
old is more robust respectively to non uniform illumi-
nations and the background, as described in (Leong
and Yue, 2009).
The resulting binarized image contains the shape
of the needle and can be used as input for the template
matching procedure of OpenCV. Figure 11 shows the
different stages for the recognition of needle posi-
tions.
With the used test images all needles could be de-
tected. To use the application in real foundry condi-
tions the process we expect that the detection has to
be even more robust. The planed improvements are
described in section 3.1.11.
3.1.9 Code Interpretation
The marker detection is based on a four number sys-
tem, as described in section 3.1.2 and 3.1.8. Several
standard algorithms are available for the interpreta-
tion and can be used for the implementation.
3.1.10 Result
With the implementation of the marker detection were
proved that a identification of the marker elements is
possible. To ensure the practicability in real world
environments additional works must be done. In Sec-
tion 3.1.11 the next steps for the implementation are
VISAPP2015-InternationalConferenceonComputerVisionTheoryandApplications
68
described.
The marker device must be improved with an ori-
entation element. The currently used element can not
be detected at the moment as described in Section
3.1.5.
3.1.11 Next steps
It is planed to improve the result of the marker de-
tection and minimize error rates. To improve the
matching additional procedures like support vector
machines can be implemented and tested (Baggio,
2012), another approach would be the identification
by keypoints like ORB, as described in (Ethan, 2011).
To improve the detectability of the marker the device
will receive an new orientation helper. The current
problems are described in Section 3.1.5.
3.2 Sand Core Identification
The high influence rate of the molding sand was de-
scribed in Section 2.1. A lot of cast errors are caused
by mold and not by melt. Core breaks, breakouts or
gas blows are some of them. But the most cast errors
have different influences, (Hasse, 2003) page 4. In
many cases it is difficult to determine the real reasons.
To simplify the finding of cause-impact coherences it
is necessary to merge mold specific information to the
cast part. For sand cores this is not possible at the mo-
ment. On the other side, sand cores are necessary to
shape complex geometric molds.
We investigated in the idea of the identification of
a sand core by sand structure like an individual ”fin-
gerprint”. To test the practicability of image detection
processes to identify a simple sand core shape it was
necessary to make some different images from differ-
ent sand cores, this is described in 3.2.2. Figure 12
shows the structure and the shape of a sand core.
Figure 12: Sand core with simple shape and sand structure.
3.2.1 Recent Work
To the best of our knowledge, no one has investigated
in the identification of sand cores as we could not find
similar research work.
However, general matching procedures like key-
point detection and matching or template matching
procedures are available and approved. For exam-
ple the ORB keypoint detection, described in (Ethan,
2011), can be used for the detection tests. The detec-
tion process with ORB keypoints is quite faster, and
free to use instead of SIFT and SURF (Ethan, 2011).
3.2.2 Test Setup
With the first test it was planned to show that ev-
ery core is individual and distinguishable, and can
be detected from other sand cores. The test area was
about 50 different sand cores, with a pre-defined dis-
tance from the camera. This reduces influences to the
matching result, for example scale variances.
Every circle element with the sand core structure
was segmented from the image. The segmented im-
age is used to test different image processing proce-
dures with the original images. Every segmented cir-
cle is matched with all sand cores. That means we
could match 50 segmented images with 50 original
images. And got an matching pool of 2500 posibili-
ties for our evaluation.
For the matching procedure we defined different
algorithms. First of all we tested an template match-
ing. But the problem was the rotation as described in
Section 3.2.3.
All segmented images could be detected, but the
main problem of the template matching procedure is
that the results are highly influenced of the orientation
of the original sand core.
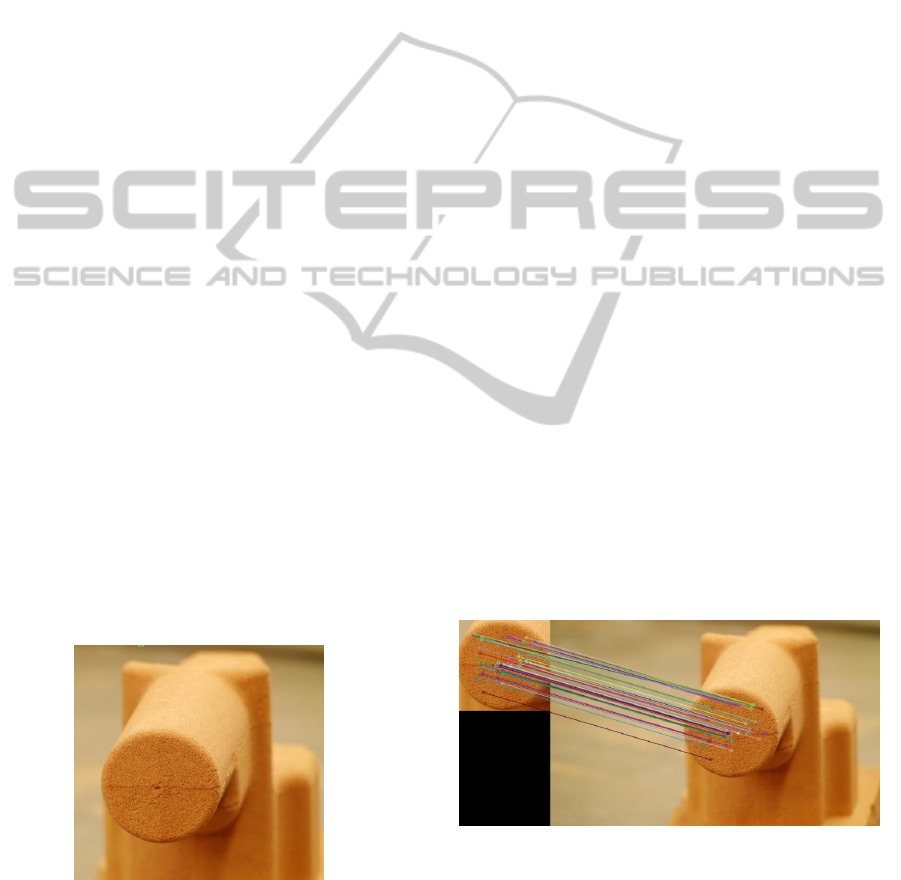
The second tested procedure was a key point de-
tection using ORB keypoints, described in (Ethan,
2011). Figure 13 shows the result of the matching
procedure.
Figure 13: Keypoint detection procedure with correct
match.
The results to distinguish sand cores by their in-
dividual structure are quite good, all cores could be
identified. But the evaluation of the keypoint detec-
tion shows similar problems as the template matching.
Rotation and scale variances have a highly influence
rate to the matching process.
DataAcquisitioninCastIronFoundriesbyImageAnalysis
69

3.2.3 Result
In the foundry the matching procedures can not be
used at the moment. The sand cores pass through a
long way between the production and the assembly to
the mold. On the whole way the orientation of the
sand core can not be defined and the distance of the
camera can change.
However we could show that the sand cores are
distinguishable. In Section 3.2.4 we suggest some ad-
ditional procedures for continue works on the sand
core identification.
3.2.4 Next Steps
To improve the identification rate of the sand cores
additional physical notches can be added to the sand
cores to simplify the orientation detection of the sand
cores. Another approach can be done by object de-
tection. The shape of the sand core can be detected
and delivers additional information about the position
orientation and distance.
4 CONCLUSION
In this research paper we have shown that optical
sensors may well be used for data acquisition in the
rough environments of foundries. Especially for mid-
dle sized foundries with automation levels from low
to medium this approach is very promising. We have
developed a complete object marking and recogni-
tion system for cast parts, including a self developed
code, an autonomous mechanical marking element
for molds and a procedure to recognize the marked
cast parts by image analysis. With the planned im-
provements described above we expect to achieve ac-
ceptable failure rates. Furthermore we have investi-
gated in sand core identification by image analysis.
In that process we are not as close to an industrial
application like in the case of cast parts. The main
problem in this case is, that the recognition methods
which work well are not rotation invariant. We plan to
improve this method by adding notches to the cores,
which allows the recognition procedure to identify the
orientation in a first step.
Our next steps are further improvements for the
processes described in this paper, especially regarding
the robustness of our algorithms. Furthermore, there
are more process parameters to be acquired, e.g. anal-
ysis of cast spurts and flask layout or damage recog-
nition for sandcores. The initial analysis of our col-
leagues of mechanical engineering has shown, that the
first two important acquired data sets described in this
paper will already help to reduce failure rate in the ex-
amined foundries extremely. It is important to men-
tion, that only a few defect cast parts may cause very
high impact to total cost and, of course, to nature, be-
cause especially in medium sized foundries cast parts
tend to be quite large, up to ten or twelve tons.
REFERENCES
Baggio, D. (2012). Mastering OpenCV with Practical Com-
puter Vision Projects. PACKT Publishing, Birming-
ham, 1st edition.
Clemens, H. (2008). BuhlMark praegt die Produktdaten
auf das Gussteil und macht damit jedes Teil eindeutig
rueckverfolgbar.
D. Hartmann, J. Gottschling, S. M. M. S. (2014). Intelli-
gente Prozesssteuerung in Giessereien.
Duda, R. O. and Hart, P. E. (1972). Use of the Hough Trans-
formation To Detect Lines and Curves in Pictures.
E.N.Gilbert (1957). Gray Codes and Paths on the n-Cube.
Ethan, R. (2011). Orb: an efficient alternative to sift or surf.
In Computer Vision (ICCV), 2011 IEEE International
Conference on, pages 2564–2571. IEEE.
Gagne, M. (2004). Sorelmetal Gusseisen mit Kugelgraphit.
Rio Tinto Iron and Titanium, Montreal (Quebec), 1st
edition.
Gray, F. (1947). Gray Code.
Hasse, S. (2003). Guss und Gefuegefehler. Schiele und
Schoen, Berlin, second edition edition.
Hovorka, F. (1996). Method for identifying cast parts. US
Patent 5,584,113.
Kimme, C., Ballard, D., and Sklasnky, J. (1975). Finding
Circles by an Array of Accumulators.
Laganiere, J. (2011). OpenCV 2 Computer Vision Appli-
cation Programming Cookbook. PACKT Publishing,
Birmingham, 1st edition.
Leong, L. K. and Yue, W. (2009). Extraction of 2D Barcode
Using Keypoint Selection and Line Detection. In Ad-
vances in multimedia information processing - PCM.
Springer-Verlag.
Lorsakul, A. (2007). Traffic Sign Recognition for Intelli-
gent Vehicle/Driver Assistance System Using Neural
Network on OpenCV.
Meissner, K. (2011). Die neue Giessuhr vollflexibles
Markiersystem fr Gussteile.
Nicholson, M. and Monahan, B. (1999). Having the capa-
bility of operating over a broad range of temperatures;
capable of operation in harsh, high temperature fac-
tory environments. US Patent 5,973,599.
Parker, J. R. (2011). Algorithms for Image Processing and
Computer Vision. Wiley Publishing, Inc., Indeanapo-
lis, second edition edition.
Wadhwa, R. S. (2013). Traceability and Data Support in
SME Manufacturing.
VISAPP2015-InternationalConferenceonComputerVisionTheoryandApplications
70
