
Fast Alignment-free Comparison for Regulatory Sequences
using Multiple Resolution Entropic Profiles
Matteo Comin and Morris Antonello
Department of Information Engineering, University of Padova, Padova, Italy
Keywords:
Alignment-free, Sequence Comparison, Entropic Profiles.
Abstract:
Enhancers are stretches of DNA (100-1000 bp) that play a major role in development gene expression, evolu-
tion and disease. It has been recently shown that in high-level eukaryotes enhancers rarely work alone, instead
they collaborate by forming clusters of cis-regulatory modules (CRMs). Even if the binding of transcription
factors is sequence-specific, the identification of functionally similar enhancers is very difficult and it cannot
be carried out with traditional alignment-based techniques. In this paper we study the use of alignment-free
measures for the classification of CRMs. However alignment-free measures are generally tied to a fixed reso-
lution k. Here we propose an alignment-free statistic that is based on multiple resolution patterns derived from
Entropic Profiles. Entropic Profile is a function of the genomic location that captures the importance of that
region with respect to the whole genome. We evaluate several alignment-free statistics on simulated data and
real mouse ChIP-seq sequences. The new statistic is highly successful in discriminating functionally related
enhancers and, in almost all experiments, it outperforms fixed-resolution methods.
1 INTRODUCTION
Many articles (Shlyueva et al., 2014) discuss re-
cent views on enhancers or cis-regulatory modules
(CRMs), and their coordinated action in regulatory
networks. Enhancers are stretches of DNA (100-1000
bp) that play a major role in development gene ex-
pression, evolution and disease. Indeed, they can up-
regulate, i.e. enhance, the transcription process. As a
result, during animal development, a single cell gives
rise to a multitude of different cell types and organs,
that acquire different morphologies and functions by
expressing different sets of genes.
It is worthwhile summing up their main features.
First, they contain short (6-15 bp) DNA motifs that
act as binding sites for transcription factors (TFBSs)
and often allow different nucleotides at some of the
binding positions, in other words there may be word
mismatches. Second, they act seemingly indepen-
dently of the distance and orientation to their target
genes as a consequence of looping. It follows that the
strand to which a CRM under study belongs is un-
known so both cases need to be considered. Third,
they maintain their functions independently of the se-
quence context, they are modular and contribute ad-
ditively and partly redundantly to the overall expres-
sion pattern of their target genes. Finally, enhancers
with similar transcription factors binding sites con-
tent have a high probability of bearing the same func-
tion. Thus, it is evident that predictions and classi-
fications of enhancers can be addressed by similar-
ity searches. However the presence of multiple bind-
ing sites can make the localization of each enhancer
very difficult. For these reasons biologists need first
to screen ChIP-seq datasets to select cell-specific reg-
ulatory sequences, which are based on common con-
tents.
In this context the idea to describe a sequence by
its word content fits very well the model of CRMs,
where we assume that a similar function is driven by
the presence of different binding site contents (Comin
and Verzotto, 2010; Comin and Verzotto, 2014). The
comparison of sequences without an alignment, and
thus based on word distributions, is usually referred
as alignment-free. The use of alignment-free methods
for comparing sequences has been proved useful for
a variety of different tasks (Foret et al., 2009; Comin
et al., 2014; Comin and Verzotto, 2011; Comin and
Schimd, 2014). See Vinga and Almeida for a com-
prehensive review (Vinga and Almeida, 2003). How-
ever the major drawback of alignment-free measures
is that they are all tied on the choice of the resolution
k, which crucially influences performances but can-
not be known in advance. In this paper we extend the
171
Comin M. and Antonelli M..
Fast Alignment-free Comparison for Regulatory Sequences using Multiple Resolution Entropic Profiles.
DOI: 10.5220/0005251001710177
In Proceedings of the International Conference on Bioinformatics Models, Methods and Algorithms (BIOINFORMATICS-2015), pages 171-177
ISBN: 978-989-758-070-3
Copyright
c
2015 SCITEPRESS (Science and Technology Publications, Lda.)

idea of alignment-free measures accounting for mul-
tiple resolutions. In particular we will show that En-
tropic Profiles (Vinga and Almeida, 2007; Fernandes
et al., 2009) pave the way to more robust but still effi-
cient alignment-free methods.
1.1 Previous Work on Alignment-free
Measures
The common way to identify homologous sequences
is sequence alignment, for which many algorithms
have been proposed in literature (Smith and Water-
man, 1981) (Altschul et al., 1990). Nevertheless
they are unsuitable for predicting and classifying en-
hancers through the matching of transcription factor
binding sites for many reasons (Vinga and Almeida,
2003) (Song et al., 2014): 1) item enhancer location
and orientation do not matter so no reliable align-
ment can be obtained; 2) they are time-consuming
and inadequate for comparing sequences in realisti-
cally large datasets, e.g. large ChIP-seq datasets; and
3) enhancers do not work alone and their coordinated
action can not be fully explored with a single align-
ment.
On the contrary, alignment-free approaches pro-
vide viable alternatives (Vinga and Almeida, 2003)
(Song et al., 2014). With the aim of effectively sum-
ming up sequence content they are usually based on
k-mer counts. Consider two genome sequences A and
B and let A
w
and B
w
be the frequencies of word w, of
length k, in A and B.
Historically, D
2
(Blaisdell, 1986), see Formula 1,
is one of the first proposed similarities and is defined
as the inner product of the k-mer frequency vectors.
Despite its simplicity and distance properties, D
2
can
be dominated by the noise caused by the randomness
of the background and has low statistical power to de-
tect potential relationship. As a result, more powerful
variants, D
S
2
and D
∗
2
(Reinert et al., 2009), see Formu-
las 2 and 3, have been developed by standardizing the
k-mer counts with their expectations and standard de-
viations. Let
˜
A
w
= A
w
− (n− k+ 1) ∗ p
w
, where p
w
is
the probability of w under the null model.
D
2
=
∑
w
A
w
B
w
(1)
D
s
2
=
∑
w∈Σ
k
˜
X
w
˜
Y
w
p
˜
X
2
w
+
˜
Y
2
w
(2)
D
∗
2
=
∑
w∈Σ
k
˜
X
w
˜
Y
w
(n− k + 1)p
w
. (3)
These statistics have been used as a raw measure
of similarity in a number of different studies (G¨oke
et al., 2012; Kantorovitz et al., 2007), however a more
formal computation of p-values is desirable (Foret
et al., 2009). One of the best similarity measure is N
2
(G¨oke et al., 2012). N
2
aims at overcoming the limita-
tion of exact word counts by taking into account word
neighbourhood counts. N
2
is defined similarly to D
∗
2
except that every word w is replaced with a set n(w) of
words somehow linked to w, e.g. reverse complement
and mismatches.
The major drawback of alignment-free measures
is that they are all tied on the choice of the resolution
k, which crucially influences performances but can-
not be known in advance. In this paper we extend
these alignment-free measures accounting for multi-
ple resolutions. In particular we will show that en-
tropic profiles pave the way to more robust but still
efficient alignment-free methods.
1.2 Entropic Profiles
The concept of Entropic Profiler (EP) was introduced
to analyze DNA sequences (Vinga and Almeida,
2007). The Entropic Profiler is a function of the ge-
nomic location that captures the importance of that
region with respect to the whole genome. This score
is based on the Shannon entropies of the words dis-
tribution. The formal definition of entropic profiles
(Vinga and Almeida, 2007) (Fernandes et al., 2009)
comes from the use of the CGR representation to es-
timate the sequence Renyi entropy on the basis of the
Parzen window density estimation method. The EP
is defined for every location i of the entire sequence S
as:
ˆ
f
L,ϕ
(x
i
) =
1+
1
l
∑
L
k=1
4
k
ϕ
k
· c([i− k + 1, i])
∑
L
k=0
ϕ
k
(4)
where l is the length of the entire sequence, L the res-
olution, i.e. the k-mer length, ϕ is a smoothing param-
eter, and c([i− k+ 1, i]) is the number of occurrences
of (x
i−k+1
. . . x
i
), i.e. the suffix of length k that ends
at position i. EP values are standardized with their
arithmetic mean m
L,ϕ
and standard deviation s
L,ϕ
:
EP
L,ϕ
(x
i
) =
ˆ
f
L,ϕ
(x
i
) − m
L,ϕ
s
L,ϕ
, where (5)
m
L,ϕ
=
1
l
l
∑
i=1
ˆ
f
L,ϕ
(x
i
) (6)
s
L,ϕ
=
v
u
u
t
1
l − 1
l
∑
i=1
ˆ
f
L,ϕ
(x
i
) − m
L,ϕ
2
(7)
Entropic Profilers proved to be useful for the dis-
covery of patterns in genome (Fernandes et al., 2009)
BIOINFORMATICS2015-InternationalConferenceonBioinformaticsModels,MethodsandAlgorithms
172

and they can be computed efficiently in linear time
and space (Comin and Antonello, 2013; Comin and
Antonello, 2014). By definition Entropic Profiles
are based on multiple resolution k-mers counts, thus
they are not tied to a fixed resolution k, as almost all
alignment-free measures. Our intent is to extend this
function for developing new alignment-free measures
for the prediction and classification of enhancers.
2 METHOD: ENTROPIC
PROFILES AS AN
ALIGNMENT-FREE MEASURE
In order to establish a suitable alignment-free mea-
sure, first we need to study the statistical properties of
Entropic Profiles. We can simplify the original For-
mula 4 and consider the main term, that we call sim-
ple entropy SE
S
w
of a word w = (w
1
, ..., w
L
) of length
L :
SE
S
w
=
∑
L
k=1
a
k
c
w,k
∑
L
k=1
a
k
(8)
where c
w,k
is the number of occurrences of the k-
mer suffix s
w,k
and the weights a
k
have been gener-
alized. Without loss of generality the entire sequence
S = (X
1
, X
2
, ..., X
i
, ..., X
l
) can be modeled by a station-
ary Markov chain (S. Robin, 2005) and the probabil-
ity of a word can be denoted by µ(w). The expected
entropy E[SE
w
] can be derived as:
E[SE
S
w
] = E
∑
L
k=1
a
k
c
w,k
∑
L
k=1
a
k
=
∑
L
k=1
a
k
E [c
w,k
]
∑
L
k=1
a
k
where
E[c
w,k
] = (l − k+ 1)µ(s
w,k
)
The variance Var[SE
S
w
] is important to take into
account the dependence between entropies of over-
lapping words:
Var[SE
S
w
] = Var
∑
L
k=1
a
k
c
w,k
∑
L
k=1
a
k
=
=
∑
L
k
′
=1
∑
L
k
′′
=1
a
k
′
a
k
′′
Cov
c
w,k
′
, c
w,k
′′
(
∑
L
k=1
a
k
)
2
where the derivation of the covariance of the counts is
non-trivial. There are two cases which need to be ex-
plored. If k
′
= k
′′
≡ k there is only one suffix of fixed
length, and Cov
c
w,k
′
, c
w,k
′′
= Var[c
w,k
]. Otherwise,
if s
w,k
′
6= s
w,k
′′
, one word is the suffix of the other. For
space limitation here we will consider only the first
case by extending (S. Robin, 2005), but the exact for-
mula for the second case will be provided in the full
version of this paper. In order to derive Var[c
w,k
] we
need to consider three terms which respectively take
into account: 1) self-overlap of the word with itself;
2) partial self-overlap, the suffix of the word with its
prefix or vice-versa; 3) disjoint occurrences. For-
mally:
Var[c
w,k
] = (l − k+ 1)µ(w)(1− µ(w))+
2µ(w)
k−1
∑
d=1
(l − k− d + 1)∗
∗
"
ε
k−d
(w)
k
∏
j=k−d+1
π(w[ j − 1], w[ j]) − µ(w)
#
+2µ
2
(w)
l−2k+1
∑
t=1
(l − 2k − t + 2)
π
t
(w[k], w[1])
µ(w[1])
− 1
where ε
u
(w) is the asymmetric overlap indicator
ε
u
(w) =
(
1 if w[k-u+1...k] = w[1...u]
0 otherwise
,
and t = d − k+ 1 and π
t
(w[k], w[1]) is the probability
that the last letter of w is separated from an occurrence
of w[1] by t − 1 letters.
2.1 New Alignment-free Measures
Derived from Entropic Profiles
Entropies and counts are very much alike, this sug-
gests that the adaptation of the state-of-the-art mea-
sures can be done by replacing the vector of k-mer
counts with the vector of entropies. Consider two
genome sequences A and B and let A
w
and B
w
be the
entropies of word w in A and B. We can redefine clas-
sical alignment-free measures as:
D
EP
2
=
∑
w
A
w
B
w
(9)
EP
2
=
∑
w
(A
w
− E[A
w
])(B
w
− E[B
w
])
p
Var[A
w
]
p
Var[B
w
]
(10)
While the implementation of D
EP
2
is straightforward,
EP
2
instead is based on the statistical properties of en-
tropies. The theory developed in the previous section
is preliminary to the implementation of EP
2
. Note
that, similarly to N
2
, the background model is es-
timated separately for every sequence, this can cut
down computational costs. Moreover Entropic Pro-
files, expectations and variances can be computed in
linear time and space by adapting the implementa-
tion in (Comin and Antonello, 2014). Thus EP
2
can
be computed efficiently as many other alignment-free
measures.
FastAlignment-freeComparisonforRegulatorySequencesusingMultipleResolutionEntropicProfiles
173

3 EXPERIMENTAL RESULTS
This section deals with the testing procedures for the
study of the statistical power of the proposed multi-
resolution sequence similarity measures. The experi-
mental setup is the same of (Kantorovitz et al., 2007)
and (Liu et al., 2011). In each experiment two equal-
length sets of sequences, which are named negative
and positive set, are built. Sequences in the former
are dissimilar while those in the latter similar. The
positive predictive value (PPV) is evaluated in two
steps: 1) similarity scores are computed for each pair
of sequences in the two sets; 2) if similarity scores
are sorted in descending order, the PPV is the per-
centage of pair of sequences from the positive set in
the first half of the chart. The best PPV is 1 and
means a perfect separation between negative and pos-
itive sets while a PPV close to 0.5 implies no statis-
tical power. Performances will depend on the choice
of the background model, the k-mer length and the
standard deviation σ of the Gaussian kernel, which is
centered about k = L, i.e. a
k
= e
−
(L−k)
2
2σ
2
. The choice
of the background model can be so crucial that differ-
ent measures have to be compared without changing
it. For this reason, the results are mainly presented
for the pair of similarity measures EP
2
and N
2
, both
of which compute it on the single sequences.
3.1 Implanted Motifs on Drosophila
Genome
In this simulation study, the sequences in the neg-
ative set are randomly picked from a real genome
while those in the positive set are built by implanting
some motifs in those of the negative set. Thus, as in
(Comin and Verzotto, 2014), we chose the intergenic
sequences of Drosophila genome, (downloadable
from FlyBase http://flybase.org/dmel-all-intergenic-
r5.49.fasta).
Patterns can be artificially implanted via the pat-
tern transfer model (Reinert et al., 2009) or the revised
one (Comin and Verzotto, 2014) with the aim of mim-
icking the exchange of genetic material. While, under
the former model, only strings of the same length, e.g
5, are considered, under the latter, also strings of dif-
ferent length, e.g. 4, 5 and 6 are implanted.
The goal of the first experiment is to assess the in-
fluence of the background model so as to use the best
one in the next tests. It has been performed varying
many parameters such as implanted motifs, insertion
probability, entire sequence length and k-mer length.
Generally, Markov model M1 outperforms Bernoulli
model M0. This is outlined by Figure 1, which shows
Figure 1: Background model M1 outperforms M0.
performances as a function of background model and
k-mer length. In this example, only one motif of
length 6 has been implanted, the insertion probability
has been set to 0.004, the sequences length to 2000
and the standard deviation to 0.5. Before passing to
the next test, it is also worthwhile noting that EP
2
is
better than N
2
if the k-mer length is overestimated,
i.e. k > 6, as a consequence of the multi-resolution
property of entropic profiles. Of course, this effect de-
pends on the standard deviation of the Gaussian ker-
nel. Figure 2 shows the results of the study of the
influence of the standard deviation when implanting
many motifs of average length 5 on a random back-
ground, in this example the sequence length is 500
and the insertion probability 0.01: an higher standard
deviation positively impacts performances when the
k-mer length is overestimated, for high values of the
standard deviation make short motifs to have bigger
weights. To exemplify the idea, if the standard devia-
tion is 1.5, the four biggest weights are 1, 0.80, 0.41
and 0.13 and performances are influenced while if the
standard deviation is 0.1, the Gaussian bell is so thin
that EP
2
is equivalent to N
2
.
Figure 2: PPV as a function of standard deviation and k-mer
length.
Considering our limited knowledge of regulatory
sequences (G¨oke et al., 2012), it is interesting to eval-
uate performances when implanting similar motifs of
different length via the more realistic pattern transfer
model revised, where similar means having common
substrings, e.g. suffixes and prefixes. To this end,
we have performed many experiments varying both k-
mer and sequence length. Figure 3 shows the results
when the sequence length is 4000, the insertion prob-
ability of 0.008 and the standard deviation is 0.6. EP
2
BIOINFORMATICS2015-InternationalConferenceonBioinformaticsModels,MethodsandAlgorithms
174
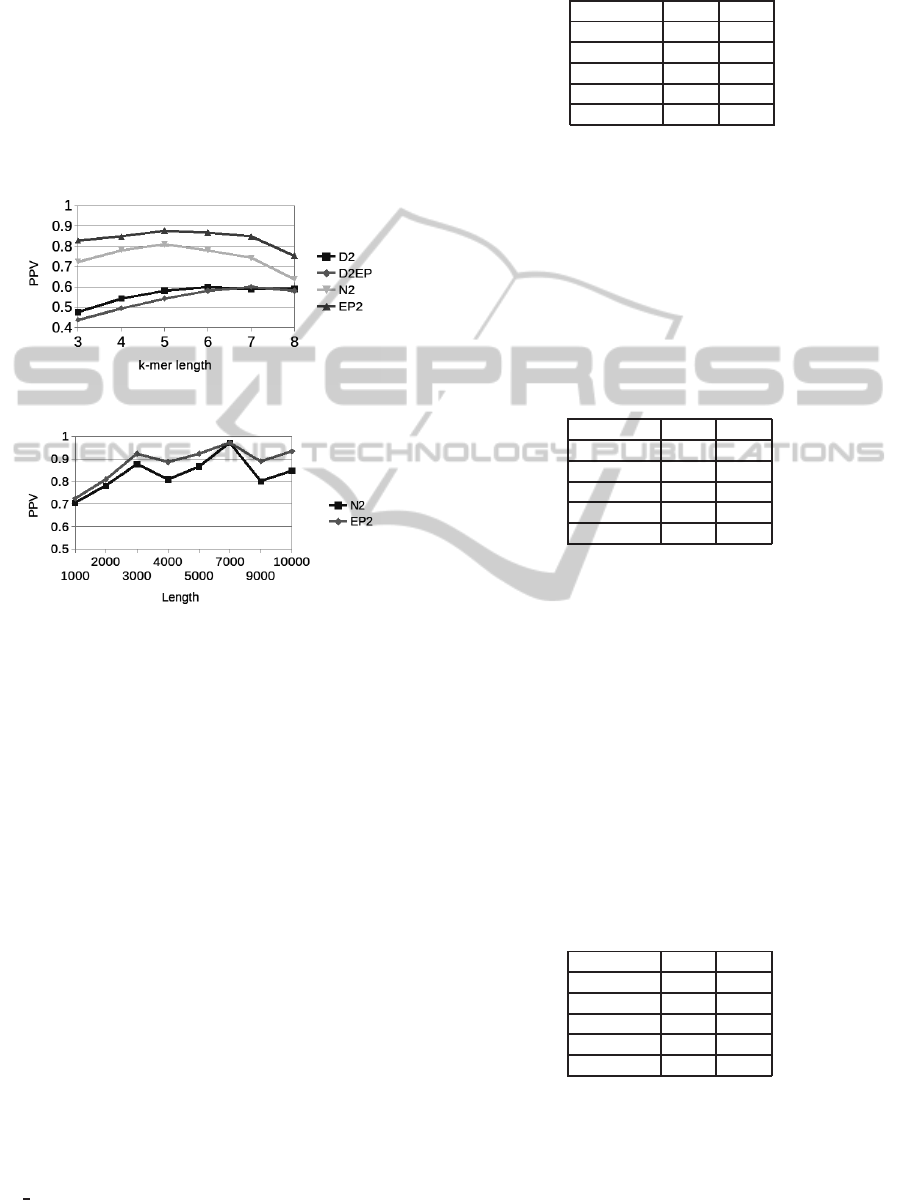
outperforms N
2
and both variants of D
2
, which do not
take into account the statistical properties of counts or
entropies. The pick is at k-mer length 5, which is the
selected value for Figure 4, which shows that these
results hold also varying the entire sequence length.
Performances do not tend to increase with the length
of the sequence even if the number of implanted mo-
tifs also increases because sequences are taken from
different parts of the genome, which might have dif-
ferent statistical properties.
Figure 3: PPV as a function of k-mer length and method.
Figure 4: PPV as a function of entire sequence length and
method.
3.2 Comparison of Mouse Regulatory
Sequences
This series of experiments involves neither artificial
enhancers nor implanted transcription factor binding
sites. The positive set is build from ChIP-seq data of
real enhancers, which have been already identified in
a genome-wide manner using the co-activator protein
p300 by (Visel et al., 2009) (Blow et al., 2010). More
precisely, it consists in sequences of length between
350 and 1000 randomly picked from tissue-specific
enhancers of mouse embryos active in one of the fol-
lowing tissues: forebrain, midbrain, limb or heart. As
a result of their limited size, Bernoulli model behaves
better than higher order Markov models, which lead
to over-fitting by exaggerating minor fluctuations in
the data and poor predictive performances.
In the first experiment, the negative set
contains sequences taken at random from
the mouse genome, which is download-
able from Ensembl (http://www.ensembl.org/,
Mus
musculus.GRCm38.75.dna.toplevel.fa). The
Table 1: Average PPV if background model M0, k-mer
length 4, standard deviation 0.7.
.
Tissue EP
2
N
2
Limb 0.76 0.75
Forebrain 0.74 0.71
Midbrain 0.69 0.69
Heart 0.70 0.69
Average 0.72 0.71
number of sequences per set is 20 and the results are
averaged over 10 runs. Given that no artificial motif
is implanted, which implies that the best motif length
is unknown and function of the tissue, the chosen
standard deviation is 0.7 so short motifs have bigger
weights. The purpose is to take advantage of the
multi-resolution property. The results in Table 1 and
2 show that EP
2
is better than N
2
for different k-mer
lengths.
Table 2: Average PPV if background model M0, k-mer
length 7, standard deviation 0.7.
Tissue EP
2
N
2
Limb 0.72 0.68
Forebrain 0.66 0.62
Midbrain 0.67 0.64
Heart 0.67 0.62
Average 0.68 0.64
The previous test shows that tissue-specific en-
hancers have similar word content. However, the
comparison with random genomic sequences can be
biased by the technology, e.g when it more likely ex-
tracts sequences with high or similar GC-content, as
already described in (Comin and Verzotto, 2014) or
(G¨oke et al., 2012). To avoid this bias, different ChIP-
seq sequences are compared with each other. In other
words, the positive set contains the enhancers active
in one of the tissues while the negative set contains
the enhancers active in all the other. This is a much
more challenging test, that can be used by biologists
to select enhancers that drive a similar expression pat-
tern.
Table 3: Average PPV if background model M1, L = 4,
σ = 0.7.
Tissue EP
2
N
2
Limb 0.64 0.63
Forebrain 0.60 0.55
Midbrain 0.51 0.49
Heart 0.59 0.59
Average 0.59 0.57
The results are averaged over 10 runs, the num-
ber of sequences per set is 35 and the standard de-
viation is 0.7 as before. The results in Table 3 and
4 shows that EP
2
is slightly better than N
2
for dif-
ferent k-mer lengths. Higher performances may be
FastAlignment-freeComparisonforRegulatorySequencesusingMultipleResolutionEntropicProfiles
175

Table 4: Average PPV if background model M1, L = 7,
σ = 0.7.
Tissue EP
2
N
2
Limb 0.55 0.53
Forebrain 0.56 0.53
Midbrain 0.48 0.49
Heart 0.53 0.53
Average 0.53 0.52
obtained by ensuring a maximum of repetitive se-
quence for every negative sample as done in (G¨oke
et al., 2012). Although the PPV values decrease com-
pared to the previous Tables, these later experiments
confirm that similar tissue-specific enhancers have a
higher sequence similarity, and thus they can be de-
tected with alignment-free methods.
4 CONCLUSIONS
In this paper we studied the use of alignment-free
measures to detect functional and/or evolutionary
similarities among regulatory sequences. We intro-
duced a multiple resolution alignment-free method
based on Entropic Profiles that is designed around the
use of variable-length words combined with statisti-
cal properties based on Information Theory. To eval-
uate the performance of several alignment-free meth-
ods, we devised a series of tests on both synthetic
and real data. In almost all simulations our method
EP
2
outperforms all other statistics. Importantly EP
2
is also able to detect similarities between in vivo
identified enhancer sequences, e.g. of mouse. This
will help to better understand the sequence-dependent
code within CRMs, which is responsible for the large
diversity of cell types.
ACKNOWLEDGEMENTS
M. Comin was partially supported by the P.R.I.N.
Project 20122F87B2.
REFERENCES
Altschul, S., Gish, W., Miller, W., Myers, E., and Lipman,
D. (1990). Basic local alignment search tool. J. Mol.
Biol., 215:403–410.
Blaisdell, B. (1986). A measure of the similarity of sets
of sequences not requiring sequence alignment. Proc.
Natl Acad. Sci., 83(5155-5159).
Blow, M. et al. (2010). Chip-seq identification of
weakly conserved heart enhancers. Nature Genetics,
42(9):806–810.
Comin, M. and Antonello, M. (2013). Fast computation of
entropic profiles for the detection of conservation in
genomes. In in BIoinformatics (LNBI), L. N., editor,
Proceedings of Pattern Recognition in Bioinformatics,
volume 7986, pages 277–288.
Comin, M. and Antonello, M. (2014). Fast entropic pro-
filer: An information theoretic approach for the dis-
covery of patterns in genomes. IEEE/ACM Transac-
tions on Computational Biology and Bioinformatics,
11(3):500 – 509.
Comin, M., Leoni, A., and Schimd, M. (2014). Qcluster:
Extending alignment-free measures with quality val-
ues for reads clustering. Algorithms in Bioinformatics,
Lecture Notes in Computer Science, 8701:1–13.
Comin, M. and Schimd, M. (2014). Assembly-free
genome comparison based on next-generation se-
quencing reads and variable length patterns. BMC
Bioinformatics, 15(Suppl 9):S1.
Comin, M. and Verzotto, D. (2010). Classification of pro-
tein sequences by means of irredundant patterns. BMC
bioinformatics, 11(Suppl 1):S16.
Comin, M. and Verzotto, D. (2011). The irredundant
class method for remote homology detection of pro-
tein sequences. Journal of Computational Biology,
18(12):1819–1829.
Comin, M. and Verzotto, D. (2014). Beyond fixed-
resolution alignment-free measures for mammalian
enhancers sequence comparison. IEEE/ACM Trans-
actions on Computational Biology and Bioinformat-
ics, 11(4):628–637.
Fernandes, F., Freitas, A., Almeida, J., and Vinga, S.
(2009). Entropic profiler - detection of conservation
in genomes using information theory. BMC research
notes, 2:72.
Foret, S., Wilson, S., and Burden, C. (2009). Characterising
the d2 statistic: word matches in biological sequences.
Stat. Appl. Genet. Mol. Biol., 8(43).
G¨oke, J., Schulz, M., Lasserre, J., and Vingron, M. (2012).
Estimation of pairwise sequence similarity of mam-
malian enhancers with word neighbourhood counts.
28(5):656–663.
Kantorovitz, M., Robinson, G., and Sinha, S. (2007). A sta-
tistical method for alignment-free comparison of reg-
ulatory sequences. 23(13):249–255.
Liu, X., Wan, L., Reinert, G., Waterman, M., Sun, F., and
Li, J. (2011). New powerful statistics for alignment-
free sequence comparison under a pattern transfer
model. 1:106–116.
Reinert, G., Chew, D., Sun, F., and Waterman, M. S.
(2009). Alignment-free sequence comparison (i):
statistics and power. Journal of Computational Biol-
ogy, 16(12):1615–1634.
S. Robin, e. a. (2005). DNA, Words and Models: Statistics
of Exceptional Words. Cambridge University Press.
Shlyueva, D., Stampfel, G., and Stark, A. (2014). Tran-
scriptional enhancers: from properties to genome-
wide predictions. Nature Reviews Genetics, 15:272
– 286.
Smith, T. and Waterman, M. (1981). Comparison of biose-
quences. Adv. Appl. Math., 2:482–489.
BIOINFORMATICS2015-InternationalConferenceonBioinformaticsModels,MethodsandAlgorithms
176

Song, K., Ren, J., Reinert, G., Deng, M., Waterman,
M. S., and Sun, F. (2014). New developments
of alignment-free sequence comparison: measures,
statistics and next-generation sequencing. Brief Bioin-
form, 15(3):343–353.
Vinga, S. and Almeida, J. (2003). Alignment-free sequence
comparison a review. Bioinformatics, 19(4):513–523.
Vinga, S. and Almeida, J. S. (2007). Local renyi en-
tropic profiles of dna sequences. BMC Bioinformatics,
8:393.
Visel, A. et al. (2009). Chip-seq accurately pre-
dicts tissue-specific activity of enhancers. Nature,
457(7231):854–858.
FastAlignment-freeComparisonforRegulatorySequencesusingMultipleResolutionEntropicProfiles
177
