
Patterns of Codon Usage in Plastidial Genomes of Ancient Plants
Provide Insights into Evolution
Manju Yadav
1
, Suresh Babu
2
and Gitanjali Yadav
1
1
National Institute of Plant Genome Research, Aruna Asaf Ali Marg, New Delhi, India
2
School of Human Ecology, Ambedkar University of Delhi, New Delhi, India
Keywords: Codon Bias, Molecular Evolution, Biostatistics, Organellar Genomics.
Abstract: Basal angiosperms are the first flowering plants that diverged from ancestral angiosperms, while magnoliids
represent the oldest known angiosperms and are considered to retain the characteristics of more primitive
angiosperms. Availability of the plastidial genomes from several members of both these classes of plants
provides an opportunity to identify and understand large-scale genomic patterns in organelles of early
angiosperms. In this work, chloroplast genomes from nine AT-rich basal angiosperm and magnoliid species
were analyzed to unearth patterns, if any, in terms of codon bias and to identify factors responsible for the
detected patterns. We were able to distinguish nine optimal codons in basal angiosperm chloroplasts and 18
in case of magnoliids. Our findings suggest mutational bias as the most predominant factor shaping codon
usage patterns among the genomes examined, while gene expression, hydrophobicity and aromaticity, were
found to have a limited but important effect on pattern determination.
1 INTRODUCTION
Chloroplasts, initially originated by the process of
endosymbiosis from cyanobacteria about 1-1.5
billion years ago, are the most important cellular
organelles of autotrophs. On account of their small
size, high copy number, conservation and extensive
characterization at the molecular level, a large
number of completely sequenced plastid genomes
are now publicly available.
The angiosperms, or flowering plants, are one of
the major groups of extant seed plants and arguably
the most diverse major extant plant group on the
planet, with at least 260,000 living species classified
in 453 families. Basal angiosperms represent the
first flowering plants that branched off from
ancestral angiosperms at successive occasions before
the appearance of the "true" dicots Eudicots, and
comprise of distinct evolutionary groups, of which
the first three to diverge were Amborellales,
Nymphaeales and Austrobaileyales (Soltis & Soltis
2004). Magnoliids, on the other hand, are the oldest
known angiosperms, represented by a heterogenous
group that are neither eudicotyledons nor
monocotyledons, and are considered to retain the
characteristics of more primitive angiosperms.
Economically important products derived from
magnoliids include edible fruits, spices such as black
and white pepper Piper nigrum, cinnamon
Cinnamomum verum, and camphor Cinnamomum
camphora (Soltis et al., 2005). The magnoliid clade
contains most of those lineages that were typically
referred to as "primitive angiosperms" in earlier
classification schemes (Cronquist, 1988).
This work was undertaken with the aim of
conducting a genome-wide survey of codon usage
patterns across the available chloroplast genomes of
Basal Angiosperms and Magnoliids. The term
‘codon usage bias’ describes the unbalanced usage
of synonymous codons during translation of a given
genome. Codon usage can vary between species and
also between different genomic regions of the same
species, so there is much fluctuation observed in
genes and genomes. Several factors support this
phenomenon, such as genome composition bias
(Bernardi and Berbardi, 1986), natural translation
selection (Ikemura, 1985), hydrophobhicity and
aromaticity.
Previous codon usage studies demonstrate that
codon usage bias is a complex phenomenon, which
involves various biological factors such as gene
expression level, gene length, gene translation
initiation signal, protein amino acid composition,
protein structure, tRNA abundance, mutation
144
Yadav M., Babu S. and Yadav G..
Patterns of Codon Usage in Plastidial Genomes of Ancient Plants Provide Insights into Evolution.
DOI: 10.5220/0005246301440149
In Proceedings of the International Conference on Bioinformatics Models, Methods and Algorithms (BIOINFORMATICS-2015), pages 144-149
ISBN: 978-989-758-070-3
Copyright
c
2015 SCITEPRESS (Science and Technology Publications, Lda.)

frequency and patterns and GC composition (Sharp
et al., 1993). Ikemura and colleagues found that
some specific codons of highly expressed genes are
best recognized by the most abundant tRNA
isoacceptors (Ikemura, 1985). It is believed that
codon usage pattern in chloroplast genomes is
similar to that of E. coli as the translational
machinery in both cases has its own genomic
environment that resembles prokaryotes.
Composition bias is the predominant factor
responsible for codon bias in chloroplast genome of
plants. High A+T content, which matches the
composition bias of noncoding regions, is rich in
degenerate positions (Morton, 1996), but this fact is
not accepted in case of psbA gene, which has high C
content at the third position of specific synonymous
groups. Selection is thought to act strongly on the
codon usage of psbA such that it has a noticeably
unique codon usage pattern, and at a very weak
intensity on the codon usage of some other highly
expressed genes of the plant chloroplast genomes
(Morton, 1996).
The main purpose of this study is to gain an
understanding of the selection factors that are
responsible of codon usage bias by focusing on the
data from nine chloroplast genomes belonging to
magnoliids and basal angiosperms. We have tried to
address questions regarding the change in codon
usage pattern during evolution in chloroplast
genomes, an event that has not previously been
explored in depth. We also attempt to compare our
findings with published literature although earlier
studies have all been restricted to individual or very
few species in plants.
2 MATERIALS & METHODS
2.1 Dataset
Complete chloroplast genomes and collection of
coding sequences of nine species of plants
representing two major taxa, namely Basal
Angiosperms and Mangnoliids were obtained from
GenBank, NCBI:http://www.ncbi.nlm.nih.gov.
The nine genomes used as dataset for this study
comprised of three basal angiosperms, one each
from Amborellales, Nymphaeales and
Austrobaileyales, namely Amborella trichopoda,
Nymphaea alba and Nuphar advena respectively.
The six remaining chloroplast genomes
encompassed the magnoliids, namely Calycanthus
floridus var. glaucus, Liriodendron tulipifera,
Drimys granadensis, Piper cenocladum,
Chloranthus spicatus and Illicium oligandrum.
Details of these nine genomes are provided in
Table1.
Only those sequences were included which
comprised appropriate start and stop codons and
were of full length. To minimize stochastic
variation, a threshold of 100 codons was defined,
since there is a negative correlation between codon
usage bias and gene length.
Table 1: Summary of Organisms.
Species code
Accession No.
# protein
coding
genes
# Filtered
genes
used
GC %
BASAL ANGIOSPERMS
A.tr NC_005086 84 54 38
N.al NC_006050 85 58 39
N.ad NC_008788 85 55 39
MAGNOLIIDS
C.f.g NC_004993 86 55 39
L.tu NC_008326 84 53 39
D.gr NC_008456 85 55 38
P.ce NC_008457 85 53 38
C.sp NC_009598 86 56 38
I.ol: NC_009600 83 56 39
2.2 Codon Usage Indices & Parameters
A number of codon usage indices were calculated
for this study using the program CodonW 1.4.4
http://codonw.sourceforge.net/. All statistical
analysis was performed using SPSS version 16.0.
The effective number of codons Nc, independent
of gene length is a simple measure of bias in codon
usage (Wright, 1990). Equation for the calculation
of Enc plot is: ENc = 2 + S + 29/S2 + 1-S2 where S
is the frequency of G+C i.e. GC3s. A plot of Enc
against GC3s NC-plot was effectively used to detect
the codon usage variation among genes, for
example, if GC3s is zero, then only codons ending in
A and T will be used, thus restricting the number of
codons used to 20 out of the 61 sense codons.
Wright 1990 argued that if a particular gene is
subject to G+C compositional constraint, it would lie
on or just below the expected curve, as against a
gene subject to selection for transitionally optimal
codons, that would lie considerably below the
expected curve.
Relative synonymous codon usage RSCU value
for a codon is simply the observed frequency of that
codon divided by the frequency expected under the
assumption of uniform usage H0* of the
synonymous codons for an amino acid (Sharp,
1986). RSCU values close to 1.0 indicate a lack of
codon bias. RSCU values are largely independent of
PatternsofCodonUsageinPlastidialGenomesofAncientPlantsProvideInsightsintoEvolution
145

amino acid composition and are particularly useful
in comparing codon usage among genes, or sets of
genes that differ in their size and amino acid
composition. The formula for RCSU is given by:
RSCU
ij
X
ij
1
n
i
X
ij
j1
n
i
where X
ij
is the number of occurrences of the j
th
codon for the i
th
amino acid, and n
i
is the number
from one of six of alternative codons for the i
th
amino acid. Relative adaptive-ness of a codon, w
ij
, is
the frequency of use of that codon compared to the
frequency of the optimal codon for that amino acid,
and it is given by:
W
ij
RSCU
ij
RSCU
i max
X
ij
X
i max
where RSCU
imax
and X
imax
are the RSCU and X
values for that codon which is used most frequently
for the i
th
amino acid.
Codon Adaptation Index CAI measures the
relative adaptation of a gene of the codon usage of
highly expressed genes. CAI uses a reference set of
highly expressed genes from a species to assess the
relative merits of codon and identifies the role of
selective pressure in modeling the patterns of codon
usage (Sharp and Li, 1987). To calculate CAI, the
first step is to construct a reference table of relative
synonymous codon usage RSCU values from very
highly expressed genes of the organism in question.
The CAI values are calculated in relation to the
psbA gene of the same genome.
The psbA gene demonstrates atypical codon
usage and its codon bias is a remnant of the ancestral
bias degrading toward the compositional bias
(Morton and Levin, 1997). A CAI values close to
1.0 reflects strong bias in codon usage and
potentially high-expression level of the considered
gene (Sharp and Li, 1987).
The most commonly used characteristic is the
pattern of codon usage itself, defined in terms of
optimal codons. An optimal codon is any codon
whose frequency of usage is significantly higher
than its synonymous codons in putatively highly
expressed genes. Significance is estimated using a
two-way chi-squared contingency test, with a cut-off
at p<0.01. Codon usage was composed using chi-
square contingency test of the groups, and codons
whose frequency of usage were significantly higher
p-value < 0.01 in highly expressed genes than in
genes with low level of expression would be defined
as the optimal codons.
GC content is calculated as the fraction of
nucleotides in a sequence, that are guanine or
cytosine. The index GC3s is the frequency of G or C
nucleotides present at the third position of
synonymous codons i.e. excluding Met, Trp and
termination codons.
Hydrophobicity is measured in terms of gravy
score, while aromaticity denotes the frequency of
aromatic amino acids Phe, Tyr and Trp in the
translated sequences (Kyte and Doolittle, 1982).
To normalize and identify intra-genomic
variation with differing amino acid compositions,
relative synonymous codon usage RSCU was
analyzed for correspondence analysis COA for the
59 informative codons excluding Met, Trp, and the
three stop codons (Greenacre, 1984). This analysis
partitions the variation along 59 orthogonal axes,
with 41 degrees of freedom. The first axis is the one
that captures most of the variation in the codon
usage, with each subsequent axis explains a
diminishing amount of the variance. The
correspondence analysis also reflects the
corresponding distribution of synonymous codons.
RSCU values are close to 1.0 when all synonymous
codons are used equally without any bias. In
subsequent part of this work, the terms axis 1 RSCU
and axis 2 RSCU will be used to represent first-and
second-major axis of COA.
3 RESULTS
3.1 Detection of Codon Usage Patterns
As described in methods, the pattern of synonymous
codons usage across the codons in each genome was
investigated by the Nc-plot between ENc value and
GC3s value. The values range from 20 extremely
biased to 61 no bias (Wright, 1990), and the
respective plots are shown in Figure 1 for the basal
angiosperms, and Figure 2 for magnoliids. Nc-plots
of basal angiosperm chloroplast genomes follow a
trajectory path, i.e majority of points are on and just
below the Nc-plot.
Table 2 lists the Nc and GC3 values for all
species investigated and it can be seen that basal
angiosperms have very low GC3s values and their
Nc values range from about 38 to 61, the lowest
being 38.39 GC3s is 0.232 in case of the rps18 gene
of Amborella trichopoda.
Overall, the majority of genes follow a parabolic
line of trajectory indicating G+C mutational bias as
the predominant factor for variation in codon usage,
although some genes lie well below the expected
curve, hinting at additional factors responsible for
codon bias in basal angiosperms.
BIOINFORMATICS2015-InternationalConferenceonBioinformaticsModels,MethodsandAlgorithms
146
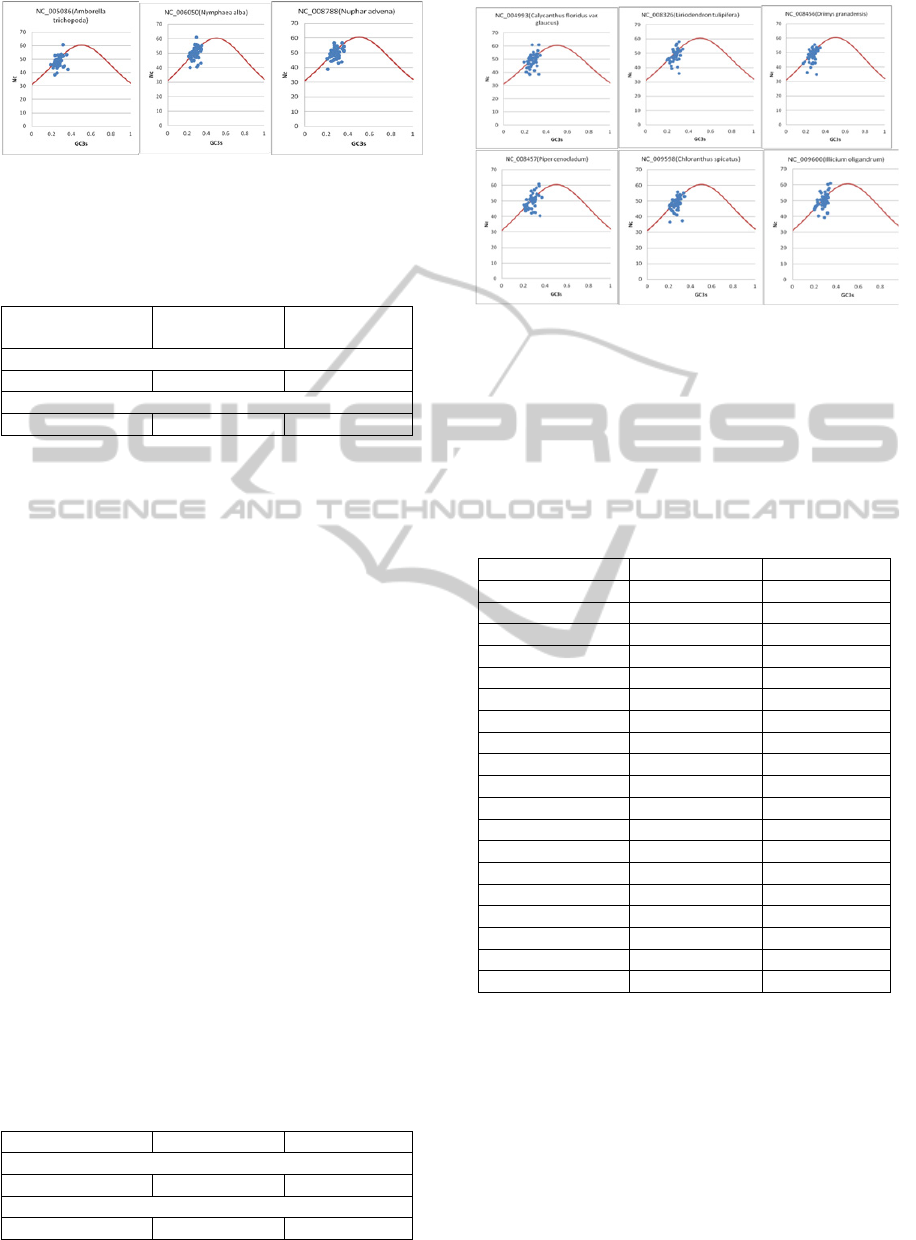
Figure 1: Nc-plots (Nc values vs GC3s) for the three basal
Angiosperms. Nc was plotted against GC content at the
third codon position. The expected ENc from GC3s are
shown as a solid line.
Table 2: Genes with highest bias per taxon (by Nc-Plots).
Species code
Accession No.
Gene NC value
(GC3s)
BASAL ANGIOSPERMS
A.tr NC_005086 Rps18 38.39 (0.232)
MAGNOLIIDS
D.gr NC_008456 Rps14 34.86 (0.309)
Although the mean Nc values of basal
angiosperms and magnoliids are close to each other
as shown in Table 3, and both sets of Nc plots
display a parabolic trend, it can be seen from Figure
2 that the magnoliid Nc plots exhibit a wider
scattering of points as compared to basal
angiosperms, and there are more magnoliid genes
lying well below the expected curve.
As can be seen from Table 2, least Nc-value is
displayed by Drimys granadensis i.e. 34.86 GC3s is
0.309 on rps14 gene. These observations suggest
that in case of magnoliids, G+C mutational bias is
the predominant factor for codon usage bias but
translational selection may also be an important
factor.
3.2 Optimal Codons
Table 4 lists the results from optimal codon
identification and the data shows nine significantly
preferred optimal codons for basal angiosperms p<
0.01, while in case of magnoliids, 18 codons were
identified as being used more frequently p< 0.05
Table 4. These optimal codons are optimal for genes
at higher expression level, as estimated from CAI
analysis. Only four optimal codons were found to be
common between the two taxa.
Table 3: Means of Nc value in each taxon.
No. of Genomes # Genes Mean NC
BASAL ANGIOSPERMS
3 367 7.5394
MAGNOLIIDS
6 367 7.2954
Figure 2: Nc-plots (Nc values vs GC3s) for six magnoliids
used in this study. Parameters same as in Figure 1.
As shown in Table 5, plants from both taxa show a
higher occurrence of A/U at the third position of
their optimal codons. This result is consistent with
the AT richness of the third-codon position in
chloroplast genes.
Table 4: Occurrence of Optimal Codons (out of 64).
Codon Basal Ang Magnolid
AGU (Ser) 1 1
GGA (Gly) - 2
GCC (Ala) 1 1
GAA (Glu) - 1
GAC (Asp) - 1
GAU (Asp) - 1
ACA (Thr) 1 -
ACU (Thr) - 1
AUA (Ile) - 1
AUU (Ile) - 1
CGA (Arg) 1 -
CGU (Arg) 1 1
CAA (Gln) - 1
CAU (His) 1 1
CCA (pro) 2 -
UUA (Leu) - 3
UUG (Leu) - 1
UGU (Cys) - 1
UAC (Tyr) 1 -
3.3 Correspondence and Correlation
Analysis
Previous studies have shown a significant variation
in the codon usage among genes from different
species (Ikemura, 1985; Sharp et al., 1988). Thus, in
order to understand the variations and trends in
codon usage among genes in basal angiosperms and
magnoliids, a series of orthogonal axes were
generated by performing COA of RSCU.
PatternsofCodonUsageinPlastidialGenomesofAncientPlantsProvideInsightsintoEvolution
147
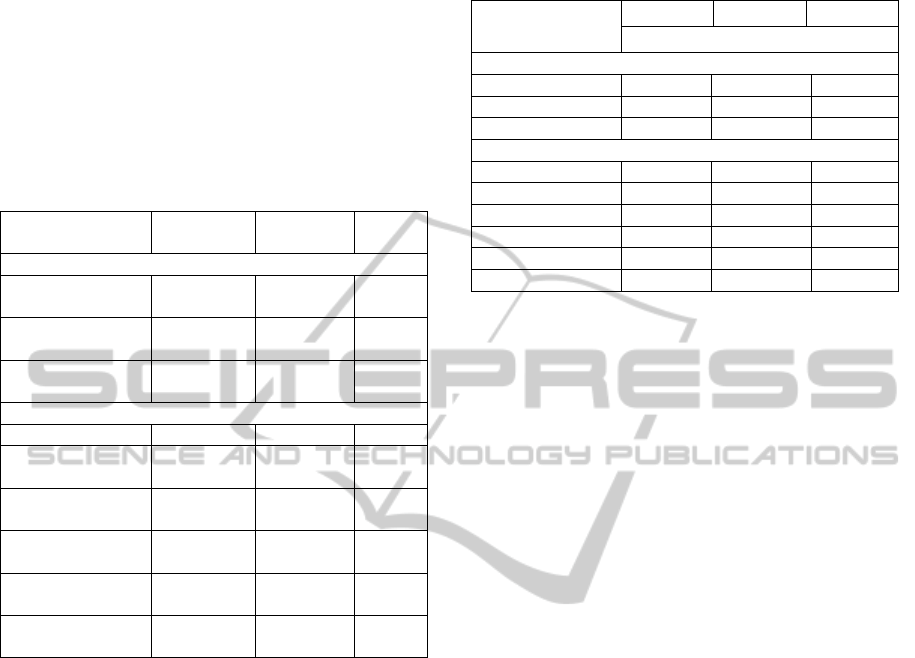
Coordinates of each gene on the four axes reflected
the variation in codon usage. Axis 1 COA/RSCU
possesses the maximum variation that diminished
with axes 2, 3 and 4 respectively.
Spearman's rank correlation analyses were
performed among different indices of codon usage
and amino acid composition such as CAI, GC
content, Nc, GC3s, hydrophobicity, aromaticity and
data from the first four axes are presented in Table 6.
Table 5: Top Ranked Optimal Codons by Species.
Species code
Accession No.
BASAL ANGIOSPERMS
A.tr NC_005086 CCA (Pro) CCA(Pro) CCA
(Pro)
N.al NC_006050 UAC (Tyr) UAC
(Tyr)
UAC
(Tyr)
N.ad NC_008788 CAU (His) CAU
(His)
CAU
(His)
MAGNOLIIDS
C.f.g NC_004993 UUA Leu)
L.tu NC_008326 ACU (Thr) ACU
(Thr)
ACU
(Thr)
D.gr NC_008456 UUA(Leu) UUA
(Leu)
UUA
(Leu)
P.ce NC_008457 UGU(Cys) UGU
(Cys)
UGU
(Cys)
C.sp NC_009598 CGU (Arg) CGU
(Arg)
CGU
(Arg)
I.ol: NC_009600 UUG(Leu) UUG
(Leu)
UUG
(Leu)
As can be seen from this table, basal angiosperms
possess more correlation significant values with Nc
than magnoliids. Genes in all three basal
angiosperms are correlated with Nc with first,
second and third axes. Distribution of genes in all
magnoliids is correlated with first three axes, except
in case of I. oligandrum. In basal angiosperms,
Nyphea alba at axis 4 is correlated with CAI with
value r = -.389, p – value < 0.01, and Nuphar
advena is correlated at axis 4 with value r = .477, p –
value 0.01. Magnoliids also showed a significant
correlation with CAI at axes 3 and 4.
The distribution of genes on third axis is
correlated with CAI in all magnoliids all r < -.282,
p-value < 0.05; all r < -.251, p-value < 0.01. GC is
significantly correlated with different axes in both
taxa except for Piper cenocladum of magnoliids.
Hydrophobicity showed significant correlation in
case of four genomes out of nine.
Table 6: Correlation analysis between codon usage and
amino acid usage indices in plastidial genomes.
Species code
Accession No.
Axis1 Axis 2 Axis3
CAI Values
BASAL ANGIOSPERMS
A.tr NC_005086 0.041 0.082 0.130
N.al NC_006050 -0.089 0.114 0.176
N.ad NC_008788 0.009 0.073 0.088
MAGNOLIIDS
C.f.g NC_004993 0.233 0.150 0.148
L.tu NC_008326 -0.011 -0.093 -0.350*
D.gr NC_008456 -0.054 0.211 -0.537**
P.ce NC_008457 -0.200 0.094 -0.351**
C.sp NC_009598 -0.065* 0.276* -0.318*
I.ol: NC_009600 -0.090 0.232 0.285*
*Represents significance at P < 0.05; **at P < 0.01
4 CONCLUSIONS
Our results strongly suggest mutational bias, gene
expression, compositional constraint and
hydrophobicity as the selective forces in shaping the
variation in the codon usage among genes of these
organisms. We analyzed the putative optimal codons
and hypothesize that frequencies of preferred codons
in genes seem to be correlated with the gene
expression, majority of which end with U and may
be useful in the detection of gene expression of those
genes where this is unexplored.
According to our results codon bias is
significantly correlated with gene expression. Our
data provide evidence that natural selection can also
play an important role in shaping the codon usage in
chloroplast genomes. Correlation results strongly
support the hypothesis that besides mutation bias,
there are some other factors that direct the change in
the codon usage frequency in chloroplast genomes.
Among other factors, aromaticity and
hydrophobicity have played an important role in
shaping codon usage in many chloroplast genomes.
This study has provided a basic understanding of the
mechanisms for codon usage bias, which could be
useful in further studies of their molecular evolution,
gene transfer and heterologous expression of these
chloroplast genomes from basal angiosperms and
magnoliids.
AUTHOR CONTRIBUTIONS
MY and GY developed the analysis pipeline. SB
assisted with the statistics. All authors coordinated
BIOINFORMATICS2015-InternationalConferenceonBioinformaticsModels,MethodsandAlgorithms
148

to draft, read and approve the final manuscript.
ACKNOWLEDGEMENTS
This work was funded by the SERB project of Dept.
of Science & Technology (DST) Govt. of India
(Grant No. BT/PR12919/AGR/02/676/2009) and
Young Scientist Grant by Indian Natl Science
Academy (INSA) to GY. MM was recipient of the
senior research fellowship (SRF) of the DBT, Govt.
of India during the period of work. Facilities
provided under the Biotechnology Information
System Network (BTISNET) grant of the NIPGR
Sub-Distributed Information center (Sub-DIC) of the
DBT, Govt. of India, are gratefully acknowledged
(Grant No. BT/BI/04/069/2006).
REFERENCES
Bernardi G, Berbardi G 1986 Compositional constraints
and genome evolution. J Mol Evol 24:1-11.
Cronquist, A. 1988. The evolution and classification of
flowering plants, 2nd ed. New York Botanical Garden,
Bronx, New York, USA.
Greenacre, M. J. 1984. Theory and application of
correspondence analysis p. 223. London: Academic
Press.
Ikemura, T. 1985. Codon usage and tRNA content in
unicellular and multicellular organisms. Molecular
Biology and Evolution, 2, 13–34.
Kyte, J., & Doolittle, R. 1982. A simple method for
displaying the hydropathic character of a protein.
Journal of Molecular Evolution, 157, 105–132.
Morton B.R. 1996. Selection on the codon bias of
Chlamydomonas reinhardtii chloroplast genes and the
plant psbA gene. J Mol Evol 43:28-31.
Morton BR, Levin JA 1997 The atypical codon usage of
the plant psbA gene may be the remnant of an
ancestral bias. Proc. Natl. Acad. Sci. USA 94, 11434–
11438.
Pamela S. Soltis and Douglas E. Soltis 2004. "The origin
and diversification of angiosperms". America Journal
of Botany 91 10: 1614–1626.
doi:10.3732/ajb.91.10.1614.
Sharp PM, Stenico M, Peden JF et al 1993 Codon usage:
mutational bias, translational selection, or both?
Biochem Soc Trans 214:835–841.
Sharp, P. 1986. Molecular evolution of bacteriophages –
evidence of selection against the recognition sites of
host restriction enzymes. Molecular Biology and
Evolution, 3, 75–83.
Sharp, P. M., & Li, W-H. 1987a. The codon adaptation
index—a measure of directional synonymous codon
usage bias, and its potential applications. Nucleic
Acids Research, 15, 1281–1295.
Sharp, P. M., Cowe, E., Higgins, D. G., Shields, D. C.,
Wolfe, K. H., & Wright, F. 1988. Codon usage in
Escherichia coli, Bacillus subtilis, Saccharomyces
cerevisiae, Schizosaccharomyces pombe, Drosophila
melanogaster and Homo sapiens; a review of the
considerable within-species diversity. Nucleic Acids
Research, 16, 8207–8711.
Soltis, D. E., P. S. Soltis, M. W. Chase, and P. K. Endress.
2005. Angiosperm phylogeny and evolution.
Sunderland: Sinauer Associates.
Wright, F. 1990. The ‘effective number of codons’ used in
a gene. Gene, 87, 23–29.
PatternsofCodonUsageinPlastidialGenomesofAncientPlantsProvideInsightsintoEvolution
149
