
Object Attention Patches for Text Detection and Recognition
in Scene Images using SIFT
Bowornrat Sriman and Lambert Schomaker
Artificial Intelligence, University of Groningen, Groningen, The Netherlands
Keywords:
K-means Clustering, Model-based Image, OCR, Text Detection, SIFT and Scene Image.
Abstract:
Natural urban scene images contain many problems for character recognition such as luminance noise, varying
font styles or cluttered backgrounds. Detecting and recognizing text in a natural scene is a difficult problem.
Several techniques have been proposed to overcome these problems. These are, however, usually based on a
bottom-up scheme, which provides a lot of false positives, false negatives and intensive computation. There-
fore, an alternative, efficient, character-based expectancy-driven method is needed. This paper presents a
modeling approach that is usable for expectancy-driven techniques based on the well-known SIFT algorithm.
The produced models (Object Attention Patches) are evaluated in terms of their individual provisory character
recognition performance. Subsequently, the trained patch models are used in preliminary experiments on text
detection in scene images. The results show that our proposed model-based approach can be applied for a
coherent SIFT-based text detection and recognition process.
1 INTRODUCTION
Optical Character Recognition (OCR) is an important
application of computer vision and is widely applied
for a variety of alternative purposes such as the recog-
nition of street signs or buildings in natural scenes. To
recognize a text from photographs, the characters first
need to be identified, but the scene images contain
many obstacles that affect the character identification
performance. Visual recognition problems, such as
luminance noise, varying 2D and 3D font styles or a
cluttered background, cause difficulties in the OCR
process as shown in Figure 1. In contrast, scanned
documents usually include flat, machine-printed char-
acters, which are in ordinary font styles, have stable
lighting, and are clear against a plain background. For
these reasons, the OCR of photographic scene images
is still a challenge.
Many techniques to eliminate the mentioned OCR
Figure 1: Sample pictures of visual recognition problems in
scene images for text recognition.
obstacles in scene images have been studied. For ex-
ample, detecting of and extracting objects from a va-
riety of background colors might be partly solved by
color-based component analysis (Park et al., 2007;
Li et al., 2001). The difficulty of text detection in a
complex background can be overcome by using the
Stroke-Width Transform (Epshtein et al., 2010) and
Stroke Gabor Words (Yi and Tian, 2011) techniques.
In addition, contrast and luminance noise are uncon-
trollable factors in natural images. Several studies
(Fan et al., 2001; Zhang and et al., 2009; Smolka and
et al., 2002) have been conducted to conquer these
problems regarding light.
However, the aforementioned methods act
bottom-up and are normally based on salience
(edges) or the stroke-width of the objects. In a series
of pilot experiments we found that the results present
a lot of false positives or non-specific detection of
text (Figure 2), and the recall rates are also not very
good. Hence, a more powerful method is needed.
Looking at human vision, expectancy plays a cen-
tral role in detecting objects in a visual scene (Chen
et al., 2004; Koo and Kim, 2013). For example, a per-
son looking for coins on the street will make use of
a different expectancy model than when looking for
text in street signs. An intelligent vision system re-
quires internal models for the object to be detected
(where the object is) and for the class of objects to be
304
Sriman B. and Schomaker L..
Object Attention Patches for Text Detection and Recognition in Scene Images using SIFT.
DOI: 10.5220/0005218603040311
In Proceedings of the International Conference on Pattern Recognition Applications and Methods (ICPRAM-2015), pages 304-311
ISBN: 978-989-758-076-5
Copyright
c
2015 SCITEPRESS (Science and Technology Publications, Lda.)

Figure 2: Example of the Stroke-Width Transform result on
Thai and English scripts.
recognized (what the object is).
A simple modeling approach would consist of a
full convolution of character model shapes along an
image. Such an approach is prohibitive: it would re-
quire to scan for all the characters in an alphabet, us-
ing a number of template sizes and of orientation vari-
ants. All of these processes would make the compu-
tation too expensive. Therefore, a fast invariant text
detector would be attractive. It should be expectancy-
driven, using a model of text, i.e., the degree of ‘textu-
ality’ of a region of interest. A well-known technique
for detecting an object in a scene is the Scale Invariant
Feature Transform (SIFT) (Lowe, 2004). It is com-
putationally acceptable, invariant and more advanced
than a simple text-salience heuristic. Therefore, we
address the question of whether SIFT is usable for
both text detection and character recognition.
This paper presents the character models’ con-
struction from scene images and performance indica-
tors for detection purposes, which can be used further
to recognize a text both in English and non-English
scripts. In section 2, we provide the backgrounds of
the Object Attention Patch and the SIFT technique.
Section 3 describe proposed algorithm in detail. Next,
the performance of our model are represented, and
then the applying models to character patching in a
scene is demonstrated. Finally, we draw conclusions
and discussions in the last section.
2 BACKGROUND
2.1 Model for Object Attention Patches
for Text Detection
Text detection based on salience heuristics often fo-
cuses on the intensity, color and contrast of objects
appearing in an image. The salient pixels are detected
and extracted from the image background as a set of
candidate regions. Saliency detection is a coarse tex-
tuality estimator at micro scale, yielding the proba-
bility for each pixel that it belongs to the salient ob-
ject (Borji et al., 2012), while the information such
as luminance and color space (e.g., RGB) is of lim-
ited dimensionality. In the text-detection process, the
set of candidate regions is merged with its neighbors
and then processed in a voting algorithm in order to
eliminate non-text regions before presenting the final
outputs of the text regions. Even then, there may still
exist a lot of false positives and false negatives (cf.
Figure 2).
We propose to increase the information used for
the ‘textuality’ decision by using a larger region, at
the meso scale, i.e., the size of characters. In this way,
the expectancy of a character is modeled by atten-
tional patches. The type of character modeling pro-
posed here serves two purposes: detection and recog-
nition. The requirements are that the process should
be reasonably fast and able to handle variable sizes
and fonts. This can be realized by exploiting the de-
tection of small structural features, such as is done in
SIFT-like methods, in combination with modeling the
expected 2D layout of these key points in characters.
For each character in an alphabet, training sam-
ples are collected and computed SIFT key points. The
key points are usually highly variable. In order to re-
duce the amount of modeling information, clustering
is performed on the 128-dimensional key points (KP)
SIFT descriptors, per character, yielding a code book
of prototypical key points (PKP). The center of grav-
ity (c.o.g., x, y) over all the key points for a charac-
ter is computed, as well as the densities for PKPs in
the character patch. This yields the expected relative
(x
r
, y
r
) position of a PKP for this character, dubbed
the point of interest (POI). The spatial relation of the
PKP positions allows the expected PKPs j at relative
positions and angles to be modeled, given a detected
PKP i and an expected character c. Figure 3 gives
a graphical description of the model. The evidence-
collection process starts with the keypoint extraction,
entering a scoring process for both ‘textuality’ and the
likelihood of a character presence at the same time.
In order to evaluate this approach, we will start
by considering the model as a provisory-classifier of
characters. The recognition performance can be con-
sidered as a good indicator of its applicability for text
detection. As a final note, the use of SIFT itself is
not essential to the modeling approach. Other algo-
rithms for detecting small structural features may also
apply such as Affine SIFT (ASIFT) (Morel and Yu,
2009), SURF (Bay et al., 2008), and local binary pat-
tern (LBP) (Ojala et al., 2002).
ObjectAttentionPatchesforTextDetectionandRecognitioninSceneImagesusingSIFT
305
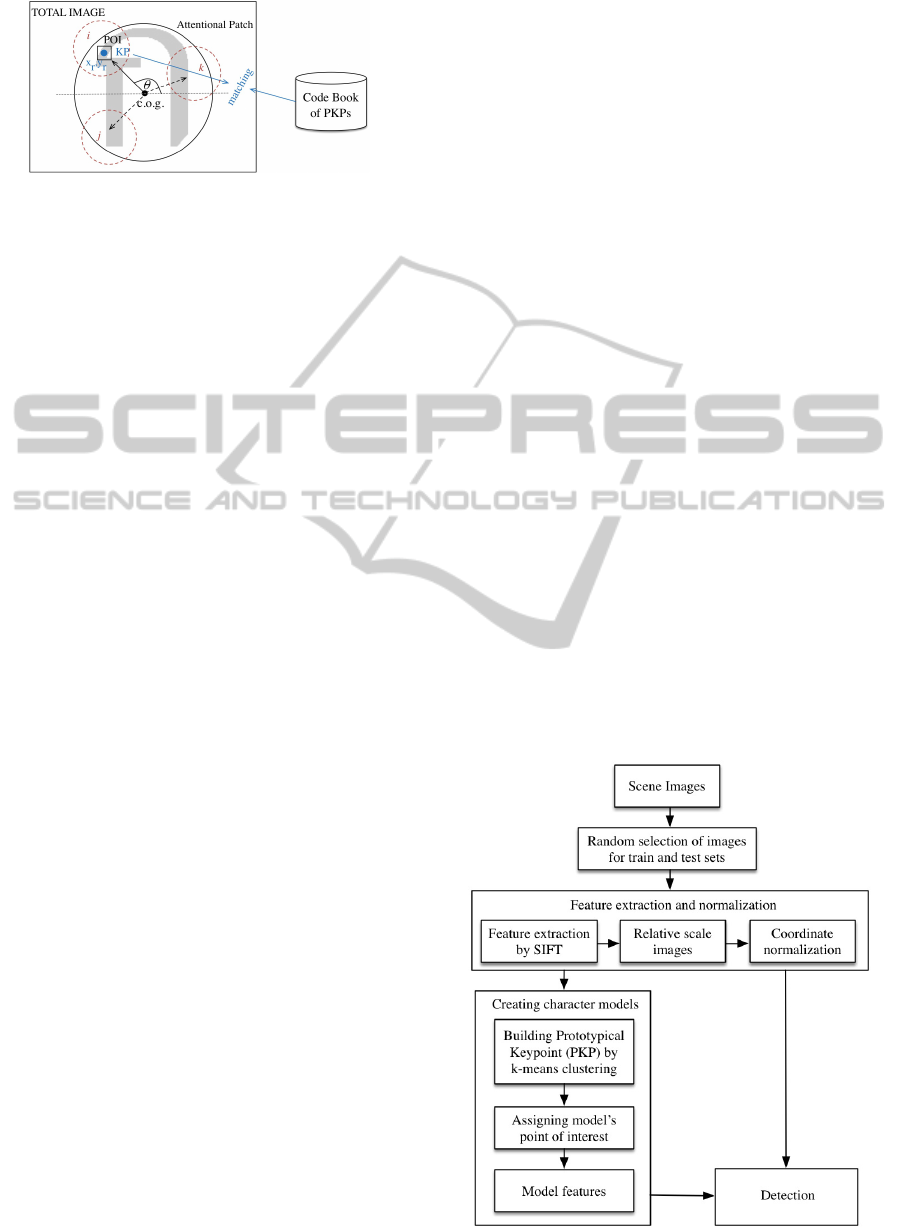
Figure 3: Schematic description of the attentional-patch
modeling approach. Center of gravity (c.o.g) , (0,0).
2.2 Scale Invariant Feature Transform
(SIFT)
The SIFT technique is developed to solve the prob-
lem of detecting images that are different in scale,
rotation, viewpoint and illumination. The principle
of SIFT is that the image will be transformed to
scale-invariant coordinates relative to local features
(Lowe, 2004). In order to obtain the SIFT features,
it starts with finding scale spaces of the original im-
age, the Difference-of-Gaussian (Burt and Adelson,
1983) function is computed to find interesting key-
points, scales and orientation invariances. Next spec-
ifying the location where the exact keypoint is, an in-
teresting point will be compared to its neighbors that
then roughly presents maxima and minima pixels in
the image. These pixels can be used to generate sub-
pixel values in order to improve the quality of the
keypoint localization using the Taylor expansion al-
gorithm. The improved keypoints are better in match-
ing and stability due to this technique. However, some
low-contrast keypoints located along the edge, which
are considered to be poor features will be eliminated.
After receiving the keypoints, the local orientation
of each key point will be assigned by collecting gra-
dient directions and then computing magnitude and
orientation of the pixels around that keypoint. The re-
sult will be put into an orientation histogram, which
has 360 degrees of orientation, and then divided into
36 bins. Any bin percentage that is higher than 80%
(Lowe, 2004) will be assigned to the keypoint. At the
end, image descriptors are created. The descriptors
are computed using the gradient magnitude and ori-
entation around the keypoint. This calculation is ex-
ecuted from 16x16 pixels and grouped into 4x4 cells.
Each cell will be used to form the 8-bin histogram.
Finally, histogram values for all the cells will be com-
bined into 128 descriptors and assigned as the key-
point descriptor.
An important parameter in SIFT is the distance
ratio threshold. In the original paper (Lowe, 2004),
an optimal value of 0.8 is proposed. However, the
optimality of this threshold depends on the applica-
tion. In training mode, false positive keypoints are
the problem whereas in ‘classification testing’ mode,
false negatives may be undesirable. Therefore, we
will use different values for this parameter in the dif-
ferent processing stages.
3 PROPOSED METHODS
3.1 Datasets
Figure 4 shows the overall architecture of the ap-
proach. The process starts with preparing the dataset.
Some English datasets are published and widely used
in computer vision research. However, it is not certain
that methods for Western script are also applicable to
Asian scripts, so a dataset of Asian scripts is required.
We collected a new dataset of Thai script for our study
because Thailand is famous for tourism and a huge
number of foreigners wish to visit. It is therefore ap-
propriate to establish a dataset of Thai text to use in
OCR research and ‘app’ development.
The Thai image dataset is named the Thai Scene
Image dataset by the author (or TSIB in short). The
TSIB images are taken by smartphone under differ-
ent conditions including angle, distance and lighting
conditions. Most images are captured at 1,280x720
pixels of resolution. This dataset contains more than
1,500 images in total. This number of the source
images provides more than 16,000 Thai characters,
which cover all the 10 Arabic numbers, 44 conso-
nants, 15 vowels, 4 tones and 4 symbols of the Thai
Figure 4: Character modeling architecture.
ICPRAM2015-InternationalConferenceonPatternRecognitionApplicationsandMethods
306
language. We took 743 images randomly to be the
first version of our dataset. This preliminary dataset is
composed of 25 consonants and 13 vowels (8,074 and
3,683 character image samples respectively), which
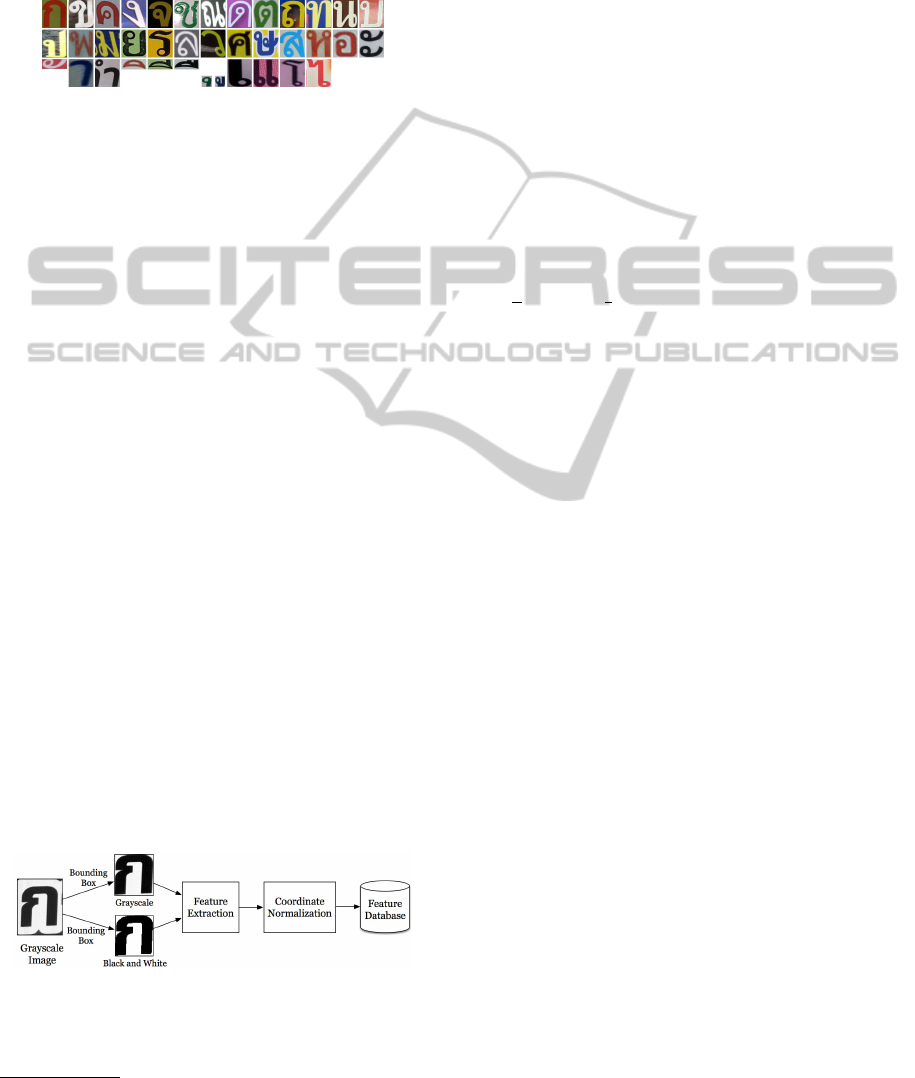
often occur in Thai sentences. Some example charac-
ters of the TSIB dataset are shown in Figure 5.
Figure 5: Example character images of the TSIB dataset.
There are other datasets employed in this paper.
The Robust Reading Dataset from ICDAR2003 (Lu-
cas and et al., 2005) and the Chars74K (de Campos
et al., 2009) datasets are selected to be tested as scene
images of the English scripts. They contain a total of
17,794 samples of English characters. Based on these
numbers of the scene datasets, we can perform the
evaluation of our proposed model by applying it to
both English and an Asian language. Moreover, the
Thai OCR Corpus from The National Electronics and
Computer Technology Center (NECTEC)
1
that con-
sists of 46 character classes of Thai typed letters is
used. Although, these are not scene images, but they
are usable in this paper for evaluating our model in an
ideal situation.
3.2 Feature Extraction and
Normalization
The character images are converted to grayscale in
order to increase the speed and simplify the recog-
nition process. Some character images are inverted if
necessary to always have dark ink (foreground) and
a light background. All the character images in each
class are randomized into two sets: training and test-
ing sets. Both of them will be processed in the feature
extraction and the coordinate normalization methods.
The extracted features will be used as the constituents
of character models in the next step. The flow of this
process is demonstrated in Figure 6.
Figure 6: Process flow of feature extraction and coordinate
normalization.
1
http://www.nectec.or.th
3.2.1 Feature Extraction
Every grayscale image in the dataset is calculated for
its bounding box of the character and is then cropped
based on its detected box. The image is extracted fea-
tures by SIFT that called keypoints (KP), which con-
sist of the coordinate (x, y), scale, orientation and 128
keypoint descriptors, and collected into a database. In
order to enlarge the number of KPs they are also ex-
tracted from a binarized (B/W) copy of the character
image. After receiving all the keypoints, the original
source images are no longer needed in the process.
Only the keypoint vectors will be utilized.
3.2.2 Keypoint Coordinate Normalization
Since the absolute position of the character in the
scene images is unknown, the local keypoints’ posi-
tions needs to be in a relative scale. By the equations:
x
0
=
x
w
and y
0
=
y
h
where w and h are character width
and height, respectively. After that, the relative po-
sitions of the keypoint will be normalized to present
in the same scale space as others by the equations:
x
norm
= x
0
−0.5 and y
norm
= y
0
−0.5. Finally, the final
keypoint vector consists of x
norm
, y
norm
, scale, orien-
tation and 128 keypoint descriptors.
3.3 Creating Character Models
The number of keypoints extracted from character
images in the previous section can be up to more
than 10,000 keypoints for each class. With this vast
number of keypoints, brute matching is undesirable.
To reduce the processing time, keypoint clustering is
necessary to obtain a manageable code book of the
Prototypical Keypoints (PKP). This section describes
the modeling procedures for characters that are per-
formed in two parts: clustering the keypoints and as-
signing the character’s point of interests.
3.3.1 Building Prototypical Keypoints (PKPs)
using K-means Clustering
K-means clustering (Forgy, 1965) is a well-known
and useful technique to partition a huge dataset into
a number of k groups, i.e., clusters. The members
within the cluster have similar characteristics, and the
average vector known as the centroid of the cluster
is a good representative of the cluster. The centroid
is expected to be the Prototypical Keypoint (PKP) of
each keypoint cluster.
All the keypoints of each class are clustered into
several groups using the k-means algorithm in the de-
scriptor (N
dim
= 128). We perform using values k =
ObjectAttentionPatchesforTextDetectionandRecognitioninSceneImagesusingSIFT
307

300, 500, 800, 1,000, 1,500, 2,000 and 3,000 to pro-
duce various sensitivity levels of the model and then
select the centroid of each cluster to be the descrip-
tor of the PKP. We expect that in the 2D spatial lay-
out a distribution of the PKP’s coordinates represents
an important characteristic for each character class.
However, defining the coordinate cannot make use of
the average values of x and y since the clustering is
performed in the descriptor of the keypoint. So, to
determine the proper PKP’s coordinate there needs to
be a separate process.
Looking at a cluster of the keypoints from the pre-
vious step, the descriptor values of the keypoints are
similar, but it is possible that the keypoints are located
in different areas because the SIFT mechanism con-
siders the prominent spots of an object in the picture.
Some different parts of the same character may pro-
vide similar descriptor values. Therefore to find an
appropriate x, y of the delegate PKP, we then perform
the k-means clustering in the coordinate (x, y) within
each cluster. Because of the small number of key-
points in the cluster, we use values k = 2, 3 and 4 to
find the major area of the keypoints within the clus-
ter. With k = 3, most results present an obvious major
group of the cluster with lower distribution rate than
other k values. Therefore, we choose k = 3 and the
centroid of the major cluster is selected as the PKP’s
coordinate (x
pkp
, y
pkp
).
After that, the coordinate and the descriptor
are combined to be a PKP of the model. Algo-
rithm 1 summarizes the steps to build a PKP. By,
input: set of raw keypoints of characters, S
n
=
{kp
n1
, kp
n2
, .., kp
nm
}. output: set of PKP of charac-
ters, F
n
= {pkp
n1
, pkp
n2
, .., pkp
nk
}. Where m = raw
keypoints in a class (1 to m); n = classes (1 to n); G =
cluster of keypoints in descriptor; L = cluster of key-
points in coordinate.
Algorithm 1: Building PKP.
for S
1
to S
n
do
G
1...k
← classi f y{S
desc
, k − means, kgroups}
for G
1
to G
k
do
pkp
desc
← getCentroid{G
desc
}
L
1...3
← classi f y{G
loc
, k − means, 3groups}
L
max
← selectMa jorGroup{L}
pkp
loc
← getCentroid{L
max
}
pkp = {pkp
loc
, pkp
desc
}
end for
F = {pkp
1
, pkp
2
, ..., pkp
k
}
end for
3.3.2 Assigning a Model’s Point of Interest
Given a general code book with Prototypical Key-
points, it becomes important to associate PKPs and
their relative position to character models. The as-
sumption is that each character has points of interest
(POI) that elicit keypoint detection. The POI in each
character is substantial because it is an indicative fea-
ture of a character. Therefore, we need to identify the
interesting points of a model.
Based on the model generated in the previous sec-
tion, we scatter its keypoints on spatial layouts in or-
der to find the distribution of the model’s features.
The scatter diagrams (heat maps) in Figure 7 show
that the normalized PKPs (bottom row) remain almost
the same important points (high density) of the char-
acter as raw KPs (top row in Figure 7). We assume
that the heat area will represent spots of interest which
are normally less than 10 per class according to our
experimental results.
The PKP’s locations (x
pkp
, y
pkp
) are then clustered
by doing the scan for k = 5, 6, 7, 8 and 9. We
found that k = 7 provides the best centroids (x
poi
, y
poi
),
which are located in the proper area and can be con-
sidered as the POI. In order to complete the creation,
every PKP of each cluster will be associated with
the computed POI of the cluster. The POI assign-
ing process is summarized in Algorithm 2. By, input:
set of models features, F
n
= {pkp
n1
, pkp
n2
, .., pkp
nk
}.
Where n = classes (1 to n) ; t = point of interest (1 to
t); R = cluster of PKP ; P = set of POI. After comput-
ing this step, we will get a model structure elements
comprising the Prototypical Keypoint (PKP) and their
POIs as illustrated in Figure 8. The PKP coordinates
are represented by the orange at its normalized loca-
tion. The POI is marked by the yellow dot. The mod-
els are called Object Attention Patches.
Algorithm 2: Assigning POI to PKP.
for F
1
to F
n
do
R
1...t
← classi f y{F
loc
, k − means,tgroups}
for R
1
to R
t
do
p ← getCentroid{R}
end for
P = {p
1
, p
2
, ..., p
t
}
for pkp
1
to pkp
k
do
p ← getMemberO f {pkp
loc
, P}
pkp = {pkp, p}
end for
end for
F = {pkp
1
, pkp
2
, ..., pkp
k
}
ICPRAM2015-InternationalConferenceonPatternRecognitionApplicationsandMethods
308
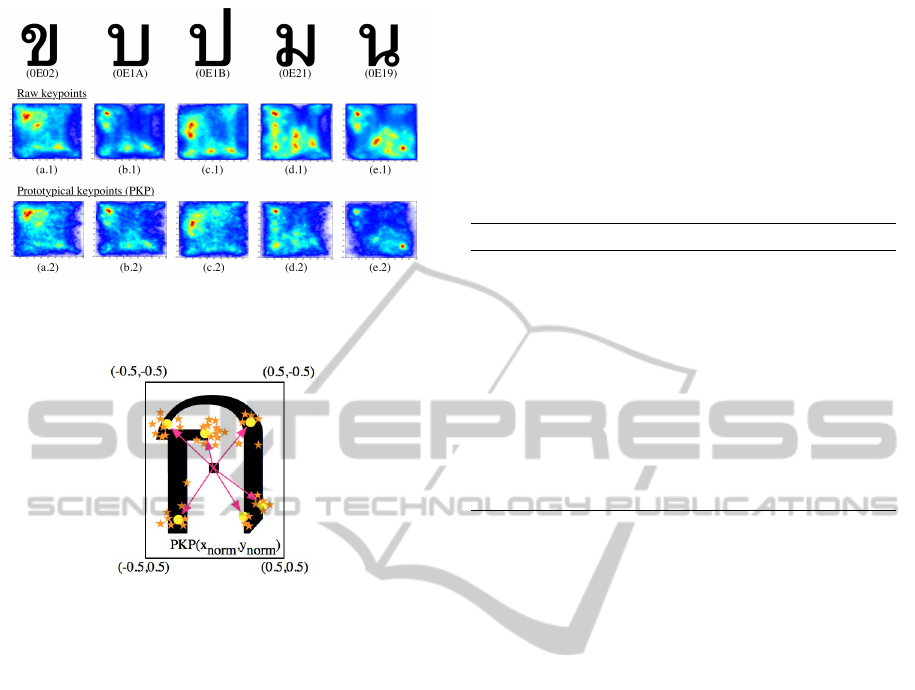
Figure 7: Samples of normalized PKP distribution of sim-
ilar characters (with K << N important keypoint still re-
tained).
Figure 8: Object Attention Patch with SIFT keypoints in a
2D spatial layout.
4 MODEL EVALUATION
We decided to evaluate our proposed models by test-
ing for recognition to find the accuracy rate of the
model. We assume that if the model provides high
accuracy in recognition, it should perform the text de-
tection correctly. The experimaental set up as follows.
• Number of classes: We selected the class of char-
acter images that contains more than 100 training
samples to be tested for TSIB dataset. We use 38
classes of TSIB, 52 classes of ICDAR2003 plus
Chars74K divided into upper and lower case and
46 classes of Thai NECTEC datasets.
• Number of model features: We tested the charac-
ter recognition to find the accuracy rates and con-
fusion matrices of the model based on different
amounts of the model’s features: 300, 500, 800,
1,000, 1,500, 2,000 and 3,000.
• Recognition methods: The SIFT matching al-
gorithm was performed as the basis to classify
the testing images. However, the other mod-
ified SIFT-based methods were also performed
to find the differences in the results. We then
modified the SIFT matching functions by com-
bining them with the Region of Interest (ROI),
Grid regions, and the PKP’s location. Algorithm
3 shows the recognition procedure that is used
in this study. By, input: set of testing images
and set of models, Img
m
= {img
1
, img
2
, .., img
m
};
Model
n
= {model
1
, model
2
, .., model
n
}. Where m
= images (1 to m); n = models (1 to n); R1 = re-
sults of matching by descriptor; R2 = results of
matching by location.
Algorithm 3: Recognition.
for Img
1
to Img
m
do
for Model
1
to Model
n
do
for pkp
1
to pkp
r
do
R1
1...s
← matchByDesc{Model
pkp
, Img
kp
}
end for
for R1
1
to R1
s
do
R2
1...t
← matchByLoc{Model
pkp
, R1
kp
}
end for
end for
FinalResult ← maxMatchedK p{R2}
end for
In summary, we matched the keypoints of the testing
images to the PKPs of the models based on both the
descriptor and location as well as the model’s POIs
depending on the mentioned functions. Then, we
counted the number of matched keypoints to deter-
mine the final result.
The performance evaluation starts with randomly
separating source images into two groups in the pro-
portion of 9:1 for training and testing sets. The train-
ing set goes to modeling methods and produces differ-
ent numbers of the model’s features: 300, 500, 800,
1,000, 1,500, 2,000 and 3,000. We do a scan match-
ing the descriptor with the distance ratio threshold =
0.6, 0.7, 0.8, 0.92. In literature, a value of the distance
ratio equal to 0.8 is suggested (Lowe, 2004) as the op-
timal ratio but the ratio = 0.92 provided better results
in handling shape variations. The number of correctly
matched characters will be calculated as a percentage,
representing the classification accuracy. The accuracy
rates for different datasets are plotted in Figure 9. The
results show that a higher number of PKPs improves
the accuracy, although at the cost of memory.
Figure 10 shows the confusion matrices for a sub-
set of similar-shaped characters, giving an indication
of the classifier performance. In Figure a, the ordinary
SIFT matching classifies testing the images of classes
0E19 to 0E1A. The classification result of class 0E19,
0E21 and other classes are 2, 44, 8 and 21 respec-
tively. The wrong classification is significantly de-
creased (χ
2
= 74.3 and p < 0.0000001) when we clas-
sify them using SIFT with an attention patch (Figure
b). The overall results for the attention patch approach
ObjectAttentionPatchesforTextDetectionandRecognitioninSceneImagesusingSIFT
309
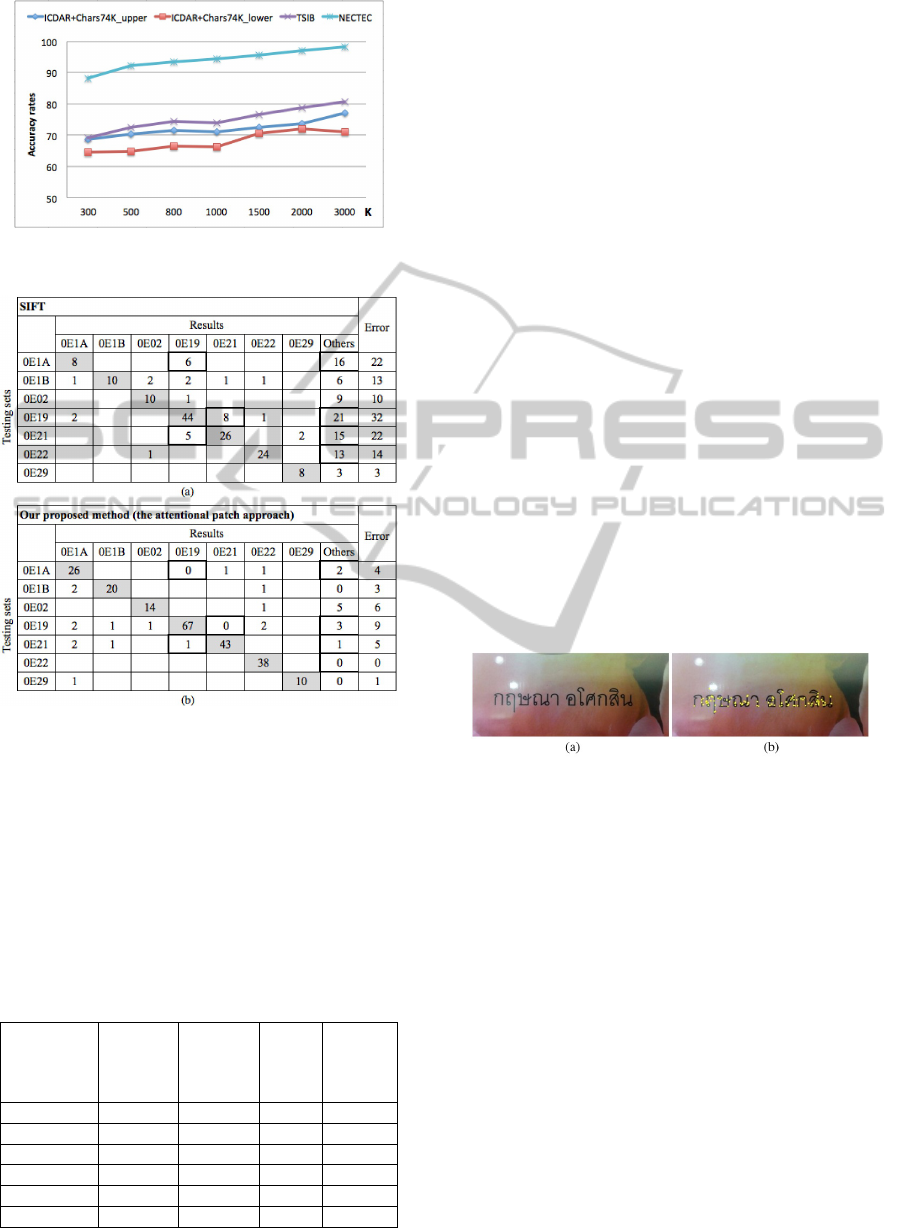
Figure 9: Character recognition results for different values
of code book size k (i.e., number of PKPs).
Figure 10: The comparison of confusion matrices for ordi-
nary SIFT classification (a) and our approach (b).
are given in Table 1. In summary, the performance re-
sults show our models perform acceptably in recogni-
tion with an accuracy rate of more than 70% of all the
datasets. This accuracy can be increased depending
on the code-book size. The similar-shaped characters
is better classified substantially. For these reasons,
our proposed model should be accurate enough to be
used for text detection purposes.
Table 1: Classification results in percentage.
Datasets ICDAR +
Chars74K
WEST
upper
ICDAR +
Chars74K
WEST
lower
TSIB
Thai
NECTEC
Thai
(typed)
Classes 26 26 38 46
Samples 1,083 716 1,191 2,162
SIFT 41.00% 41.34% 41.68% 92.46%
SIFT+ROI 64.91% 63.55% 68.26% 97.18%
SIFTGrid 65.19% 64.07% 71.12% 97.69%
Our method 77.10% 74.93% 80.67% 98.29%
5 TEXT DETECTION USING
OBJECT ATTENTION
PATCHES
We have described the modeling procedure as well as
the evaluation of the models in the recognition pur-
pose. In this section, we present the preliminary re-
sults of the applying of our models to the text detec-
tion based on the assumption that our model should be
able to patch a character’s attentions and locate texts
in the scene image. The images from the TSIB dataset
are selected to be tested, and the detection method is
summarized as follows.
The detection starts with the keypoints extracted
from the testing image and then matched with the
model’s PKPs of the characters we have created. Af-
ter matching, all the matched keypoints are put into
the list. For each matched keypoint, we assume that
the keypoint is surrounded by with some neighbors
that are potentially a ‘child’ of the same character.
The neighborhood definition is based on a minimal
and maximal radius and a minimum number of KPs
in that neighborhood. The number of neighbors and
the radius of the area vary depending on the image
size. The keypoints that are not in this criteria will be
eliminated. Figure 11 gives an example of the detec-
tion results for a line of Thai text.
Figure 11: Extraction of characters from a background us-
ing object attention patches. (a) Original image. (b) Extrac-
tion of characters using character model attention patches.
6 DISCUSSION
We have presented a ‘textuality’ detector using meso-
scale attentional patches in natural scene images con-
taining text. The results are very promising for both
recognition and detection. However, some issues
need to be discussed.
First, creating character model must have a suf-
ficient number of (SIFT) keypoints. If there are not
enough raw keypoints from the training images, it is
important to enlarge the number of keypoints. Some
optional methods such as duplicating black and white
or other image perturbation will be useful. Second,
the number of PKPs directly affects the efficiency of
detection and recognition. However, the larger the
code book, the more intensive is the computation and
ICPRAM2015-InternationalConferenceonPatternRecognitionApplicationsandMethods
310

memory consumption. The challenge is to construct
reliable small codebooks based on a large represen-
tative data set of SIFT KPs. Third, there are many
parameters assigned during the model creation, e.g.,
number of clusters, matched distance ratio threshold
and number of POIs that are not absolutely deter-
mined yet. These optimal values need further experi-
ments. Fourth, in the current modeling, the scale and
orientation of KPs are ignored. It is possible that use-
ful information is lost in this manner. Future work
will address this issue.
Finally, the accuracy rates of approximately 70
- 80% are satisfactory for the character detection in
scene images, but it is relatively low when compare
to machine-printed paper text images at 98.29%. That
may be because the PKPs are created from differ-
ent images. If images quality was improved in the
pre-processing, the performance would be increased.
Eventually, this efficient model could improve detect-
ing and recognizing texts more precisely in scene im-
ages.
7 CONCLUSION
This paper has presented a SIFT-based modeling of
character objects for scene-text detection and recogni-
tion. The construction of models (attentional patches)
from natural scenes has been described. The evalu-
ation of character recognition and a preliminary test
for text detection shows our proposed model is usable
for scene-text detection and recognition purposes. For
future work, an algorithm to increase text detection
performance is necessary. On the basis of the current
framework, there is a potential both in the improve-
ment of the feature scheme for recognition but also
for the development of, e.g., NN classifiers that use
the current framework as a textuality detector.
REFERENCES
Bay, H., Ess, A., Tuytelaars, T., and Van Gool, L. (2008).
Speeded-up robust features (surf). Comput. Vis. Image
Underst., 110(3):346–359.
Borji, A., Sihite, D. N., and Itti, L. (2012). Salient ob-
ject detection: A benchmark. In Proceedings of the
12th European Conference on Computer Vision - Vol-
ume Part II, ECCV’12, pages 414–429, Berlin, Hei-
delberg. Springer-Verlag.
Burt, P. and Adelson, E. (1983). The laplacian pyramid as a
compact image code. Communications, IEEE Trans-
actions on, 31(4):532–540.
Chen, X., Yang, J., Zhang, J., and Waibel, A. (2004). Au-
tomatic detection and recognition of signs from natu-
ral scenes. Image Processing, IEEE Transactions on,
13(1):87–99.
de Campos, T. E., Babu, B. R., and Varma, M. (2009). Char-
acter recognition in natural images. In Proceedings
of the International Conference on Computer Vision
Theory and Applications, Lisbon, Portugal.
Epshtein, B., Ofek, E., and Wexler, Y. (2010). Detect-
ing text in natural scenes with stroke width transform.
In Computer Vision and Pattern Recognition (CVPR),
2010 IEEE Conference on, pages 2963–2970.
Fan, L., Fan, L., and Tan, C. L. (2001). Binarizing docu-
ment image using coplanar prefilter. In 6th Interna-
tional Conference Proceedings on Document Analysis
and Recognition, pages 34–38.
Forgy, E. W. (1965). Cluster analysis of multivariate data:
efficiency versus interpretability of classifications bio-
metrics. Biometrics, 21:768–769.
Koo, H. I. and Kim, D. H. (2013). Scene text detec-
tion via connected component clustering and nontext
filtering. Image Processing, IEEE Transactions on,
22(6):2296–2305.
Li, C., Ding, X., and Wu, Y. (2001). Automatic text lo-
cation in natural scene images. In Document Analy-
sis and Recognition, 2001. Proceedings. Sixth Inter-
national Conference on, pages 1069–1073.
Lowe, D. G. (2004). Distinctive image features from scale-
invariant keypoints. Int. J. Comput. Vision, 60(2):91–
110.
Lucas, S. and et al. (2005). Icdar 2003 robust reading com-
petitions: entries, results, and future directions. Inter-
national Journal of Document Analysis and Recogni-
tion (IJDAR), 7(2-3):105–122.
Morel, J.-M. and Yu, G. (2009). Asift: A new framework
for fully affine invariant image comparison. SIAM J.
Img. Sci., 2(2):438–469.
Ojala, T., Pietikainen, M., and Maenpaa, T. (2002). Mul-
tiresolution gray-scale and rotation invariant texture
classification with local binary patterns. Pattern Anal-
ysis and Machine Intelligence, IEEE Transactions on,
24(7):971–987.
Park, J., Yoon, H., and Lee, G. (2007). Automatic seg-
mentation of natural scene images based on chro-
matic and achromatic components. In Proceedings
of the 3rd International Conference on Computer Vi-
sion/Computer Graphics Collaboration Techniques,
MIRAGE’07, pages 482–493, Berlin, Heidelberg.
Springer-Verlag.
Smolka, B. and et al. (2002). Self-adaptive algorithm of
impulsive noise reduction in color images. Pattern
Recognition, 35(8):1771–1784.
Yi, C. and Tian, Y. (2011). Text detection in natural scene
images by stroke gabor words. In Document Analysis
and Recognition (ICDAR), 2011 International Confer-
ence on, pages 177–181.
Zhang, M. and et al. (2009). Ocrdroid: A framework to dig-
itize text using mobile phones. In International Con-
ference on Mobile Computing, Applications, and Ser-
vices (MOBICASE), pages 273–292. Springer-Verlag
New York.
ObjectAttentionPatchesforTextDetectionandRecognitioninSceneImagesusingSIFT
311
