
Video Analysis in Indoor Soccer using a Quadcopter
Filipe Trocado Ferreira
1
, Jaime S. Cardoso
1,2
and H
´
elder P. Oliveira
2
1
Faculdade de Engenharia da Universidade do Porto, Porto, Portugal
2
INESC TEC, Porto, Portugal
Keywords:
Sport Analysis, Quadcopter, Video Processing, Player Detection, Homography Estimation.
Abstract:
Automatic vision systems are widely used in sports competition to analyze individual and collective perfor-
mance during the matches. However, the complex implementation based on multiple fixed cameras and the
human intervention on the process makes this kind of systems expensive and not suitable for the big majority
of the teams. In this paper we propose a low-cost, portable and flexible solution based on the use of Unmanned
Air Vehicles to capture images from indoor soccer games. Since these vehicles suffer from vibrations and dis-
turbances, the acquired video is very unstable, presenting a set of unusual problems in this type of applications.
We propose a complete video-processing framework, including video stabilization, camera calibration, player
detection, and team performance analysis. The results showed that camera calibration was able to correct
automatically image-to-world homography; the player detection precision and recall was around 75%; and the
high-level data interpretation showed a strong similarity with ground-truth derived results.
1 INTRODUCTION
Soccer is without question one of the most popu-
lar sports worldwide. All the monetary amounts re-
lated to this sport justify the millionaire budget of the
teams, not only in the acquisition of players, but also
technical staff. They have the responsibility to pre-
pare the team and help the coach in order to achieve
the best results. In the strategic planning for the
games, information about position and movement of
the player on the field is used by the coach and other
technical staff.
Indoor soccer is gaining more and more visibil-
ity nowadays due to its dynamic nature and reduced
space to play, which often forces the teams to think
better and practice their tactics to the extreme. For
this reason, this sport has been the target of technical
and scientific interest, showing several applications
dedicated to tactical, physical and physiological anal-
ysis.
Initially, statistics on collective and individual per-
formance were extracted manually with low reliabil-
ity and precision. Currently, automatic vision systems
are used to collect this information with high accu-
racy. However, they have high acquisition and license
prices, because of high complex installation with mul-
tiple fixed cameras around the stadium or sports hall,
as well as excessive human intervention in the video
analysis making them not accessible for the majority
of the teams.
An alternative solution for an image acquisition
system is based on Unmanned Aerial Vehicles (UAV).
These vehicles have been gaining relevance in differ-
ent areas of use, from military to sports. The UAV
normally equipped with high definition cameras, can
be used autonomously to obtain images in a stadium
or other sports hall. UAVs allow to setup a reliable,
portable and low cost solution to capture images from
indoor soccer games. These images can be processed
offline in order to extract useful information about
individual and collective performance during soccer
matches.
The aim of this work is to design an automatic
video analysis framework, for a low cost image ac-
quisition system of indoor soccer games, in order to
get complex information about the game from image
sequences shot by an UAV. We extract automatically
the position of the player from the image sequence
and map it in the world coordinates. From these
low-level data, high-level information can be derived,
such as occupational heatmaps, offensive and defen-
sive trends, tactics interpretation, among others.
1.1 Related Work
The (semi-)automatic video analysis system of a
soccer game typically comprises modules such as
background/foreground segmentation, camera cali-
77
Trocado Ferreira F., Cardoso J. and Oliveira H..
Video Analysis in Indoor Soccer using a Quadcopter.
DOI: 10.5220/0005206000770086
In Proceedings of the International Conference on Pattern Recognition Applications and Methods (ICPRAM-2015), pages 77-86
ISBN: 978-989-758-076-5
Copyright
c
2015 SCITEPRESS (Science and Technology Publications, Lda.)

bration and player detection. The acquisition is most
commonly based on multiple fixed cameras around
the stadium or sports hall, covering all the play-
field (Figueroa et al., 2006; Ren et al., 2009; Choi and
Seo, 2011; Iwase and Saito, 2004). With these topolo-
gies, the spatial segmentation task can be easily per-
formed applying an approach based on background
subtraction. On the other hand, simpler image acqui-
sition architectures, such as with a single camera (Lu
et al., 2009; Dearden et al., 2006) or using TV broad-
casting sequences (Ekin et al., 2003; Khatoonabadi
and Rahmati, 2009) require more complex processing
for the background/foreground segmentation, but also
on the following stages, mainly on player detection
and camera calibration. The most usual techniques
for image segmentation range from background sub-
traction using a background model created from ini-
tial frames (Iwase and Saito, 2004) to more complex
dynamic model using a representation on a specific
colorspace taking advantage of a dominant and homo-
geneous color field (Figueroa et al., 2006; Ren et al.,
2009; Ekin et al., 2003). However, when background
is neither static nor there is a dominant field color as
in indoor sports, the basic methods presented above
are not suitable for players’ segmentation.
The relation between image coordinates and world
coordinates is a fundamental task of the sports analy-
sis problem, solved using the calibration of the cam-
era with respect to the field. By knowing the cam-
era parameters, it is possible to relate the position
of the players in the image with their actual position
on the field (Figueroa et al., 2006; Lu et al., 2013a).
When fixed cameras are used, this stage is trivially
accomplished and can be performed manually; oth-
erwise, when the camera moves, dynamic and auto-
matic methods are required (Lu et al., 2013b).
The detection of the players has been addressed
with different techniques. Some of these methods
rely on the extraction of features and posterior clas-
sification (Lu et al., 2009; Liu et al., 2009). However,
if temporal tracking is not taken into account, false
positives and missed detections are frequent. The dy-
namics of the players together with complex obser-
vation models are therefore also used to improve the
detection and tracking of the players. In this sense,
mean shift (Kheng, 2011), Kalman Filters (Welch and
Bishop, 1995), and Particle Filters (Doucet and Jo-
hansen, 2011) are the most commonly adopted solu-
tions. Recently, Linear Programming based methods
(Shitrit et al., 2011) or Conditional Random Fields
(Lu et al., 2013b) were used to overcome the diffi-
culties of multiple people tracking.
Most of the work found in literature focus mainly
on players’ position, trajectories and high level and
collective performance information. On the other
hand, just a few examples of research works include
ball, goals, passes and set pieces detection (Santiago
et al., 2010). From the technological point of view,
relevant aspects are left out. For example, computa-
tion time and real time constraints are barely consid-
ered. Finally, all the image acquisition architectures
use one or more fixed cameras and there is no relevant
work using portable or moving systems for image ac-
quisition.
2 A FRAMEWORK FOR VIDEO
ANALYSIS IN USING AN UAV
In this section we present the proposed methodology,
designed to automatically capture, process, and ex-
tract player and team performance statistics from a
soccer video stream captured with an UAV. Only in
the beginning of the processing, the system interac-
tively queries the user to obtain initial information to
support the automatic processing of the whole video.
A block diagram of the main steps of the proposed
methodology is presented in Figure 1. The main
stages of the framework are: video stabilization, cam-
era calibration, player detection and tracking and high
level interpretation of the game.
2.1 Image Acquisition
The images from indoor soccer games used in this
research are shot by the Ar.Drone’s frontal camera.
The Drone is controlled using Parrot’s commercial
application for mobile devices
1
. The drone was pro-
grammed to hover on a static position, 5 to 7 meters
above floor, close to the side line of the pitch (see Fig-
ure 2). The structure of the Ar.Drone was modified
to make its frontal camera point 30 degrees down, in
order to capture the game action and simultaneously
avoid occlusions with other objects.
2.2 Video Stabilization
Due to unavoidable drone’s motion, the image se-
quences will suffer from undesired global movement.
Since most of the techniques for the following pro-
cessing stages assume a static background, it is fun-
damental to stabilize the video. This step will severely
impact the global performance of the framework.
We designed a method based on feature match-
ing between two consecutive frames. Feature extrac-
1
https://play.google.com/store/apps/details?id=com.par
rot.free flight
ICPRAM2015-InternationalConferenceonPatternRecognitionApplicationsandMethods
78
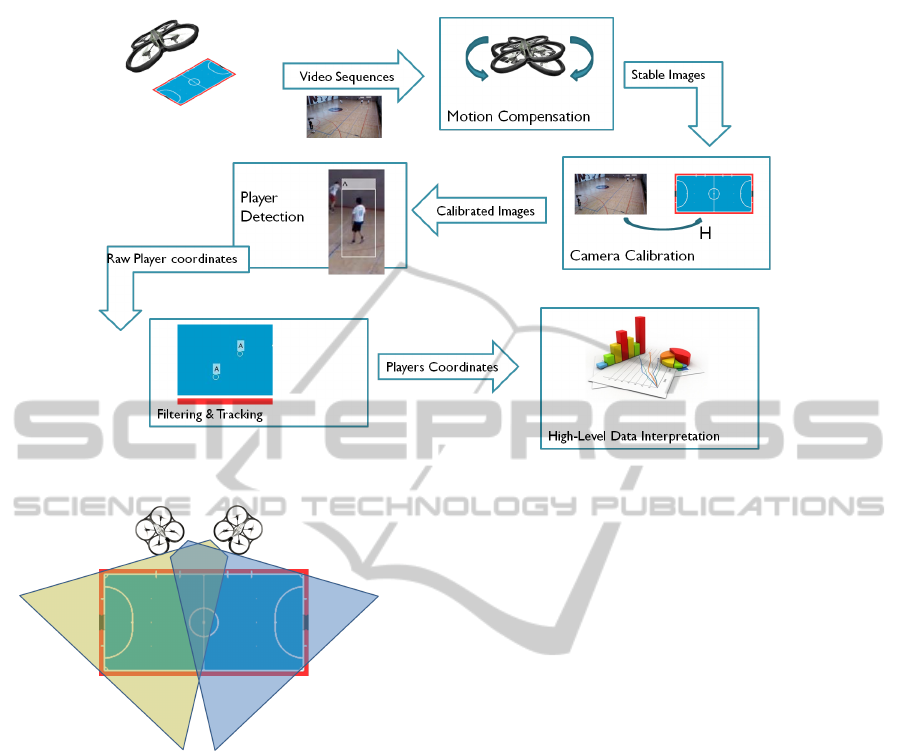
Figure 1: Block diagram of the proposed methodology.
Figure 2: Representation of UAVs position while recording
the image sequences from indoor soccer games.
tion was implemented using the Features from Accel-
erated Segment Test (FAST) algorithm (Rosten and
Drummond, 2006), due to its efficiency. For the fea-
ture matching, the M-estimator SAmple Consensus
(MSAC) (Torr and Zisserman, 2000), a variant of the
RANdom SAmple Consensus (RANSAC), was em-
ployed.
The transformation between the two sets of in-
liers was estimated using the least squares method,
and the motion estimation was computed based on
a similarity transformation, which is composed by
Scale-Rotation-Translation transformations with four
degrees of freedom.
Finally, the stabilization of the video over time is
performed with the chain of the transformations be-
tween consecutive frames. Let us define H
i
as the
similarity transformation between frames i + 1 and i
so that:
H
cumulative
= H
i−1
···H
2
H
1
(1)
The image composition is achieved warping the
currently frame using the cumulative transformation
H
cumulative
, with the coordinate system defined in the
initial frame.
2.3 Camera Calibration
Camera calibration is a necessary step in 3D computer
vision in order to extract metric information from 2D
images. If images are taken by the same camera,
correspondences between images are sufficient to re-
cover the parameters which allow us to reconstruct the
3D structure (Zhang, 2000). We will only use points
in the field plane and the field is assumed rectangular
with known height/width ratio. We are interested in
finding the mapping between image coordinates and
the position in the field (see Figure 3).
2.3.1 Initialization
In the beginning of the process the user’s manual in-
tervention is required to identify the corners of the
field in the initial frame. Subsequently, the least
squares algorithm is performed to calculate the eight
parameters of the perspective transformation. Since
the Drone’s camera is covering only half of the field,
the points to pick correspond to the corners of half
field. Let us define the point in the image represented
in homogeneous coordinates ˜m = [x, y, 1]
T
and the
corresponding point in the field plane
˜
M = [X,Y, 1]
T
.
VideoAnalysisinIndoorSoccerusingaQuadcopter
79
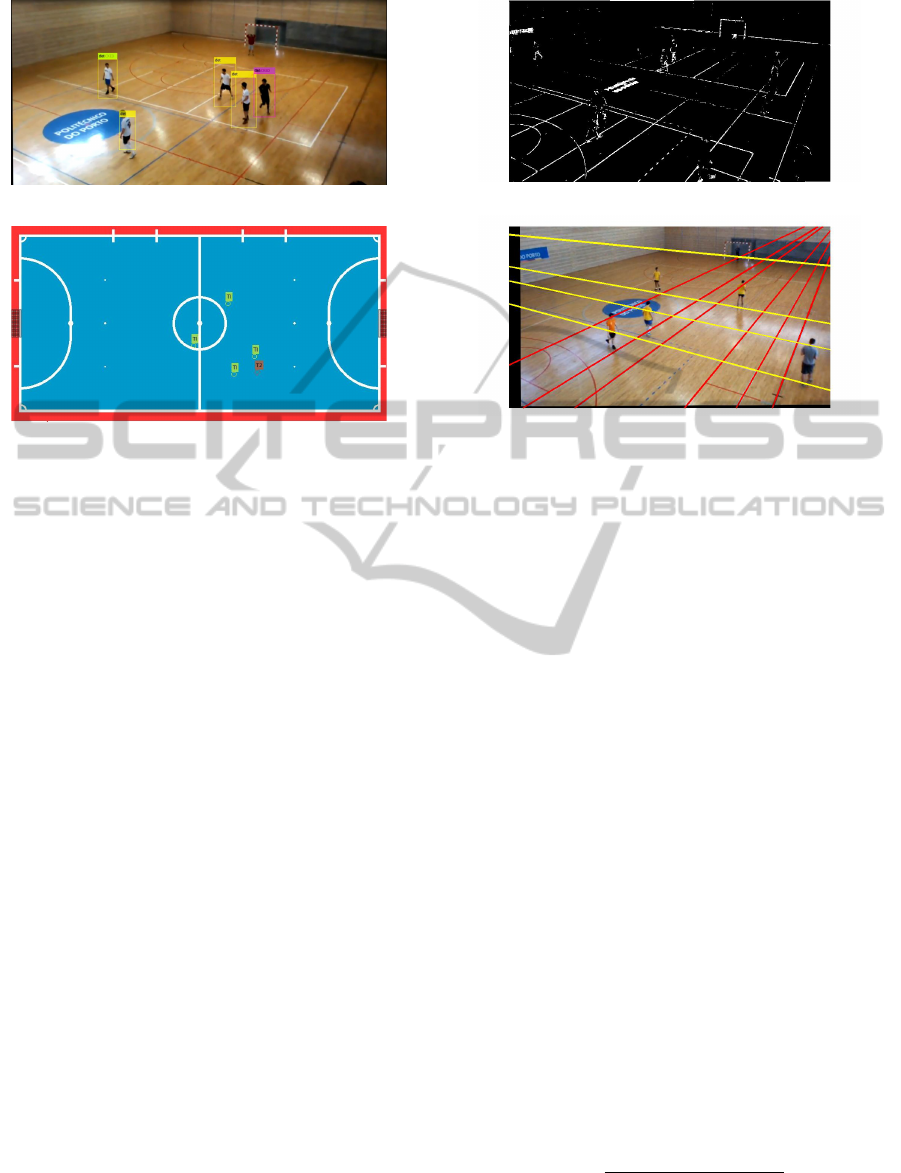
(a) Players in the image domain.
(b) Players mapped in the virtual field
Figure 3: Mapping between image coordinates and the po-
sition the field.
They are related by the following expression:
Ah = b, (2)
where
A =
X
1
Y
1
1 0 0 0 −x
1
X
1
−x
1
Y
1
0 0 0 X
1
Y
1
1 −y
1
X
1
−y
1
Y
1
X
2
Y
2
1 0 0 0 −x
2
X
2
−x
2
Y
2
0 0 0 X
2
Y
2
1 −y
2
X
2
−y
2
Y
2
X
3
Y
3
1 0 0 0 −x
3
X
3
−x
3
Y
3
0 0 0 X
3
Y
3
1 −y
3
X
3
−y
3
Y
3
X
4
Y
4
1 0 0 0 −x
4
X
4
−x
4
Y
4
0 0 0 X
4
Y
4
1 −y
4
X
4
−y
4
Y
4
,
b =
x
1
y
1
x
2
y
2
x
3
y
3
x
4
y
4
and h =
h
11
h
12
h
13
h
21
h
22
h
23
h
31
h
32
,
with h
i j
corresponding to the elements of the pro-
jective matrix. The solution is given by least square
method and can be expressed as:
h = (A
T
A)
−1
(A
T
b) (3)
The user is also requested to identify in the first
frame ‘good lines to track’. Most of the indoor sports
venues are used for multiple sports so all the lines of
(a) Result of binarization procedure.
(b) Result of line detection based on Hough Transform
Figure 4: Example of binarization and line detection results.
the courts are painted in the floor. The user is asked
to identify the most salient lines (by identifying two
points in each), to be detected and matched automati-
cally in the succeeding frames.
2.3.2 Line Detection and Matching
To estimate automatically the image-to-world homog-
raphy, we detect lines automatically on the current
frame and match them to the lines manually identi-
fied by user in the first frame.
The line detection is performed using the Hough
transform. The Hough transform is performed over
a binary image obtained by a morphological gradient
transformation (result of the subtraction of the result
of opening operation by the result of closing on the
current frame) followed by image binarization with
the Otsu’s method (Otsu, 1975). See Figure 4 for an
example.
The next step of the automatic calibration proce-
dure is to match the detected lines with the lines in
the first frame. This matching problem is modeled as
an assignment problem and solved using Munkres al-
gorithm (Munkres, 1957). This method is performed
minimizing the total cost of assignment. The cost of
assigning a detected line to a manually delineated line
is calculated using the distance between their param-
eters in Hough Space:
cost
i j
=
q
(θ
i
− θ
j
)
2
+ (ρ
i
− ρ
j
)
2
(4)
The intersecting points of the matched lines are
used to estimate the homography from the current
ICPRAM2015-InternationalConferenceonPatternRecognitionApplicationsandMethods
80

frame to the initial frame and update the mapping be-
tween image coordinates and the position the field.
Since, after video stabilization, the homography does
not change significantly from frame to frame and the
Hough Transform is computationally expensive, we
perform this calibration step once every B > 1 frames.
2.4 Player Detection
Due to the camera motion and to the existence of si-
multaneously multiple colored lines on the court, ba-
sic segmentation methods (background segmentation
and subtraction) are not suitable for this application.
Some preliminary results showed poor results with
low detection rate and high number of false positive
detections.
We avoided the problematic segmentation and
opted for solution fusing temporal tracking with a
static people detector approach.
2.4.1 Static People Detector Approach
This module includes a cascade of a standard people
detector with a postprocessing for team identification
and false positive handling.
The detector is based on an Histogram of Oriented
Gradients (HOG) descriptor followed by a SVM clas-
sifier (Dalal and Triggs, 2005). This approach was
found to be robust to changes in intensities informa-
tion such as for example person and equipment colors.
The HOG detector is unable to discriminate play-
ers from the two teams and since the players posture
can deviate significantly from the upright position, the
output includes multiple false positives. Therefore,
the results obtained from the HOG detector will be
verified taking in account the appearance measured in
the bounding box outputted by the HOG detector. As
part of the initialization process, the HOG detector is
run over a sample of frames and the user is requested
to manually label a small number of detected objects
as ‘player from team A’, ‘player from team B’, and
‘not a player’. During the automatic processing, the
representation of the detected objects will be com-
pared with the stored representative examples man-
ually annotated and the detected objects are labeled
in one of the aforementioned three classes. This pro-
cedure allows to discard false positive detections and
also group the detections in two classes representing
both teams in the field. The decision is made compar-
ing the histogram h
i
of the detected object with all the
histograms h
j
of the objects collected in the initializa-
tion process. The distance between each channel of
two histograms is calculated using the Bhattacharyya
method (Choi and Lee, 2003):
d
i, j
=
v
u
u
t
1 −
1
q
¯
h
i
¯
h
j
N
2
∑
q
h
i
(n)h
j
(n), (5)
where
¯
h
k
=
1
N
∑
N
n=1
h
k
(n). The result of this expres-
sion is a value between 0 and 1 where 0 means a per-
fect match and 1 a total mismatch between both his-
tograms.
2.4.2 Mean Shift and Short Term Tracking
In parallel with the static detector, we apply a tempo-
ral tracking method based on the mean shift. Mean
shift is an algorithm that iteratively moves a search
window in the direction of its center of mass until
it coincides with the geometric centroid. Despite its
simplicity, this is a widely used method for object
tracking on the image sequences (Comaniciu et al.,
2000). It provides reliable prediction of an object po-
sition based on its appearance but it fails over time
once that player’s appearance and size change.
The output of the temporal tracking is finally fused
with the static detector taking in account both the po-
sition and size of the resulting bounding boxes. Static
detections close to temporally tracked positions are
used to updated the tracker; static detections corre-
sponding to objects not currently tracked are used to
initialize a new track if the total number of tracked
objects is still below the known number of players in
the game. See Figure 5 for an illustrative example.
2.5 High Level Interpretation
After gaining knowledge about the players position in
the field during the game, we can now extract high
level information about the individual and collective
performance. Even with an inaccurate low-level in-
formation it is possible to infer some high level inter-
pretation related to field occupancy, offensive trends
and defensive tactics. The preliminary analysis that
follows is based on the common knowledge of the
authors about the game and evaluated considering
mainly subjective criteria.
2.5.1 Occupation Map
The position of the players mapped onto the world
coordinates is used to show how players occupied the
field and can give important clues about teams’ strate-
gies and performance (Lu et al., 2013b). The field
model is divided in a grid of N
1
× N
2
cells in which
the actual position of the players is projected. Each
grid cell accumulates the number of players there over
time; the accumulated counts provide a spatial his-
togram showing the most occupied zones of the field
for each team.
VideoAnalysisinIndoorSoccerusingaQuadcopter
81
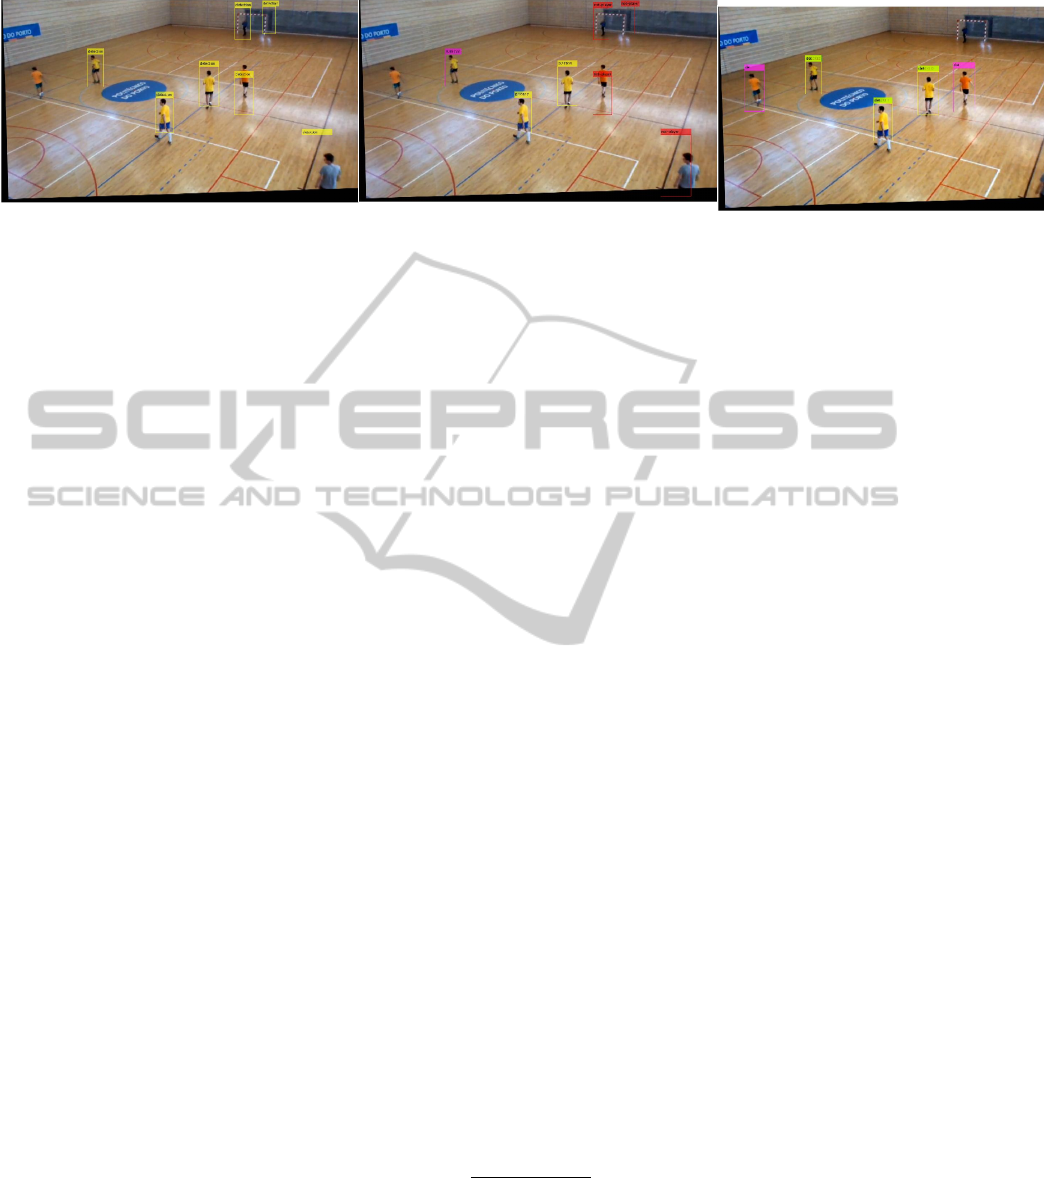
(a) Raw HOG detector results.
(b) Results after Team Identification.
(c) Final results with HOG+ Mean Shift.
Figure 5: Evolution of detection results through the different stages of the proposed method.
2.5.2 Team Attitude
Team attitude or offensive/defensive trends can illus-
trate which team is being more dangerous or more
close to score a goal. We assume that in each frame
we have available the position (x
i
, y
i
) on the field
of one to four players from each team and that it is
known a priori which team is attacking and defend-
ing. For each team the offensive trend is calculated
taking in account the relative position of the rearmost
player on the ground to the midfield line and the rela-
tive position of the most advanced player to the oppo-
nent goal line.
2.5.3 Team Tactics
It is possible to make an analysis of the team tactical
behavior and its evolution over time. In indoor soc-
cer there are two main defensive formations: “2-2” is
based on two front player making high pressure and
two back players. Other usual formation is “1-2-1”
where only one player is making high pressure and a
back player assumes most of the defensive tasks. To
distinguish between the two formations, we use an ap-
proach based on the spatial distribution relative to the
frontmost and rearmost players. A 3-bin histogram of
players x coordinates is created considering the dis-
tance to the rearmost and frontmost players. Then the
histograms are compared to the model: if histogram
is [1, 2, 1] we will assume that the formation at that
instant is the “1-2-1”, if the histogram is [2, 0, 2] the
formation “2-2” is assumed. Finally each formation
counter is accumulated and normalized being possi-
ble to observe its evolution over time.
3 EXPERIMENTAL RESULTS
The proposed methodology was evaluated with
sequences captured during games or warm ups of
official amateur tournaments. Although we con-
ceptualize a setting where the field is covered by
2 or more UAV, due to budget constraints, only 1
UAV was used in this work, covering one half of
the field. The videos recorded have 1280 × 720
pixels and were acquired at 30 frames per second
(fps). During the acquisitions team players used
different shirt colors in order to distinguish the two
teams. Referees as well as spectators can appear on
some these sequences. We tried to cover different
circumstances and deal with usual difficulties on
this kind of systems. We used three different video
sequences to test the different stages of the methods
in different pavilions, light conditions and with
different team colors. The sequences obtained have a
duration between 30 seconds to 1 minute, and were
selected to avoid situations with sudden movements
of the air vehicle but including some other undesired,
but usual, situations in this kind of systems, such as:
players moving in and out of the image, occlusions
and camera motion:
• Sequence Number 1
2
: Shot during team warm
up. In the field there are eight players from the
white team and three from the black team. At the
5
th
second the drone suffers a strong oscillation.
• Sequence Number 2
3
: Shot during an official
game. Two different teams of four field players
wearing black and white equipments. This se-
quence suffers from bad illumination reflection of
the floor.
• Sequence Number 3
4
: Shot during an official
game. Two different teams of four field players
wearing yellow and orange equipments. In some
parts of the field the yellow and orange equip-
ments appear to be very similar.
2
https://www.youtube.com/watch?v=3VDAR10wqDM
3
https://www.youtube.com/watch?v=tUpY8VHWWaw
4
https://www.youtube.com/watch?v=TNCkiUTyqIk
ICPRAM2015-InternationalConferenceonPatternRecognitionApplicationsandMethods
82
For a more objective evaluation of the developed
methodology, ground truth data annotation was per-
formed, including the position and team of the players
and also the four points needed to define the homog-
raphy between the field and the image plane. This
ground truth data was manually collected at a pre-
defined frame rate and then interpolated to all the
frames.
The people detector used in this framework was
already implemented in the MATLAB Computer Vi-
sion toolbox. The model is trained to detect people on
upright position and it is based in (Dalal and Triggs,
2005). Note that in sports context players are many
times running, tackling, occluding each other’s and
all these are propitious situations to fail the detection.
3.1 Video Stabilization Evaluation
In this project the results of video stabilization stage
will be evaluated qualitatively and with subjective cri-
teria such as motion compensation, long term accu-
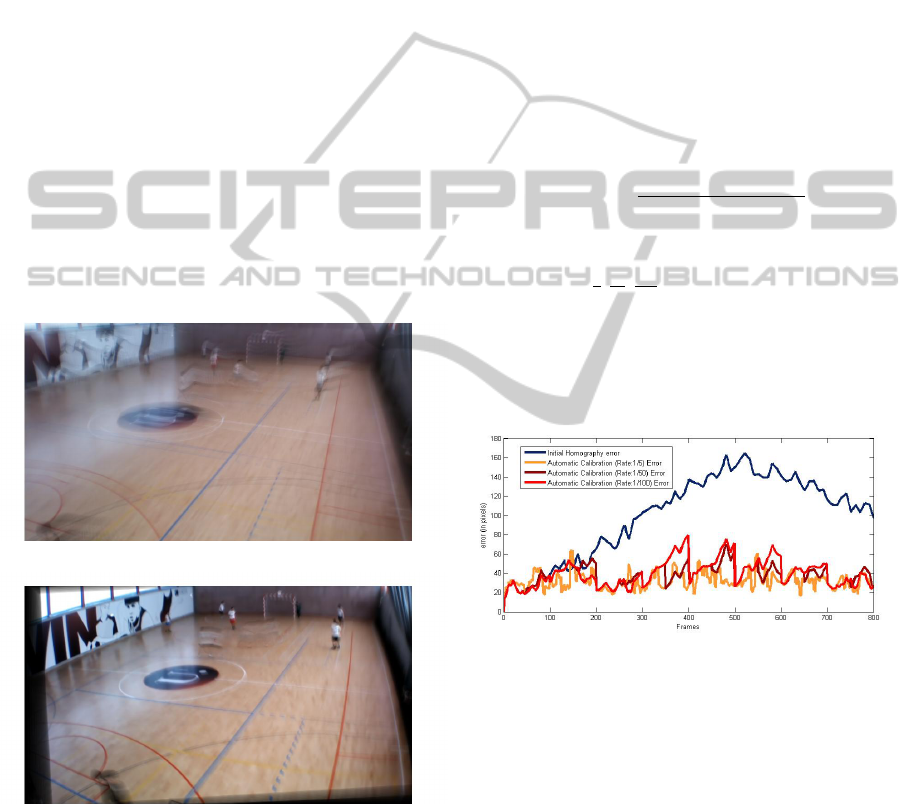
racy and efficiency. In Figure 6 we can visualize the
difference of using and not using video stabilization.
(a) Mean of non-stabilized sequence (1 second)
(b) Mean of stabilized sequence (1 second)
Figure 6: Impact of the video stabilization stage.
The proposed method allows us to eliminate high
frequency jittering and to compensate almost all of
the short term camera movement. However, low-
frequency movement is not compensated since using
a cascade approach, error is accumulated over time.
The main cause of this error is the geometric trans-
formation chosen to model the frame-to-frame move-
ment. The method developed fails also in cases of
strong drone’s oscillations because of the reduction
of visible image area loosing visual relevant informa-
tion which is very prejudicial to player tracking and
camera calibration.
3.2 Camera Calibration Evaluation
To evaluate the camera calibration step, we measured
the distance in pixels of the four corner points of the
half field rectangle. These four points are used since
they usually appear in all sequences and are enough to
define the world-to-image homography. Let us define
X
i
= (x
i
, y
i
) with i ∈ [1, 2, 3, 4] as the four points manu-
ally annotated in a frame t and
˜
X
i
= ( ˜x
i
, ˜y
i
) as the four
points resulting of the camera calibration method on
the same frame. The error of the calibration method
can then be expressed as:
error
t
=
∑
i
q
(x
i
− ˜x
i
)
2
+ (y
i
− ˜y
i
)
2
(6)
The method was evaluated using different sampling
rates, namely:
1
5
,
1
50
,
1
100
corrections per frame. Addi-
tionally, the error evolution was also compared with
the initial and static homography. Figure 7 shows the
efficiency of the method under the different aforemen-
tioned correction rates. While initial homography di-
verges on time, the proposed method is more stable.
Figure 7: Error of camera calibration method with different
correction rates on sequence 3.
In Figure 8 is possible to observe the influence of
the detection rate and position of the drone to the ef-
ficiency of the calibration. In this case we use a se-
quence shot with low altitude and far from the cov-
ered half field. This causes that most of the detected
lines are not well spread across the field, increasing
the probability of bad lines matching and consequent
calibration drift. Low calibration rates can also lead
to lose the correct assignment of the lines.
3.3 Player Detection Evaluation
Player detection methods were evaluated in terms of
precision and recall. In this stage only sequences 2
VideoAnalysisinIndoorSoccerusingaQuadcopter
83
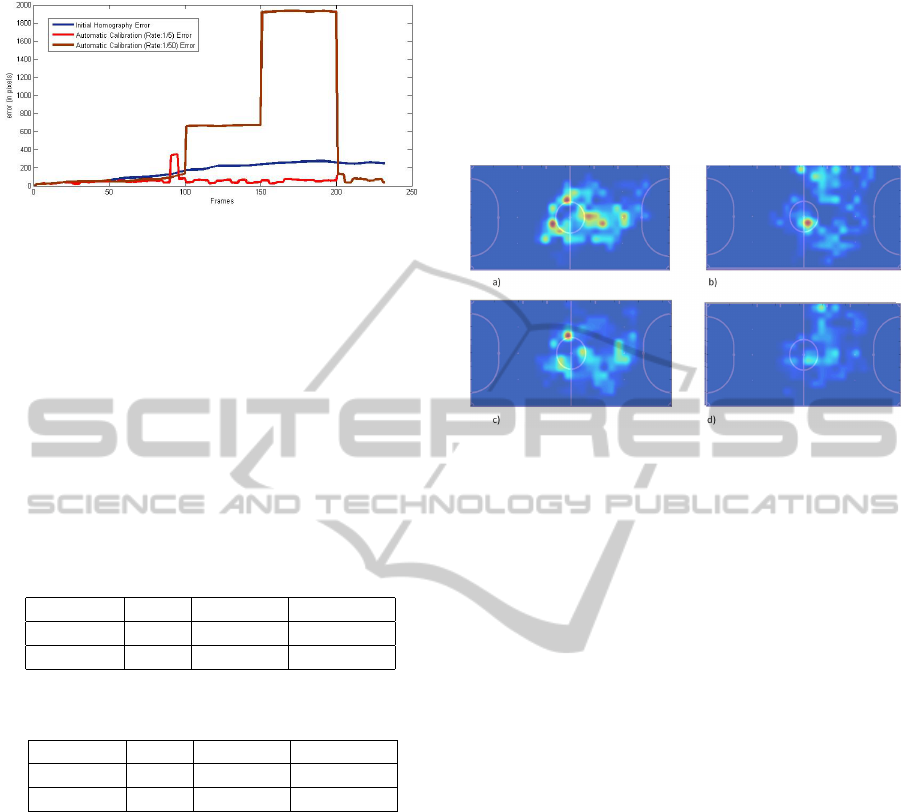
Figure 8: Error of camera calibration method with different
correction rates on sequence 1.
and 3 were used, because they were the only recorded
during match situation while the other two were shot
during warming ups.
In Table 1 and 2 are presented the results of player
detection on sequence 2 and 3 considering three dif-
ferent approaches. It is presented the raw results from
HOG detection (HOG), the results of the detector
after applying team identification and false positive
handling (HOG+TI) and finally, results of the com-
plete method based on HOG detection and mean shift
tracking (HOG+MS).
Table 1: Evolution of Player detection results through the
different stages of the method on sequence 2.
HOG HOG+TI HOG+MS
Precision 32% 85% 76%
Recall 70% 50% 72%
Table 2: Evolution of Player detection results through the
different stages of the method on sequence 3.
HOG HOG+TI HOG+MS
Precision 42% 86% 78%
Recall 72% 48% 72%
The precision of the raw detector is very low pro-
ducing too much false positives. Using information of
the players appearance is possible to eliminate part of
these bad detections. The results with false positive
handling showed a notable increase on the precision
but on the other hand the recall decreased. Finally
with mean short term tracking is possible to estimate
players position in the case of missing detections in-
creasing the recall. Otherwise, because of tracking
and the difficulty to deal with new and lost tracks the
influence of false positives will be higher and that is
the reason why precision falls.
3.4 High Level Interpretation
Evaluation
High level data interpretation is a very subjective
topic and requires highly expert knowledge about the
different aspects of the game to have an accurate eval-
uation. In this work the evaluation was based on basic
and common knowledge about indoor soccer tactical
and technical aspects.
In Figure 9 is possible to observe the results of the
occupation map.
Figure 9: Occupation map of player on sequence 2. a)
and b) relates to information extracted from ground-truth
data for each one of the teams, and c) and d) the proposed
method.
Figure 9 a) and b) illustrates occupation from
players of team 1 and 2 in the sequence 2, inferred
from ground data annotation. Figure 9 c) and d) are
the analogous for the methodology developed in this
work. In this sequence, the defending team (team 1)
were more compacted on the field while the attack-
ing one (team 2) were spread on the field exploring
the sidelines. The similarities between the proposed
method and the ground truth is notorious but it is also
possible to observe the influence of precision and re-
call of players detection method.
Figure 10 illustrates the results of offensive trend
of team 1 and team 2 generated both from the ground
truth data and the results of automatic player detection
with short term tracking.
In the beginning of the sequence, the recall and
precision are lowest, influencing the result of offen-
sive trend profile. This method lies only on partial in-
formation of players’ position. Although the obtained
result is similar to the ground truth, to achieve more
robust estimation of teams attitude during the game
it would be necessary also include information about
ball possession.
Figure 11 is presentes the evolution of the utiliza-
tion of each one of the formations during the game.
These results illustrate the relative utilization of a de-
fensive formation in smaller periods of time (in this
case around 100 frames).
The obtained results are very similar to the ground
truth, however the methodology developed is very
simple and uses just simple relations between play-
ICPRAM2015-InternationalConferenceonPatternRecognitionApplicationsandMethods
84
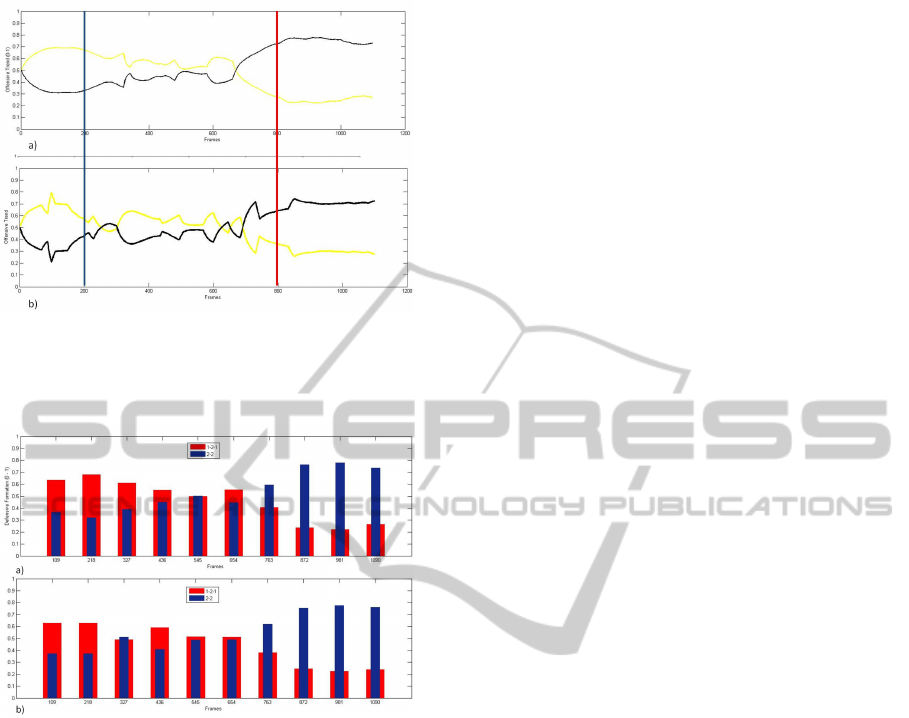
Figure 10: Result of the method to extract information on
teams attitude and offensive trend. a) Illustrate the result
for ground truth data and b) with the proposed detection
and calibration methods.
Figure 11: Evolution of the tactics counter for the sequence
2. a) Results extracted from ground truth data. b) Results
from the proposed method.
ers positions. A deeper analysis of the subject could
be performed including more types of formations and
more data as distance between players and also the
interaction of the opponent team.
4 CONCLUSIONS
In this paper we presented a new approach to auto-
matically analyze an indoor game, yielding valuable
information about individual and collective perfor-
mance. We propose to use a UAV as the video source,
facilitating the deployment of the acquisition system.
We addressed the challenges raised by the UAV dy-
namics proposing a robust pipeline of image process-
ing.
Video stabilization applied first to maintain spa-
tial coherence of pixels intensities despite the drone’s
motion. The proposed method can deal with the high-
frequency jittering of the camera but over time errors
are being accumulated and not all the movement is
properly compensated. A new camera calibration ap-
proach was proposed. It is based on detection of the
lines marked on indoor sports venues and the poste-
rior match with the lines of the virtual field. It was
proposed a methodology based on HOG people de-
tector with short term position estimation with mean
shift tracking. The algorithm shown difficulties to
deal with players entering and leaving the image since
is there non prediction of where and when a new track
must be created. Finally some methods are proposed
to extract high level information from the data corre-
sponding to players’ positions on the field.
4.1 Future Works
It was presented a set of methods to the different
stages achieving some positive preliminary results.
However, is possible to refine the results and up-
grade the functionality. Some of the future work
should include: generalize the video stabilization to
deal with both intentional and unintentional camera
movement, and without decreasing visible area over
time; increase the robustness of the camera calibration
method without needing the Hough transform that is
very expensive computationally; create of a classifier
based on HOG descriptor specialized for players’ de-
tection. By collecting a large set of positive and neg-
ative samples is possible to develop a more precise
detector turning detection easier; results of detection
must be refine using linear or nonlinear filtering such
as a particle filter.
ACKNOWLEDGEMENTS
This work is financed by the ERDF European Re-
gional Development Fund through the COMPETE
Programme (operational programme for competi-
tiveness), FCOMP-01-0124-FEDER-037281 and by
National Funds through the FCT Fundac¸
˜
ao para
a Ci
ˆ
encia e a Tecnologia (Portuguese Foundation
for Science and Technology) within project PEst-
C/EEI/LA0014/2013.
REFERENCES
Choi, E. and Lee, C. (2003). Feature extraction based
on the bhattacharyya distance. Pattern Recognition,
36(8):1703 – 1709.
VideoAnalysisinIndoorSoccerusingaQuadcopter
85

Choi, K. and Seo, Y. (2011). Automatic initialization for 3d
soccer player tracking. Pattern Recognition Letters,
32(9):1274 – 1282.
Comaniciu, D., Ramesh, V., and Meer, P. (2000). Real-
time tracking of non-rigid objects using mean shift.
In IEEE Conference on Computer Vision and Pattern
Recognition, volume 2, pages 142–149.
Dalal, N. and Triggs, B. (2005). Histograms of oriented gra-
dients for human detection. In IEEE Computer Society
Conference on Computer Vision and Pattern Recogni-
tion, volume 1, pages 886–893.
Dearden, A., Grau, O., and Demiris, Y. (2006). Tracking
football player movement from a single moving cam-
era using particle filters. IET Conference Proceedings,
pages 29–37(8).
Doucet, A. and Johansen, A. M. (2011). A tutorial on par-
ticle filtering and smoothing: fifteen years later.
Ekin, A., Tekalp, A., and Mehrotra, R. (2003). Auto-
matic soccer video analysis and summarization. IEEE
Transactions on Image Processing, 12(7):796–807.
Figueroa, P. J., Leite, N. J., and Barros, R. M. (2006). Track-
ing soccer players aiming their kinematical motion
analysis. Computer Vision and Image Understanding,
101(2):122 – 135.
Iwase, S. and Saito, H. (2004). Parallel tracking of all soccer
players by integrating detected positions in multiple
view images. In IEEE International Conference on
Pattern Recognition, pages 751–754.
Khatoonabadi, S. H. and Rahmati, M. (2009). Auto-
matic soccer players tracking in goal scenes by cam-
era motion elimination. Image and Vision Computing,
27(4):469 – 479.
Kheng, L. W. (2011). Mean shift tracking. Technical report,
Technical report, School of Computing, National Uni-
versity of Singapore.
Liu, J., Tong, X., Li, W., Wang, T., Yimin, and Wang,
H. (2009). Automatic player detection, labeling and
tracking in broadcast soccer video. Pattern Recogni-
tion Letters, 30(2):103 – 113.
Lu, W.-L., Okuma, K., and Little, J. J. (2009). Tracking and
recognizing actions of multiple hockey players using
the boosted particle filter. Image and Vision Comput-
ing, 27(12):189 – 205.
Lu, W.-L., Ting, J.-A., Little, J. J., and Murphy, K. P.
(2013a). Learning to track and identify players from
broadcast sports videos. IEEE Transactions on Pat-
tern Analysis and Machine Intelligence, 35(7):1704–
1716.
Lu, W.-L., Ting, J.-A., Little, J. J., and Murphy, K. P.
(2013b). Learning to track and identify players
from broadcast sports videos. Pattern Analysis
and Machine Intelligence, IEEE Transactions on,
35(7):1704–1716.
Munkres, J. (1957). Algorithms for the assignment and
transportation problems. Journal of the Society for
Industrial & Applied Mathematics, 5(1):32–38.
Otsu, N. (1975). A threshold selection method from gray-
level histograms. Automatica, 11(285-296):23–27.
Ren, J., Orwell, J., Jones, G. A., and Xu, M. (2009). Track-
ing the soccer ball using multiple fixed cameras. Com-
puter Vision and Image Understanding, 113(5):633 –
642.
Rosten, E. and Drummond, T. (2006). Machine learning for
high-speed corner detection. In European Conference
on Computer Vision, pages 430–443.
Santiago, C., Sousa, A., Estriga, M., Reis, L., and Lames,
M. (2010). Survey on team tracking techniques ap-
plied to sports. cited By (since 1996)1.
Shitrit, H. B., Berclaz, J., Fleuret, F., , and Fua, P. (2011).
Tracking Multiple People under Global Appearance
Constraints. International Conference on Computer
Vision.
Torr, P. H. S. and Zisserman, A. (2000). Mlesac: A new
robust estimator with application to estimating image
geometry. Computer Vision Image Understanding,
78(1):138–156.
Welch, G. and Bishop, G. (1995). An introduction to the
kalman filter.
Zhang, Z. (2000). A flexible new technique for camera cal-
ibration. Pattern Analysis and Machine Intelligence,
IEEE Transactions on, 22(11):1330–1334.
ICPRAM2015-InternationalConferenceonPatternRecognitionApplicationsandMethods
86
