
Why Robots Failed
Demonstrating the Superiority of Multiple-order Trading Agents in Experimental
Human-agent Financial Markets
Marco De Luca
Department of Computer Science, University of Bristol,
Merchant Venturers Building, Woodland Road, Bristol BS8 1UB, U.K.
Keywords:
Agent-based Computational Economics, Continuous Double Auction, Experimental Economics, Trading
Agents.
Abstract:
In the past decade there has been a rapid growth of the use of adaptive automated trading systems, commonly
referred to in the finance industry as “robot traders”: AI applications replacing highly-paid human traders in
the global financial markets. The academic roots of this industry-changing deployment of AI technologies can
be traced back to research published by a team of researchers at IBM at IJCAI 2001, which was subsequently
replicated and extended by De Luca and Cliff at IJCAI 2011 and ICAART 2011. Here, we focus on the
order management policy enforced by Open Exchange (OpEx), the open source algorithmic trading system
designed by De Luca, for both human and robot traders: while humans are allowed to manage multiple orders
simultaneously, robots only deal with one order at the time. We hypothesise that such unbalance may have
strongly influenced the victory of human traders over robot traders, reported in past studies by De Luca et
al., and by Cartlidge and Cliff. We employed OpEx to implement a multiple-order policy for robots as well
as humans, and ran several human vs. robot trading experiments. Using aggregated market metrics and
time analysis, we reached two important conclusions. First, we demonstrated that, in mixed human-robot
markets, robots dealing multiple simultaneous orders consistently outperform robots dealing one order at a
time. And second, we showed that while human traders outperform single-order robot traders under specific
circumstances, multiple-order robot traders are never outperformed by human traders. We thus conclude
that the performance of robot traders in a human-robot mixed market is strongly influenced by the order
management policy they employ.
1 INTRODUCTION
At IJCAI 2001 (Das et al., 2001), a team of re-
searchers from IBM demonstrated that software au-
tomated trading agents could consistently outperform
human traders in a real-time asynchronous continuous
double auction (CDA) market.
The CDA is the market mechanism widely
adopted by the majority of modern financial elec-
tronic exchanges; in a CDA, traders can asyn-
chronously post bids and offers that are usually pub-
licly visible by every other trader, and a trade is made
whenever the outstanding bid price is greater than or
equal to the outstanding ask price.
Relevant to real world financial markets, IBM’s
stunning results triggered worldwide media coverage
and in the 13 years since then, such automated trad-
ing systems have become commonplace in the world’s
major financial markets, where they are colloquially
known as “trading robots” or “robot traders”.
At ICAART 2011 (De Luca and Cliff, 2011a) and
IJCAI 2011 (De Luca and Cliff, 2011b) De Luca and
Cliff replicated and extended IBM’s results for the
first time since they were presented in 2001: they
found that Vytelingum’s “Adaptive Aggressive” (AA)
trading robot (Vytelingum et al., 2008; Vytelingum,
2006) dominated both Cliff’s “Zero Intelligence Plus”
(ZIP) (Cliff, 1996), and IBM’s GDX, designed by
Tesauro and Bredin (Tesauro and Bredin, 2002);
and they confirmed that the three robot traders, AA,
GDX and ZIP, perform consistently better than human
agents.
The human vs. robot experiments conducted by
De Luca and Cliff adopt a methodology that resem-
bles closely the one described in the IBM study.
An asynchronous real-time electronic trading system
44
De Luca M..
Why Robots Failed - Demonstrating the Superiority of Multiple-order Trading Agents in Experimental Human-agent Financial Markets.
DOI: 10.5220/0005203100440053
In Proceedings of the International Conference on Agents and Artificial Intelligence (ICAART-2015), pages 44-53
ISBN: 978-989-758-073-4
Copyright
c
2015 SCITEPRESS (Science and Technology Publications, Lda.)

featuring a centralised exchange and remote graph-
ical trading terminals was employed. Each experi-
ment had a fixed duration, and pitted 6 robot traders
against 6 human traders; both robots and humans
were equally split into 3 buyers and 3 sellers. Ex-
periments simulated sales trading: real world sales
traders aim at maximising their own profit, which is
the sum of the commission they charge their clients
for every sale or purchase they execute, on their be-
half, of a specific amount of a certain commodity
at a given price. In the simulated sales trading ses-
sions, a definite part of the automated experimental
economics system simulated the agents’ clients, and
communicated to the agents (both human and robot)
the clients’ will of buying or selling the virtual com-
modity, and the numeric values of quantity and price;
De Luca and Cliff refer to such instructions as assign-
ments, and to the predetermined sequence of assign-
ments distributed to each agent in the course of an
experiment as the schedule of that agent. At the start
of the experiment, the system released the first assign-
ment in the agent’s schedule; the agent will start trad-
ing such assignment; when (and if) the assignment is
traded, the system distributes the second assignment
to the agent, and so on, until there are no more as-
signments left for that agent, or the experiment time
is up.
De Luca et al. (De Luca et al., 2011) subsequently
ran further human vs. robot (ZIP, AA) experiments on
a more realistic market previously explored by Cliff
and Preist (Cliff and Preist, 2001): in it, the sched-
ule of each agent still consisted of a fixed number of
clients’ instructions, but the instructions were period-
ically released at predetermined times, until the mar-
ket simulator was stopped. To use Cliff and Preist’s
nomenclature, we will call such timed instructions
permits, and we will refer to markets operating on
a permit schedule as continuous-replenishment, or
simply continuous markets. Crucially, unlike assign-
ments, permits are released regardless of whether or
not the agent has finished trading the previous per-
mit: they are triggered solely by time. Yet, the re-
sults De Luca et al. found were strongly contrasting
with those obtained previously: indeed, humans out-
performed robots in the continuous market simulated
in (De Luca et al., 2011), although the victory was not
as manifest as that shown in (Das et al., 2001).
The finding of such a trading performance unbal-
ance in favour of humans was as controversial as un-
expected: first, because the preceding two human vs.
robot trading agents studies showed the undisputed
victory of robots; second, because with the realism
added by the novel continuous-replenishment mech-
anism, one would anticipate a scenario closer to the
real-world, where the use of automated traders is wide
spread because of their excellent performance; and
third, because, based on common sense, one would
generally expect machines to be better than humans
at numerical tasks such as trading.
The matter was later studied by Cartlidge and Cliff
(Cartlidge and Cliff, 2012; Cartlidge and Cliff, 2013),
who confirmed that, in a market continuously replen-
ished of currency and stock, human traders perform
better than robot traders (AA).
Also, Cartlidge and Cliff revealed an undesired
behaviour in OpEx’s AA implementation, for which
AA robot buyers (sellers) would systematically trade
with the seller (buyer) offering (bidding) the best
price, whenever the difference between the two out-
standing bid and ask prices, divided by the mean of
the two outstanding prices, dropped below a fixed
threshold. In this context, it is useful to recall that
in a CDA the outstanding bid price and ask price are
often referred to as best bid and best ask; the differ-
ence between the best ask and the best bid is what is
commonly called spread; and we refer to the spread
divided by the mean of the best prices as relative
spread. AA’s behaviour is then usually referred to as
crossing the spread or jumping the spread.
Thus, in further experiments, Cartlidge and Cliff
pitted human traders against robot traders implement-
ing a revised version of the AA strategy: one that
was free of the unwanted spread-jumping behaviour
1
.
They found that, under those conditions, robots per-
formed better than humans, thus concluded that the
spread-jumping bug caused the robot traders to per-
form worse, both in their experiments, and in De Luca
et al.’s previous work (De Luca et al., 2011). Indeed,
the reassuring victory of robot traders over human
traders that they obtained in their experiments was the
most recent finding on mixed human/robot agents ex-
perimental financial markets at the time we wrote this
paper.
We have seen how, in continuous markets, all
players receive permits to buy or sell continuously
throughout the simulation. We will call orders the
instructions sent by the trading agents (human and
robot) to the market; agents send orders to the market
to trade the permits they receive from their clients: a
new order is first sent to the market, and can then be
amended (i.e. its quantity and price can be modified),
or canceled (i.e., removed from the market). Here, we
1
In reality, the AA strategy would still jump the spread
methodically, but the minimum value of the relative spread
that triggered the aggressive behaviour had been reduced
considerably, with respect to the value previously used. For
more details on the spread-crossing behaviour of the AA
robot, refer to section 3.
WhyRobotsFailed-DemonstratingtheSuperiorityofMultiple-orderTradingAgentsinExperimentalHuman-agent
FinancialMarkets
45

focus on the order management policy robots and hu-
mans adopt within the continuous replenishment mar-
ket paradigm: while permits are distributed to them
in the same way, humans and robots manage their or-
ders differently. Humans employ the cash and stock
received through permits to send orders to the mar-
ket without further restrictions: noticeably, humans
can send a new order even though orders that they
previously sent are still open, that is, not completely
traded; in particular, human traders can keep mul-
tiple (open) orders on the market at the same time.
Robots, instead, process one order at a time: they
only send a new order to the market upon either suc-
cessful completion or intentional cancellation of the
previous order they sent. Therefore robots manage (at
most) one order at a time, whereas humans can (and
do) keep several orders simultaneously. We will re-
fer to the former order management policy as “single-
order”, and to the latter as “multiple-order”. Also,
for shortness, we will thereafter refer to robots em-
ploying a single-order policy as “single-order robots”,
and to robots employing a multiple-order policy as
“multiple-order robots”.
Our intuition is that the enforcement of the single-
order policy deteriorates the performance of robot
traders; we believe that this holds independently from
the particular trading strategy robots implement. In-
spired by that, we used OpEx to explore how chang-
ing the robots’ order management policy from single-
order to multiple-order affected their performance.
We studied the effect of changing from single-order
to multiple order in two experiment conditions: one
where the AA spread-jumping behaviour was unde-
sirably strong (i.e., within 15%, as in (De Luca et al.,
2011)) and the other where the spread-jumping be-
haviour was much weaker at 1%, as originally in-
tended (as in (Cartlidge and Cliff, 2013)).
The next section explains the basic features of
CDA-based markets and defines the metrics we will
use to compute the performance of the traders, in
order to determine the outcome of our experiments.
Section 3 describes the changes we made to the ex-
perimental conditions used in previous studies, to im-
plement the multiple-order policy for the robots. We
report the results we obtained in our simulations in
section 4 and we discuss them in section 5; finally,
we present our conclusions in section 6.
2 BACKGROUND
Vernon Smith’s Nobel-prize-winning experimental
work (Smith, 1962) demonstrated that a CDA-based
market made up of human traders can reach close-to-
optimal efficiency. Furthermore, Smith proved that
the competitive market dynamics will cause the con-
vergence of the transaction prices towards the theo-
retical market equilibrium price p
∗
. In his seminal
study, Smith distributed one unit to sell (buy) at no
less (more) than a specific price to each trader; such
price is known as cost price c of a seller, or limit price
l of a buyer. If p is the price of a specific transaction,
the profit made by the buyer is thus l − p, while the
profit made by the seller is p − c.
Formally, let I be the set of buyers and J the set
of sellers in the market. Let L
i
= {l
i,1
, l
i,2
, . . . , l
i,N
i
} be
the set of limit prices of the N
i
units owned by buyer
i, and C
i
= {c
j,1
, c
j,2
, . . . , c
j,M
j
} the set of cost prices
of the C
j
units owned by seller j. The market equilib-
rium price is given by:
p
∗
= argmax
p
(
∑
i∈I
N
i
∑
n=1
max(0, l
i,n
− p)
+
∑
j∈J
M
j
∑
m=1
max(0, p − c
j,m
)
)
(1)
To compare the performance of the traders, Smith
measured their allocative efficiency, which is the total
profit earned by the trader divided by the maximum
theoretical profit of that trader, expressed as a per-
centage.
Defined as the profit that a trader could have made
if all the market participants would have traded their
(tradable) units at price p
∗
, the maximum theoretical
profit π
∗
i
of buyer b
i
is given by:
π
∗
i
=
N
i
∑
n=1
max(0, l
i,n
− p
∗
) (2)
Denoting with p
i,n
the price at which buyer i ac-
tually trades the unit with limit price l
i,n
, the actual
profit π
i
earned by buyer i is:
π
i
=
N
i
∑
n=1
max(0, l
i,n
− p
i,n
) (3)
Therefore, the allocative efficiency E
i
of buyer i
is:
E
i
=
π
i
π
∗
i
(4)
The allocative efficiency of a group of N traders is
thus:
E =
1
N
N
∑
j=1
π
j
π
∗
j
(5)
Equations 5 and 4 also hold for sellers; however,
the formula of the profit of a seller must be used in-
stead of that of the profit of a buyer in Equation 2
and Equation 3, in order to evaluate the allocative ef-
ficiency of sellers.
ICAART2015-InternationalConferenceonAgentsandArtificialIntelligence
46

In this work, we will also use the following met-
rics to establish the performance of a market in terms
of how far from the theoretical equilibrium it trades.
Used to calculate the difference between the total
profit made by two groups, X and Y , divided by the
mean of those two profits, delta profit is defined as:
∆P(X −Y ) =
2(π
X
− π
Y
)
π
X
+ π
Y
(6)
The delta profit of an ideal market, where the two
groups match identically, should be zero.
Smith’s alpha (Vernon Smith, (Smith, 1962)) cap-
tures the standard deviation of trade prices about the
theoretical equilibrium price; lower values of α are
desirable, indicating trading around p
∗
. In the follow-
ing definition, we also normalise α by p
∗
, and express
its value as a percentage by multiplying by 100:
α =
100
p
∗
s
1
N
N
∑
i=1
(p
i
− p
∗
)
2
(7)
A measure of how the profit generated by each
trader in a group differs from the value it would be
expected of them if all transactions took place at the
equilibrium price p
∗
, is the profit dispersion. For a
group of N traders, profit dispersion is calculated as
the root mean square difference between the profit
achieved π
i
by each trader, i, and the maximum theo-
retical profit available to that trader, π
∗
:
π
disp
=
s
1
N
N
∑
i=1
(π
i
− π
∗
)
2
(8)
3 EXPERIMENT
METHODOLOGY
3.1 OpEx
We ran our human vs. robot experiments on Open
Exchange (OpEx). OpEx is the open source algorith-
mic trading system developed in 2009-2010 by Marco
De Luca at University of Bristol. Since there was no
de facto standard experimental economics platform
to simulate human-agent asynchronous CDA markets
when he started his doctoral research in 2009, De
Luca created OpEx to offer a free, open source so-
lution. Since its inception, and excluding this study,
OpEx has hosted over 70 human-agent trading ses-
sions, which were the empirical basis for six peer-
reviewed publications (De Luca and Cliff, 2011a; De
Luca and Cliff, 2011b; De Luca et al., 2011; Cartlidge
et al., 2012; Cartlidge and Cliff, 2012; Cartlidge and
Cliff, 2013). OpEx is available for download from
Sourceforge (De Luca, 2012); on 10 November 2014,
OpEx had been downloaded 935 times since it was
first distributed in February 2012. A complete de-
scription of OpEx can be found in (De Luca et al.,
2011).
3.2 Experiment Design
We used OpEx to perform a total of 24 human vs.
robot trading experiments that took place from Mon-
day 3rd to Thursday 6th February 2014, at Algo-
rithmic Trading Consulting’s premises in Boadilla
del Monte, Madrid, Spain. All human participants
were registered full-time undergraduate economics
students at several universities
2
in Spain; none of
the subjects had previous (professional) experience in
electronic trading.
Each experiment involved 6 human traders and 6
robot traders, both equally divided into 3 buyers and
3 sellers. We split the 24 participants into 4 groups
of six; we then used each of those groups in an ex-
perimental session consisting of six consecutive but
distinct experiments: this way, we were able to run 24
experiments using only 24 participants.
The premises were laid out so that human partic-
ipants would sit at the two long sides of a large con-
ference room table, three by each side. Each of the
seats was set up with a netbook displaying the OpEx
GUI; an external mouse and numerical keypad were
plugged to the netbook for convenience. Each net-
book corresponded to a specific market role: the three
netbooks on one side to Buyer1, Buyer2, Buyer3; and
the three netbooks on the opposite side to Seller1,
Seller2, Seller3 (in this order). The experiment ad-
ministrator would sit at one of the short ends of the
table and use a laptop to control and supervise both
the market and the experiment.
At the start of each session humans were randomly
allocated to a seat (market role); the subjects were
briefed about the rules of the experiment; and they
were given some time to familiarise with the OpEx
GUI. During the tutorial robot traders were switched
off, thus allowing human participants to trade among
themselves and get accustomed to the market. Brief-
ing and tutorial took about 10 minutes.
Then the actual experiment was run for six times
in a row, each one lasting 10 minutes. At the end
of each run, and before the following one, we intro-
duced a 2 minutes break during which the adminis-
trator could set the new experimental configuration,
and the participants rotated seats anti-clockwise
3
thus
2
Universidad Complutense de Madrid. Universidad
Carlos III de Madrid. Univeridad Rey Juan Carlos.
3
We purposely mixed human roles between experi-
WhyRobotsFailed-DemonstratingtheSuperiorityofMultiple-orderTradingAgentsinExperimentalHuman-agent
FinancialMarkets
47
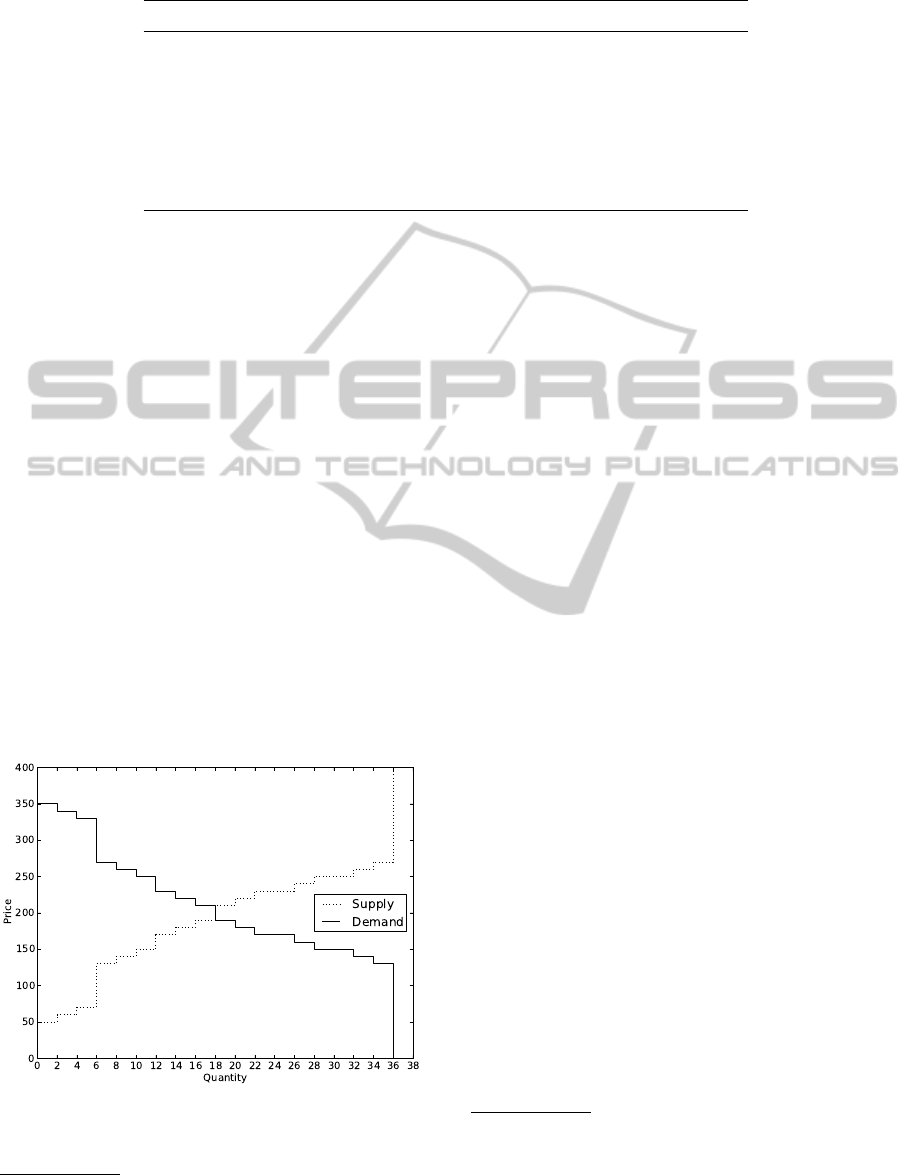
Table 1: Permit schedule employed in the 24 simulations.
1 2 3 4 5 6
Buyer1 350 (0) 250 (5) 220 (7) 190 (9) 150 (14) 140 (16)
Buyer2 340 (1) 270 (3) 210 (8) 180 (10) 170 (12) 130 (17)
Buyer3 330 (2) 260 (4) 230 (6) 170 (11) 160 (13) 150 (15)
Seller1 50 (0) 150 (5) 180 (7) 210 (9) 250 (14) 260 (16)
Seller2 60 (1) 130 (3) 190 (8) 220 (10) 230 (12) 270 (17)
Seller3 70 (2) 140 (4) 170 (6) 230 (11) 240 (13) 250 (15)
playing a different market role each time. Overall, an
experimental session lasted less than 90 minutes, with
60 minutes of experiment time.
Finally, we motivated all participants by paying
each of them e25, plus, to incentivise traders to make
profit, the human trader scoring the highest alloca-
tive efficiency (as defined in Section 2, Equation 4)
on each experimental session was rewarded with an
additional e250 prize. Since one prize was given at
the end of each experimental session, and the human
participants to each session were 6, participants had a
1-in-6 chance of winning the prize. The total cost of
the experiments was e25*24 + e250*4 = e1600.
3.3 Supply and Demand
We employed the schedule of permits used in (De
Luca et al., 2011; Cartlidge et al., 2012). The limit
prices are shown in Table 1, arranged by trader and
permit type; the time step at which each permit is sent
is shown in brackets. Figure 1 displays the supply and
demand curves that originate from such schedule.
Figure 1: Supply and demand.
ments, to reduce the opportunity for collusion and coun-
teract any bias in market role.
3.4 Robot Configuration
In (Cartlidge and Cliff, 2012), Cartlidge and Cliff
noted that the implementation of AA found in version
1.0 of OpEx displayed an undesired behaviour, not
documented in Vytelingum’s original description of
the trading strategy (Vytelingum, 2006; Vytelingum
et al., 2008), for which the robot would cross the
spread every time its relative value fell below a pre-
determined percentage threshold. While they re-
ported that the idea of systematically crossing the
spread can be reasonable and beneficial to conver-
gence, Cartlidge and Cliff pointed out that the fixed
value of 0.15 (i.e., 15%) used for the threshold was
much too high
4
. Indeed, they demonstrated that when
the threshold was set to the 1% value originally spec-
ified by Vytelingum (Vytelingum, 2006), robots out-
performed human traders, but when the threshold was
set to 15% the humans outperformed the robots. In-
spired by their results, in this work we will experiment
with both settings of the threshold: 1%, and 15%.
3.5 Order Management Policies
We have seen in Section 1 how permits are the in-
structions sent by (simulated) clients to agents, while
orders are the instructions that agents send to the mar-
ket. The relationship between permits and orders is
not necessarily one to one. In fact, importantly, one
permit for one unit can give origin to many orders.
This is possible because orders can be cancelled: once
an order for one unit has been cancelled, that unit is
no longer advertised on the market, therefore a new
order can (and should) be sent to the market, to newly
implement the client’s instruction. Once a unit has
been received by a trader as a permit, we will refer to
the process of sending, amending, and cancelling or-
4
Contextually, De Luca was informed of the bug, and
released a new version of OpEx in which the value of the
threshold that triggered spread-crossing was configurable.
The new version, OpEx 1.1, was released on 25 March
2012.
ICAART2015-InternationalConferenceonAgentsandArtificialIntelligence
48

ders that the trader executes in order to trade that unit,
as working that permit.
The order management policy to apply for hu-
mans and robots was a design choice that was faced
when permits were distributed on a periodic regular
schedule (continuous market, as studied in (Cliff and
Preist, 2001; De Luca et al., 2011; Cartlidge et al.,
2012; Cartlidge and Cliff, 2012; Cartlidge and Cliff,
2013)), rather than sequentially and only upon com-
pletion of the preceding one (cyclical market, as stud-
ied in (Das et al., 2001; De Luca and Cliff, 2011a; De
Luca and Cliff, 2011b)). By order management pol-
icy, we mean the set of rules that apply to a group of
traders for what concerns the creation and handling of
orders.
We say that a group of traders follows a multiple-
order policy, if an order for one unit with a certain
limit price l can be sent to the market, provided that
a permit for one unit with limit price l has been re-
ceived, and no further orders are on the market for
that particular unit. In particular, this allows a trader
to submit a new order for a new unit even though an
order of hers for a previously received unit was still
on the market.
Instead, the following applies to traders following
a single-order policy:
1. when a new permit is received:
(a) if the trader is not working any permit, then the
trader will immediately start working the new
permit;
(b) if the trader is working a more profitable permit
than the newly arrived, then the trader will ig-
nore the newly arrived permit and push it to the
“deferred permits queue”;
(c) if the trader is working a less profitable permit
than the newly arrived, then the trader will can-
cel the current order, push the associated permit
to the “deferred permits queue”, and start work-
ing the newly arrived permit;
2. when a trader completes the order related to the
current permit:
(a) if the “deferred permits queue” is not empty, the
trader retrieves the most profitable permit from
it, and starts working it;
(b) if the “deferred permits queue” is empty, the
trader does nothing.
In order to change the order management policy
implemented by OpEx robots from single-order to
multiple-order, we leveraged the existing infrastruc-
ture and implemented the following multiple-order
policy (similar rules apply to sellers):
1. when a new permit to buy at limit price l is re-
ceived by a trader:
(a) if the trader is not working any permits at limit
price l, then the trader will send a new order
with limit price l;
(b) if the trader is already working permits at limit
price l, then the trader will amend the existing
order at limit price l to include the quantity just
requested in the last permit;
2. when a trader completes the order related to the
current permit, the trader becomes idle and waits
to receive the next permit.
4 EXPERIMENTAL RESULTS
In this paper, we tested both the single-order and the
multiple-order policy across 24 simulations: 12 sim-
ulations for each policy. And for each of the two
policies, we explored the effects of two values of the
minimum relative spread threshold crossed by the AA
trading strategy: 15%, and 1%. We will refer to this
threshold as MaxSpread, after the name of the OpEx
variable that represents it.
We tested the four resulting combinations in four
sets of six 10 minutes’ simulations.
We will first focus on the group efficiency of
robots and humans, as defined by Equation 5: Table 2
summarises the results we obtained under the four dif-
ferent experimental conditions employed. Each cell
in the table represents an experiment and contains: the
symbolic name we gave to the experiment; an indica-
tion of the allocative efficiency of the robots, com-
pared to that of the humans; and the level of signif-
icance of the result, according to Fligner and Polli-
cello’s robust rank order (RRO) test
5
.
Table 2: Group allocative efficiency of robots and humans
compared.
MaxSpread=15% MaxSpread=1%
M
MP15
R = H
p > 10.4%
MP01
R > H
1.1% < p < 2.2%
S
SP15
H > R
0.11% < p < 0.54%
SP01
R > H
5.1% < p < 10.4%
5
Fligner and Pollicello first reported on the robust rank
order (RRO) test in 1981 (Fligner and Pollicello, 1981). The
RRO test is a non-parametric test of difference in medians,
which Feltovich showed in (Feltovich, 2003) to apply well
to the domain of small sample statistics (in which we defi-
nitely are), and to perform better than the more commonly-
used Wilcoxon-Mann-Whitney ’U’ test.
WhyRobotsFailed-DemonstratingtheSuperiorityofMultiple-orderTradingAgentsinExperimentalHuman-agent
FinancialMarkets
49

The bottom section of the table shows that,
if robots enforce a single-order policy: when
MaxSpread=1%, robots outperform humans (experi-
ment SP01, R > H); and when MaxSpread=15%, hu-
mans outperform robots (experiment SP15, H > R).
The results of the RRO test to the raw group alloca-
tive efficiency data of robots and humans in the two
experiments show that: in experiment SP01 the differ-
ence between the two group efficiencies is significant
at the 10.4% level (that is, 5.1% < p < 10.4%); and
in experiment SP15 the difference is significant at the
0.54% level (0.11% < p < 0.54%).
Our novel findings resulting from using a
multiple-order policy for the robots are shown in
the top row of Table 2. In experiment MP01, with
MaxSpread=1%, robots outperform humans with a
level of significance of 2.2% (1.1% < p < 2.2%); and
in experiment MP15, with MaxSpread set to 15%,
the difference between the efficiency of robots and
humans is not significant at 10.4% or less (i.e., p >
0.104).
Moreover, we compared the performance of
robots in all experiments employing a multiple-order
policy (MP01 and MP15) to that of their single-order
policy counterpart (SP01 and SP15). The RRO test
showed that the first group performed better than
the second group with a level of significance of 1%
(0.5% < p < 1%).
To extract further comparative information related
to the performance of robots conditional to the four
experimental conditions, we isolated the raw data of
the group allocative efficiency of robots in our four
experiments, and thus applied the RRO test to the two
series of 6 points (one per each 10-minutes simula-
tion in the 60 minutes experiment) identified by each
pair of adjacent cells in Table 2. Table 3 contains the
results.
The two groups of robots under comparison are la-
belled R1 and R2. For each of the four comparisons,
the table shows: the experimental conditions under
which each of the two groups of robots traded and the
significance level according to the RRO test. The ex-
perimental conditions include the name of the experi-
ment, the order-management policy, and the value of
MaxSpread. The robots in the group labelled R1 are
those with the resulting higher group efficiency, as de-
fined in Equation 5.
Looking at market efficiency, that is the group al-
locative efficiency of all traders, the ranking of the
most efficient markets is MP01, MP15, SP01 and
SP15 in this order, displaying efficiencies of 0.818,
0.785, 0.780 and 0.773 respectively. Further, for each
experiment we calculated the delta profit between the
two groups, robots and humans (as per Equation 6);
Table 3: Group allocative efficiency of robots compared
across different experimental conditions.
R1 R2 RRO
MP01
Multiple
1%
SP01
Single
1%
0.54% < p < 1.1%
MP01
Multiple
1%
MP15
Multiple
15%
0.11% < p < 0.54%
SP01
Single
1%
SP15
Single
15%
0.11% < p < 0.54%
MP15
Multiple
15%
SP15
Single
15%
0.11% < p < 0.54%
Table 4: Aggregated market statistics. For each experiment,
the table shows: market efficiency; relative profit difference
between robots and humans; profit dispersion; and Smith’s
α.
Experiment E ∆P π
disp
α
MP01 0.818 3.6% 901 9.3%
MP15 0.785 -1.8% 1079 12.7%
SP01 0.780 3.4% 1155 17.3%
SP15 0.773 -18.4% 1206 6.4%
the profit dispersion, shown in Equation 8; and finally
Smith’s alpha (Equation 7). Table 4 summarises our
findings with respect to such statistics.
While the metrics employed so far explain mea-
surements that apply to the experiment as a whole,
we introduce here a novel analysis that reveals com-
ponents of the human-agent interaction that are re-
lated to time. In the course of the simulations, per-
mits are regularly distributed to the traders, following
the schedule in Table 1. Once a permit has been dis-
tributed to a trader (either human or robot), the trader
decides how to employ that permit, compatibly with
the order-management policy that is being enforced.
Thus, considering both the present market conditions
and the past evolution, the trader decides whether to
send an order immediately, or delay execution of the
order until he estimates there are better market con-
ditions to send the order. The order, in turn, may im-
mediately fill if it’s an aggressive order, or it may sit
in the order book, perhaps its price may be modified
a few times, and then it may eventually fill.
By scanning the time series of order instructions
ICAART2015-InternationalConferenceonAgentsandArtificialIntelligence
50

stored OpEx’s database with sub-second time resolu-
tion, we analysed the Time-To-Complete of the per-
mits, defined as the time elapsed from the moment a
permit is received by a trader, to the moment the order
that trader sent to work that permit fills. After mea-
suring this time for all trades, we grouped the results
by trader group, human or robot, and subsequently
by profitability of the permit, intra-marginal or extra-
marginal. We thus obtained, for each of our exper-
iments, four populations of Time-To-Complete. Ta-
ble 5 shows the median of each of the four populations
in the different experiments; we labelled each popu-
lation so that, for example, R-IM stands for “robots,
intra-marginal permits”, and H-EM stands for “hu-
mans, extra-marginal permits”.
Table 5: Time-To-Complete for each experiment. The table
shows the median (in seconds) of the Time-To-Complete of
intra-marginal and extra-marginal permits, for both human
and robot traders.
Experiment R-IM H-IM R-EM H-EM
MP01 0.8 20 119 325
MP15 0.1 10 106 125
SP01 1.7 12 112 140
SP15 0.3 20 110 135
5 DISCUSSION
The results in the bottom line of Table 2 agree with the
findings presented in (De Luca et al., 2011; Cartlidge
and Cliff, 2012; Cartlidge and Cliff, 2013), that is:
if the order-management policy enforced by robots is
single-order, humans perform better than robots when
MaxSpread is 15%, while robots outperform humans
when MaxSpread is 1%. The innovative multiple-
order policy we employed for robots revealed the re-
sults displayed in the top row of the table. When
MaxSpread is 1%, switching from single-order to
multiple-order still reveals a victory of robots: we
found that the RRO test gives a stricter result for
MP01 than it does for SP01, and we interpret this find-
ing as the fact that the switch to a multiple-order pol-
icy benefited the robots, as a group. We found though
that there is no statistically significant difference be-
tween the efficiency of robots and humans in experi-
ment MP15; by visually inspecting Table 2, we notice
that, when MaxSpread is 15%, switching from single-
order to multiple-order turns the distinct victory of
humans in experiment SP15, into what the RRO test
signalled as an indecisive case. However, the com-
parison of all the results obtained for multiple-order
robots with those obtained for single-order robots in-
dicate a sharp result (RRO 0.5% < p < 1%): multiple-
order robots perform better than single-order robots,
regardless of whether MaxSpread is 15% or 1%.
We then studied the relationship that holds be-
tween the efficiency of robots across our experiments
(see Table 3), and found that indeed the effects of
switching the robots policy to multiple-order are ex-
plained. All the RRO test results have a level of sig-
nificance of p=0.54%, except for MP01 vs. SP01
which has a level of significance of p=1.1%: overall,
very sharp results. In detail:
• the performance of robots was significantly bet-
ter in MP01 than it was in SP01: this confirms
our previous interpretation of the different level
of significance in the two cases;
• robots employing a multiple-order policy perform
better when MaxSpread=1% (MP01) than when
MaxSpread=15% (MP15);
• even though MaxSpread is 15% (that is, AA is
crossing the spread excessively), switching to a
multiple-order policy benefits the performance of
robots, declaring their efficiency significantly bet-
ter at the 0.54% level;
• finally, we confirmed that robots that em-
ploy a single-order policy perform better when
MaxSpread is 1% (SP01 vs. SP15).
Furthermore, we interpreted the metrics sum-
marised in Table 4 as follows. Sorting the experi-
ments by descending value of market efficiency, is in-
deed equivalent to sorting them by ascending value of
profit dispersion
6
, and result into the sequence MP01,
MP15, SP01, SP15. In both cases, the indication
is that markets where the multiple-order policy is in
place are better.
The ranking deriving from Smith’s α still places
MP01 and MP15 before SP01, but it puts SP15 in
the first place; to explain this, we speculate that the
combination of less simultaneous orders by robots,
and AA aggressively accepting more offers, made the
trade price time series more stable around p
∗
in SP15.
The values of ∆P are mixed; however, qualita-
tively, we can see how the magnitude of ∆P is much
higher in SP15, than it is in every other experiment.
In particular, we point out how the absolute value of
∆P in MP15 is about one tenth of the value in SP15:
we interpret this as a further confirmation that switch-
ing to a multiple-order policy boosts the quality of the
market.
6
Higher values of market efficiency, and lower values of
profit dispersion are better.
WhyRobotsFailed-DemonstratingtheSuperiorityofMultiple-orderTradingAgentsinExperimentalHuman-agent
FinancialMarkets
51
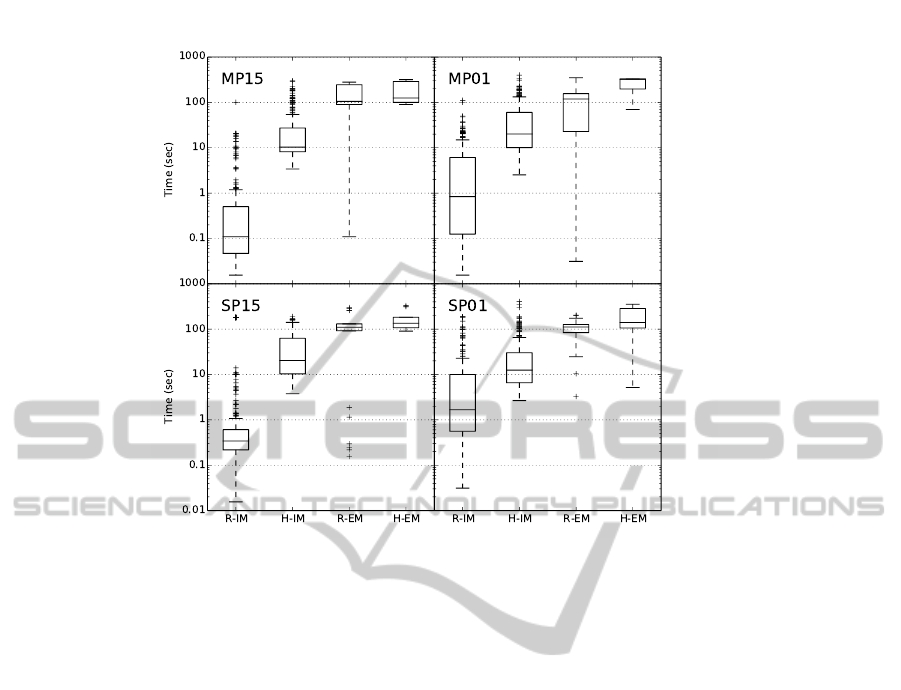
Figure 2: Box plot of Time-To-Complete. The charts of the four sets of experiments MP15, MP01, SP15, SP01 are displayed
in the sub-figures, respectively from left to right, and from top to bottom. The time axis is logarithmic.
Figure 2 offers a graphical representation of our
time analysis, in the form of a box plot. The bot-
tom, middle, and top of the box are respectively the
first, second (median) and third quartiles of each set
of data. The whiskers of the plot extend to the low-
est datum still within 1.5 IQR of the lower quartile,
and the highest datum still within 1.5 IQR of the up-
per quartile; by IQR we mean the interquartile range,
that is the difference between the third and the first
quartile.
We will mainly focus on the statistics of Time-
To-Complete for the group R-IM: that is, the val-
ues we collected for the intra-marginal permits traded
by robots in each experiment. With MaxSpread=1%,
switching the policy to multiple-order consistently re-
duces the values of first, second and third quartiles
(SP01 vs. MP01); the same effect applies to SP15
vs. MP15. In practise, this means that the robots
of MP01 and MP15 send to the market orders that
take less time to complete than their counterparts of
SP01 and SP15, respectively. Together with the re-
sults we found for the group allocative efficiency, this
evidences the superior pricing employed by the robots
that manage multiple orders simultaneously. Once
again, this illustrates how adopting a multiple-order
policy is beneficial in both cases: MaxSpread=1%,
and MaxSpread=15%.
6 CONCLUSIONS
We resumed the investigation on human vs. robot ex-
perimental trading simulations from the last major
finding published by Cartlidge and Cliff (Cartlidge
and Cliff, 2012; Cartlidge and Cliff, 2013): lower
values of the minimum relative spread to cross
(MaxSpread) result in better group allocative effi-
ciency for AA robots.
We introduced a new dimension in the analysis,
time to complete, that is orthogonal to the one defined
by MaxSpread; and we generated data in the newly
defined 2-dimensional space of experimental condi-
tions. We evaluated the resulting markets using both
aggregated metrics (i.e. allocative efficiency, group
efficiency, Smith’s α, delta profit, profit dispersion),
and time analysis.
First, we proved that we could successfully repro-
duce Cartlidge and Cliff’s results.
Second, we demonstrated that robots that manage
simultaneous multiple orders display a superior per-
formance to that of robots that manage one order at
a time, separately in the two cases: MaxSpread=1%,
and MaxSpread=15%.
Third, we extended our comparison across the
MaxSpread axis and proved that the superiority of
multiple-order policy on single-order policy holds re-
ICAART2015-InternationalConferenceonAgentsandArtificialIntelligence
52

gardless of the value of MaxSpread. This is a strong
result: prior to this study, to the best of our knowl-
edge, the only explanation given to the supremacy
of humans over robots reported in (De Luca et al.,
2011) was that found by Cartlidge and Cliff (Cartlidge
and Cliff, 2012), claiming that this phenomenon was
due to a malfunctioning of the AA robots. Indeed,
here we proved that multiple-order robots outperform
single-order robots. Therefore, the poor performance
of robots in (De Luca et al., 2011) may as well be
explained by the disadvantage that robots employing
a single-order policy have, when they challenge hu-
mans allowed to deal multiple simultaneous orders.
Finally, presuming that no commercial algorithm
would manage only one order at a time, we argue that
we moved a step towards a more realistic model of
sales-trading behaviour in real-world financial mar-
kets.
ACKNOWLEDGEMENTS
We are indebted to Dave Cliff for his many help-
ful suggestions on the style and the structure of this
paper. Marco De Luca’s PhD research was par-
tially supported by funds from the University of
Bristol Merchant Venturers’ School of Engineering.
Equipment costs for constructing De Luca’s Open
Exchange (OpEx) system were met by a research
grant from EPSRC made to Dave Cliff, number
EP/I001603/1. Thanks to Algorithmic Trading Con-
sulting, S.L. (http://www.algotradingconsulting.com)
for funding the rewards we used as incentives in
our experiments, financing the registration costs to
ICAART 2015, and providing the venues where the
experiments were run. We are very grateful to all
the participants to our experiments at Algorithmic
Trading Consulting’s premises in Boadilla del Monte,
Madrid (Spain).
REFERENCES
Cartlidge, J. and Cliff, D. (2012). Foresight project, Driver
Review DR25. Exploring the “robot phase transition”
in experimental human-algorithmic markets. Techni-
cal report, UK Government’s Office for Science.
Cartlidge, J. and Cliff, D. (2013). Evidencing the “robot
phase transition” in human-agent experimental finan-
cial markets. In Proceedings of ICAART 2013.
Cartlidge, J., Szostek, C., De Luca, M., and Cliff, D. (2012).
Too fast too furious. Faster Financial-Market Trading
Agents Can Give Less Efficient Markets. In Proceed-
ings of ICAART 2012.
Cliff, D. (1996). Minimal-intelligence agents for bargaining
behaviors in market-based environments. Technical
report, Hewlett Packard Laboratories.
Cliff, D. and Preist, C. (2001). Days without end: On
the stability of experimental single-period continuous
double auction markets. Technical report, Hewlett
Packard Laboratories.
Das, R., Hanson, J., Kephart, J., and Tesauro, G. (2001).
Agent-human interactions in the continuous double
auction. In Proceedings of IJCAI 2001.
De Luca, M. (2012). Open Exchange (OpEx) - The open
source Algorithmic Trading System, SourceForge.
De Luca, M. and Cliff, D. (2011a). Agent-Human Interac-
tions in the Continuous Double Auction, Redux. Us-
ing the OpEx Lab-in-a-Box to explore ZIP and GDX.
In Proceedings of ICAART 2011.
De Luca, M. and Cliff, D. (2011b). Human-agent auction
interactions: Adaptive-aggressive agents dominate. In
Proceedings of IJCAI 2011.
De Luca, M., Szostek, C., Cartlidge, J., and Cliff, D. (2011).
Foresight project, Driver Review DR13. Studies on
interactions between human traders and Algorithmic
Trading Systems. Technical report, UK Government’s
Office for Science.
Feltovich, N. (2003). Nonparametric tests of differences
in medians: comparison of the Wilcoxon-Mann-
Whitney and robust rank-order tests. Experimental
Economics.
Fligner, M. and Pollicello, G. (1981). Robust Rank Proce-
dures for the Behrens-Fisher Problem. Journal of the
American Statistical Association, (76):162–168.
Smith, V. (1962). An experimental study of compara-
tive market behavior. Journal of Political Economics,
70:111–137.
Tesauro, G. and Bredin, J. (2002). Strategic sequential bid-
ding in auctions using dynamic programming. In Pro-
ceedings of AAMAS 2002.
Vytelingum, P. (2006). The Structure and Behaviour of the
Continuous Double Auction. PhD thesis.
Vytelingum, P., Cliff, D., and Jennings, N. (2008). Strate-
gic bidding in continuous double auctions. Artificial
Intelligence, 172(14):1700–1729.
WhyRobotsFailed-DemonstratingtheSuperiorityofMultiple-orderTradingAgentsinExperimentalHuman-agent
FinancialMarkets
53
