
Features of Event-related Potentials Used to
Recognize Clusters of Facial Expressions
Masahiro Yasuda
1
, Zhang Dou
2
and Minoru Nakayama
2
1
Mechanical and Control Engineering, Tokyo Institute of Technology, O-okayama, Meguro-ku, Tokyo, 152–8552 Japan
2
Human System Science, Tokyo Institute of Technology, O-okayama, Meguro-ku, Tokyo, 152–8552 Japan
Keywords:
Human Emotion, Facial Expression, EEG, ERP, Chronological Analysis, Prediction.
Abstract:
To assess human emotion using electroencephalograms (EEGs), the relationship between emotional impres-
sions of images of facial expressions and features of Event Related Potentials (ERPs) recorded using three
electrodes was analyzed. First, two clusters of emotional impressions were extracted using two-dimensional
responses of the Affect Grid scale. Second, features of ERPs in response to the two clusters were examined.
Time slots where amplitude differences in ERP appeared were measured, and differences in the frequency
power of ERP were also extracted for each electrode. To evaluate these features, prediction performance for
the two clusters was examined using discriminant analysis of the features. Also, the dependency of some band
pass filters was measured.
1 INTRODUCTION
In order to develop good Human-Computer interfaces
and create good communications systems, such as
human-robot or human-human, the establishment of a
technique for assessing human emotion is necessary.
Various biosignals have been used to try to detect hu-
man emotion (Lin et al., 2010). Electroencephalo-
grams (EEG) are a type of bio-signal sometimes used
to detect human emotion, the feature extraction and
signal processing procedures of which have been pre-
viously discussed (Guitton, 2010; Petrantonakis and
Hadjileontiadis, 2010). In those experiments, cate-
gories of emotion were based on Ekman’s classifica-
tion system (Ekman and Friesen, 1975), and also on
visual stimuli which can evoke the viewer’s impres-
sion of the emotion they are viewing. A simple stim-
ulus for presenting emotion is a set of facial expres-
sions which stimulate the viewer’s impression of the
emotion they are viewing. Even during the recogni-
tion of facial emotions, the transformability of emo-
tions and individual differences should be considered,
however. The relationship between certain facial ex-
pressions and the viewer’s impression of the emotion
they are viewing is sometimes analyzed (Huang et al.,
2009). Therefore, biosignal reactions such as EEGs
should be analyzed in response to the viewer’s im-
pression of the emotion they are viewing. To extract
specific physiological components of stimuli, Event
Related Potentials (ERPs) are often used to analyze
EEGs. ERP waveforms are averaged waveforms of
EEGs which respond to stimulus. ERPs are often
used for chronological analysis in psychological and
clinical studies (Nittono, 2005; Rugg, 1997). Also,
viewer’s chronological reactions to emotional stimuli
can be analyzed using ERP waveforms. Analysis of
these can contribute to the extraction of good features
used to detect viewer’s emotional responses.
To examine the relationship between the ob-
server’s impressions of emotional face images and
ERP responses when viewing this stimuli, significant
feature information from the ERP waveforms was ex-
tracted in an experiment. Therefore, this paper ad-
dresses following topics:
1. The groups of facial emotions which are based on
viewer’s impressions were extracted using subjec-
tive evaluation scores.
2. The ERP waveforms which are based on the emo-
tion groups were compared and the differences
were extracted.
3. To evaluate the significance of feature differences
in ERP waveforms, the performance of discrim-
inant analysis was evaluated. Also, the depen-
dency of some band pass filters was measured.
For these purposes, the following experiment was
conducted.
165
Yasuda M., Dou Z. and Nakayama M..
Features of Event-related Potentials Used to Recognize Clusters of Facial Expressions.
DOI: 10.5220/0005186901650171
In Proceedings of the International Conference on Bio-inspired Systems and Signal Processing (BIOSIGNALS-2015), pages 165-171
ISBN: 978-989-758-069-7
Copyright
c
2015 SCITEPRESS (Science and Technology Publications, Lda.)
2 EXPERIMENTAL METHOD
2.1 Stimulus
The images of facial emotions in this experiment were
prepared using the Japanese and Caucasian Facial
Expression of Emotion (JACFEE) collection (Mat-
sumoto and Ekman, 1988). This collection consists
of 56 color photographs of 56 different individuals
who illustrate one of the seven different emotions:
Anger, Contempt, Disgust, Fear, Happiness, Sad-
ness and Surprise. The photos are of equal num-
bers of Japanese and Caucasian models: 14 Caucasian
males, 14 Caucasian females, 14 Japanese males, 14
Japanese females. The validity of the facial emotions
has been confirmed, but some confusion in recogniz-
ing some of the expressions has also been reported
(Huang et al., 2009).
The subjects (viewers) who participated in this ex-
periment were 6 university students from 19 to 23
years old. Their visual acuity was sufficient to ob-
serve the stimuli. The experimental content was ex-
plained to all participants in advance, and informed
consent was then obtained.
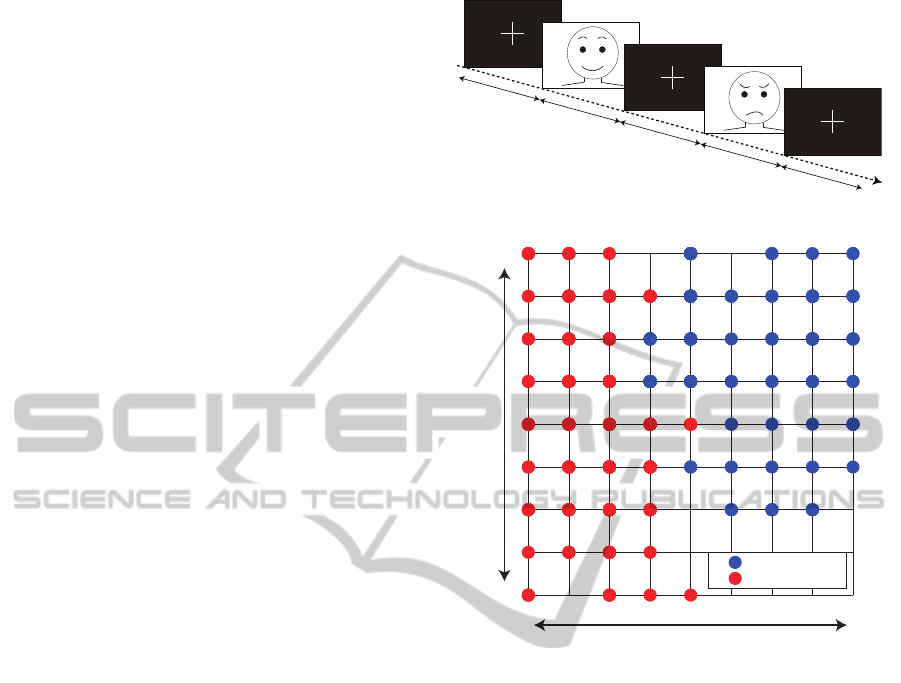
2.2 Procedure
Facial photos as visual stimulus were presented se-
quentially. The experimental sequence is illustrated
in Figure 1. First, a fixation point (+) was shown in
the centre of the screen, and a stimulus appeared after
the screen had been blank for 3-4 seconds. A fixa-
tion point was displayed to attract eye fixation, but it
disappeared before the target stimulus was shown, in
order to trigger stimulus onset in the manner of a con-
ventional visual perception experiment (Kirchner and
Thorpe, 2006). The duration of stimulus display was
3 seconds during which the PC sent a trigger signal to
another recording device. The display sequence was
controlled using Psychtoolbox (Brainard, 1997). A
set of sequences consisted of 56 photos, and the total
duration was 6 minutes. Three trials were conducted
in which different sets are shown to each subject, fol-
lowed by short breaks.
The EEGs were recorded from 3 scalp electrodes
positioned in the Frontal (Fz), Central (Cz) and Oc-
cipital (Oz) areas, according to the international 10-
20 system. The EEG potentials were measured us-
ing a bio-amplifier (ADInstruments: PowerLab4/30,
ML13). The scalp electrodes were referenced to a
base measurement at the subject’s ear lobes. A ground
electrode was placed on the forehead. The following
sampling conditions were used to record signals on a
PC, sampling rate: 400Hz, low pass filter: 30Hz, time
3 ~ 4s
3 ~ 4s
3 ~ 4s
3s
3s
Figure 1: Diagram of showing stimuli.
1 2 3 4 5 6 7 8 9
1
2
3
4
5
6
7
8
9
Cluster 1 (141)
Cluster 2 (195)
Pleasant
Feelings
Unpleasant
Feelings
High ArousalSleepiness
Figure 2: Results of cluster analysis for viewer’s responses
using the Affect Grid.
constant for a high pass filter: 0.3sec. To detect blinks
as an artifact source, in addition to the three poten-
tials the vertical component of an electro-occulograph
(EOG) was measured synchronously.
Additionally, five sets of band pass filters were
used in this analysis to reduce the artifacts of lower
frequencies in EEGs. The filter was applied to signals
during off-line processing using LabChart (ADInstru-
ments), which is a zero-phase-lag Finite Impulse Re-
sponse (FIR) filter. The ranges of band passes were
controlled using the following frequency bandwidths
: 0.5 ∼ 30Hz, 1.0 ∼ 30Hz, 1.5 ∼ 30Hz, 2.0 ∼ 30Hz,
2.5 ∼ 30Hz.
2.3 Subjective Evaluation of Facial
Emotions
In order to evaluate the viewer’s impression of the
emotion they are viewing of the stimulus photos, all
subjects were asked to rate the emotions using a des-
ignated scale. The scale is known as an “Affect Grid”,
BIOSIGNALS2015-InternationalConferenceonBio-inspiredSystemsandSignalProcessing
166
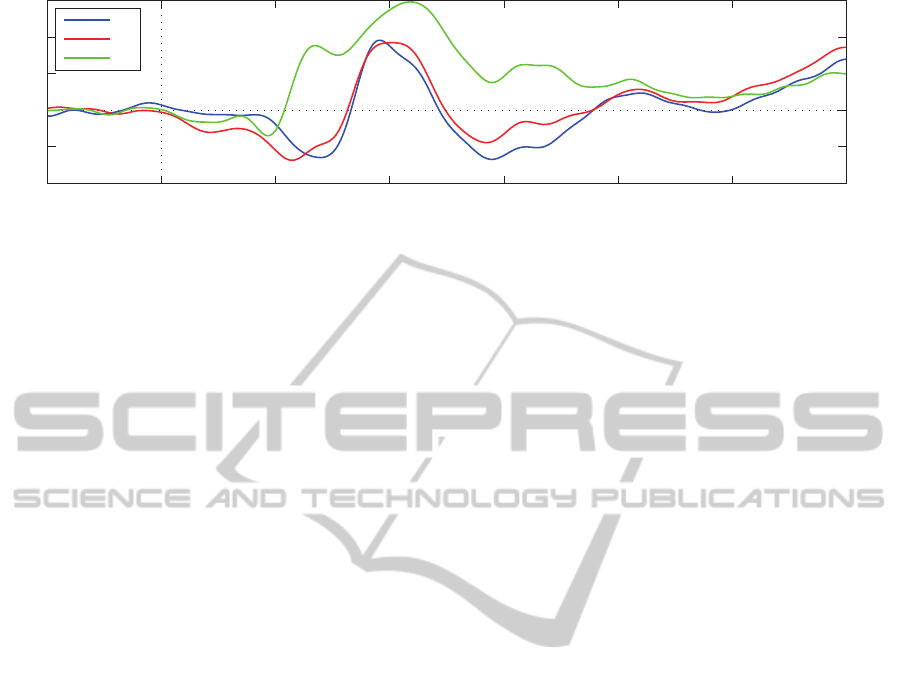
−100 0 100 200 300 400 500 600
−4
−2
0
2
4
6
Time [ms]
Amplitude [μV]
Fz
Cz
Oz
Figure 3: Three ERPs for Electrodes Fz, Cz and Oz (Band Pass Filter: 2.0 ∼ 30Hz).
and consists of a two dimensional 9 point scales with
“Pleasant - Unpleasant Feelings” and “High Arousal -
Sleepiness” (Russell et al., 1989), as shown in Figure
2. The validity of this scale has often been used to
evaluate facial emotions (Takehara and Suzuki, 2001;
Shibui and Shigemasu, 2005).
All 56 photos were rated by each subject using the
scale, after observing three trial sets of images.
3 RESULTS
3.1 Responses using the Affect Grid
All ratings for the facial image photos using Affect
grid are summarized in Figure 2. The horizontal axis
indicates “Pleasant - Unpleasant Feelings”, and the
vertical axis indicates “High arousal - Sleepiness”.
In regards to Figure 2, the ratings cover most of the
area of the two-dimensional scale in response to the
photos of 7 facial emotions. The responses for two-
dimensional scales were given using integer grading,
and many of the responses overlap others in Figure 2.
In comparing the rating distribution between partici-
pants across two-dimensions, some individual differ-
ences were observed (Yasuda et al., 2014). Though
facial codes are universal emotions used in Ekman’s
study, there are some individual differences in the
ability to recognize them. Therefore, the subject’s re-
sponses were not identical for each photo.
To classify the responses based on their two-
dimensional ratings, cluster analysis using the
weighted pair group method and arithmetic averages
(WPGMA), which is a distance metric used to facil-
itate comparison with each other, was conducted for
all 336 responses (56 photos × 6 subjects). As a re-
sult, two clusters were extracted, and are presented as
two colors in Figure 2. Two clusters are distributed in
the left and right regions of the horizontal axis, which
shows “Pleasant - Unpleasant Feelings”. Therefore,
they can be called “Pleasant” and “Unpleasant” clus-
ters. The ratio of the number of clusters depends on
each subject, and the average ratio for “Pleasant” is
0.42.
3.2 Event Related Potentials
3.2.1 Chronological Analysis of the Two Clusters
To measure the differences in EEG waveforms be-
tween “Pleasant” and “Unpleasant” clusters, the two
were compared chronologically. Here, event related
potentials (ERPs) are calculated to emphasize the
waveforms in response to the two classes of photos
of facial emotions.
EEG waveforms were extracted between -100 and
600 milliseconds before stimulus onset, and the av-
erage voltage in the 100 milliseconds before stimulus
onset was set as a baseline. Trials which contained
artifacts such as blinks or amplitudes over ±100µV
were excluded in advance, and averaged potentials for
the two clusters were then calculated.
First, the ground averages of ERPs are summa-
rized to compare the waveforms of the three elec-
trodes in Figure 3 chronologically. The deviations
start around 100 milliseconds for all ERPs, and this
phenomenon has been observed in previous studies.
The first negative peaks were observed around 100
milliseconds in the order of Oz, Cz and then Fz. This
may suggest that visual evoked signals spread from
the Occipital area (low level vision) to the Frontal area
(high level vision). A broad range of waveforms is
observed for Oz while voltage changes for Cz and Fz
appear at around 200 milliseconds. These responses
may reflect to the progress of visual information pro-
cessing.
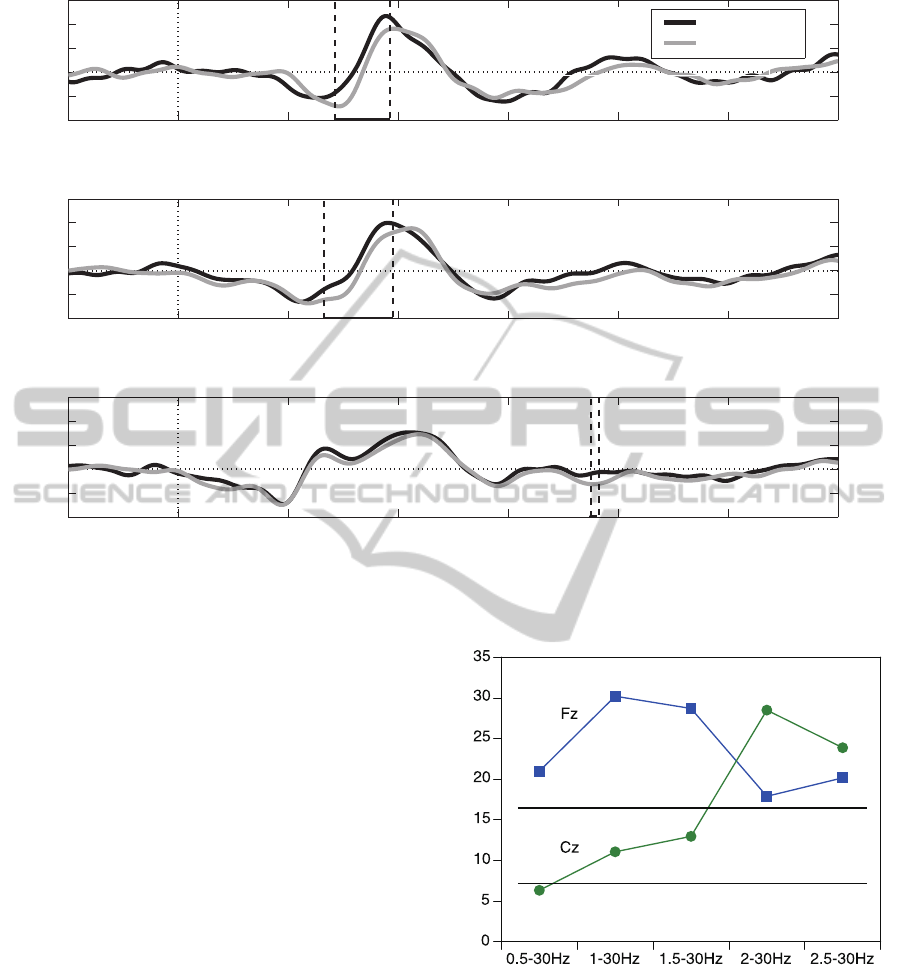
Second, the ERP waveforms between the two
clusters on each electrode are compared in Figure
4. The solid line represents the “Pleasant” cluster,
and the gray line represents the “Unpleasant” clus-
ter. There are some differences in ERPs between the
two clusters. To identify the time zone where there
are significant differences between the two means of
ERPs across the two clusters, pair-wise t tests were
FeaturesofEvent-relatedPotentialsUsedtoRecognizeClustersofFacialExpressions
167
−100 0 100 200 300 400 500 600
−4
−2
0
2
4
6
Fz
Amplitude [μV]
−100 0 100 200 300 400 500 600
−4
−2
0
2
4
6
Cz
Amplitude [μV]
−100 0 100 200 300 400 500 600
−4
−2
0
2
4
6
Oz
Time [ms]
Amplitude [μV]
Pleasant
Unpleasant
Figure 4: Comparison of ERPs between two clusters of Electrodes Fz, Cz and Oz (Band Pass Filter: 2.0 ∼ 30Hz), with a
dotted-line box indicating the time zone where there are significant differences between two ERPs (p < 0.05).
conducted. In regards to previous studies (Thorpe
et al., 1996; VanRullen and Thorpe, 2001), the time
zone was identifiyed where 15 consecutive t test val-
ues were below the p < 0.05 level. In this paper, a 5%
level of significance was employed, and d f was 34 (2
clusters × 3 sets × 6 subjects - 2). The sampling slot
mentioned above is 2.5 milliseconds.
The significant time slots can be extracted, and
they are illustrated using dotted line boxes in Fig-
ure 4 as follows, Fz: 142.5∼192.5 milliseconds, Cz:
132.5∼195.0 milliseconds. Both are time slots occur-
ing after the negative peaks at around 100 millisec-
onds and before the positive peaks at around 200 mil-
liseconds. Those time slots are independent of the
type of band pass filter. Therefore, ERPs in those time
slots may contain some features in response to the two
clusters of emotions. At the Oz electrode, the signifi-
cant time slot is too short and too late, so it should be
ignored.
3.2.2 Effectiveness of Band Pass Filters
A band pass filter is used in EEG measurements to
detect a distinct signal. To determine the appropriate
filter band to extract features of emotional responses,
the variance of these signals were evaluated using
Variance rate
p<0.05
p<0.01
Figure 5: The rate of variance between two conditions.
analysis of variance (ANOVA). To maximize the vari-
ance between the two clusters, the appropriate band
pass filter was evaluated using the following proce-
dure. In addition to the randomized factor of the view-
ers, two factors, namely the two clusters and the trial
sets (2 ×3), influenced the deviations of the potentials
in this experiment. The ratio of variance between the
two clusters (F values) was calculated for the various
filter conditions.
F values are summarized in Figure 5. The hor-
BIOSIGNALS2015-InternationalConferenceonBio-inspiredSystemsandSignalProcessing
168
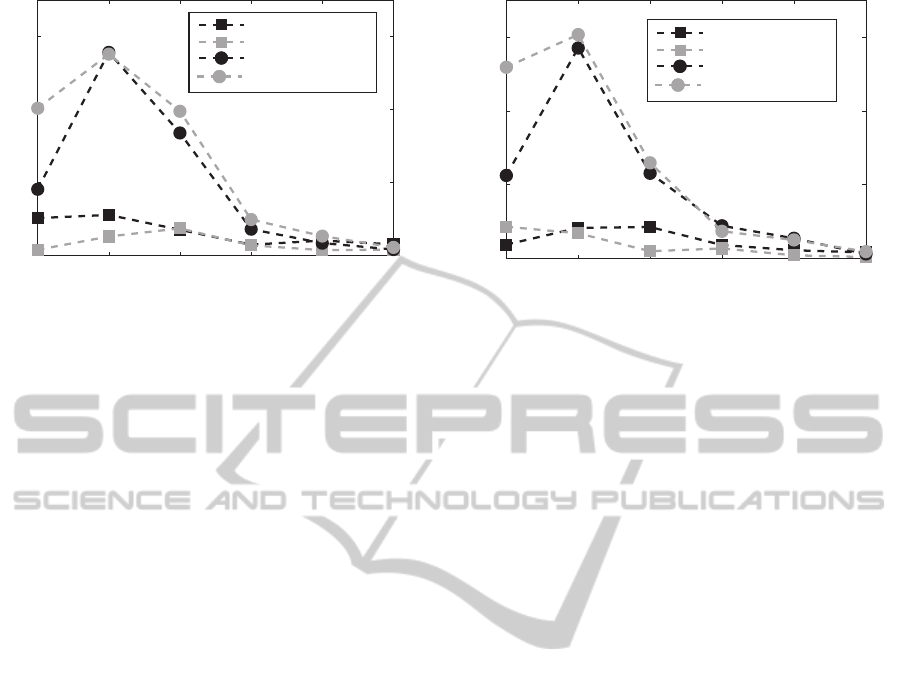
6.25 12.5 18.75 25 31.25 37.5
0
1
2
3
Frequency [Hz]
Fz
Amplitude [μV]
Pleasant (T1)
Unpleasant (T1)
Pleasant (T2)
Unpleasant (T2)
Figure 6: Comparison of frequency spectrum for Electrode
Fz across two conditions and time slots (Band Pass Filter:
2.0∼30Hz).
izontal axis represents filter conditions, the vertical
axis represents F values. Two levels of significance in
F values are indicated in Figure 5. The results show
that all conditions for Fz always produce a significant
variance ratio, but Electrode Cz needs filters above
2Hz. Therefore, the band pass filter should be set over
2Hz to detect the differences in ERPs between the two
clusters.
Additionally, the factor of the trial set is not sig-
nificant and does not influence other factors in this
analysis.
3.2.3 Frequency Analysis of EEG
In the above section, amplitudes of ERP between the
two clusters are compared. The frequency compo-
nents is another well known feature of EEG/ERP sig-
nals, and the difference in these components should
also be analyzed. Regarding the chronological analy-
sis, typical ERP responses can be observed in the 200
milliseconds after stimuli onset in comparison with
the baseline, which is before onset. To extract some
features of ERP responses, simple frequency analysis
was employed to obtain the frequency factors. Re-
garding measuring restrictions, the features were cre-
ated using the following procedure. Frequency anal-
ysis was applied to two time slots, T1: -100∼60 mil-
liseconds and T2: 60∼220 milliseconds, both were
160 milliseconds span (64 sampling points) whose
length was based on a power of 2 using FFT algo-
rithm. Hanning window was applied to FFT anal-
ysis. Regarding the analytical conditions, the fre-
quency resolution is 6.25Hz.
The amplitudes in the frequency domain for Fz are
summarized in Figure 6. The horizontal axis repre-
sents the frequency components which are based on
the frequency resolution in this analysis. The vertical
6.25 12.5 18.75 25 31.25 37.5
0
1
2
3
Frequency[Hz]
Cz
Amplitude [μV]
Pleasant (T1)
Unpleasant (T1)
Pleasant (T2)
Unpleasant (T2)
Figure 7: Comparison of frequency spectrum for Electrode
Cz across two conditions and time slots (Band Pass Filter:
2.0∼30Hz).
axis represents the amplitude of the components. The
amplitudes in the frequency domain for Cz are sum-
marized in Figure 7, and shown in the same format as
Figure 6. The amplitudes of slot T2 are larger than
the ones for slot T1, and the amplitudes of the first
four components in T2 account for over 90% of the
total. The differences in the amplitudes between the
two clusters for both Fz and Cz at 6.25Hz are remark-
able.
3.3 Estimation of Emotion Clusters
using Features of ERP
There are some features of ERPs which present two
emotion clusters, as mentioned in the above sections.
To measure the significance of these features, discrim-
inant analysis to predict the emotion clusters using the
features was conducted. A Support Vector Machine
(SVM) was applied to this prediction, and the sub-
ject leave-one-out procedure was employed to eval-
uate the estimation accuracy. The features follow 6
metrics as input data: amplitudes of ERP for each
significant time slot for Fz and Cz, and amplitude dif-
ferences in the lower four frequency components be-
tween time slots T1 and T2. The actual numbers of di-
mensions for features are 18 amplitudes of Fz, 25 am-
plitudes of Cz, and 4 frequency components of elec-
trodes Fz and Cz, as mentioned in subsection 3.2.3.
The number of dimensions is summed up when both
Fz and Cz are employed. The feature set consists of
36 pieces of data (2 emotion clusters × 3 set of trial ×
6 subjects). There are 6 prediction conditions : ERP
amplitudes (Fz, Cz, and both) and Frequency compo-
nents (Fz, Cz, and both).
The levels of accuracy are compared between con-
ditions by employing five band pass filters mentioned
FeaturesofEvent-relatedPotentialsUsedtoRecognizeClustersofFacialExpressions
169
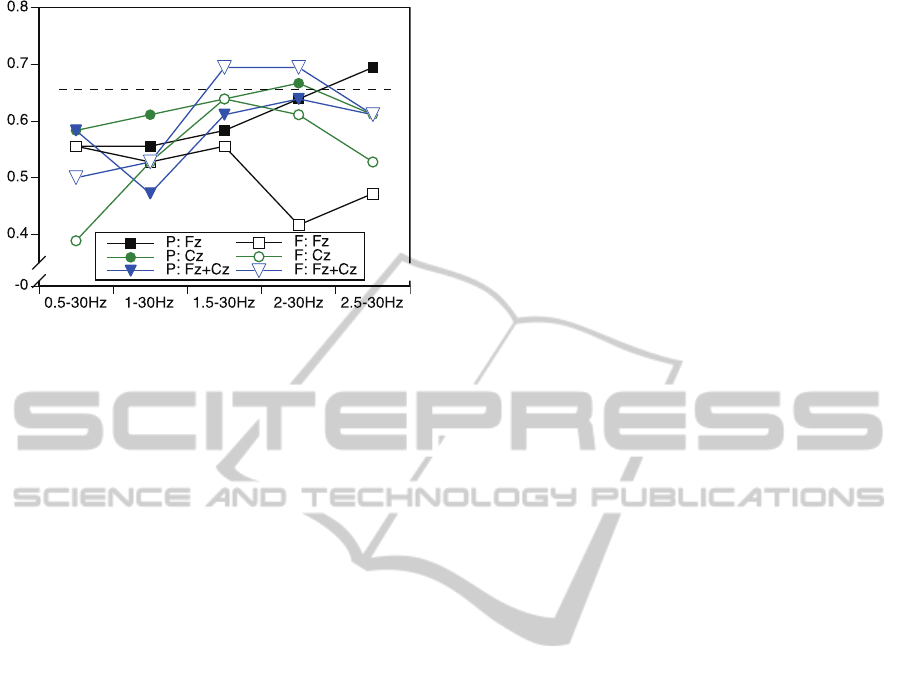
Accuracy
p<0.05
Figure 8: Accuracy of prediction for emotion clusters using
features of ERPs.
above in Section 2.2. They are summarized in Fig-
ure 8. The horizontal axis represents the five band
pass filters, and the vertical axis represents the accu-
racy. This accuracy gradually increases as the band
pass filter conditions vary toward lower frequences
(0.5∼2.5Hz). To evaluate the significance of the pre-
diction, a χ
2
test was conducted. The level of signifi-
cance in Figure 8 is indicated using a dotted line.
As a result, the level of accuracy of the four condi-
tions is significant. Combinations of frequency com-
ponents for Fz and Cz are significant for the level of
accuracy while certain ERP amplitudes for Fz and Cz
are effective. From these accuracy results, the low-
est frequency of the band pass filter should be set at
around 2.0Hz, as this will also maximize the variance
in ERP amplitudes between conditions.
4 DISCUSSION
To evaluate viewer’s emotion, a detectable class of
emotions should be specified. In regards to the re-
sults of cluster analysis of responses using an Affect
Grid, two clusters such as “Pleasant” and “Unpleas-
ant” feelings can be extracted. When factors con-
cerning the photo models were omitted, the same two
clusters were also extracted. Though the classes of
facial emotion are often discussed, typical emotions
can be easier to detect. Therefore, the structure of the
two clusters is an important scale for emotional im-
pressions. Also, this classification can be applied to
impressions for any types of images, such as “Pleas-
ant” and “Unpleasant” images. The relationship be-
tween the two clusters of viewed facial emotions and
the features of ERPs has been confirmed. The impres-
sion of the image can be estimated to be either of the
two clusters using just the features of ERPs.
Regarding chronological analysis of ERP wave-
forms, significant differences in Fz and Cz ERPs can
be detected between the two clusters, but there is no
difference at Oz. The emotional recognition is one
of high level processing, and the differences appear
on potentials at the mid and frontal areas. There-
fore, more detailed information should be collected
from these areas of the scalp. Additionally, there is
no significant difference in features of ERPs across
the three trials. The validity of the possibility of de-
tection has been confirmed. To detect this activity,
the use of a selection of band pass filters directly af-
fects feature extraction. Analysis of the amplitude
and frequency components of ERPs confirms that the
lower frequency of the band pass filter should be set
at around 2.0Hz.
The possibility of predicting viewer’s impressions
and dividing them into two clusters of facial emotion
has been examined. This means that viewer’s subjec-
tive impressions of an emotion can be estimated us-
ing their EEG information while viewing occurs. To
improve prediction performance, appropriate feature
extraction and an appropriate combination of proce-
dures should be determined. Also, the possibility of
predicting the viewer’s emotional condition will be
confirmed using photos which exclude those which
display facial emotions.
5 CONCLUSION
In order to evaluate the viewer’s impression of the
emotion they are viewing, the relationship between
emotion impressions of images of facial expressions
and features of Event Related Potentials was ana-
lyzed. Following points were extracted during the
analysis.
1. Subjective impressions of the photos of facial im-
ages were measured using the Affect Grid, and
two clusters known as “Pleasant” and “Unpleas-
ant” clusters were extracted.
2. The time slots showed significant differences in
ERP waveforms between the two clusters at the
Frontal (Fz) and Central (Cz) electrodes, except
at the Occipital electrode (Oz).
3. In comparing the freqeuncy power of the two time
slots, -100∼60 milliseconds (T1) and 60∼220
milliseconds (T2), the amplitudes of slot T2 are
larger. The differences in the amplitudes of slot
T2 between the two clusters for both Fz and Cz at
6.25Hz are remarkable.
4. Five band pass filters were used in this analysis.
The results of the analysis confirms that the lower
BIOSIGNALS2015-InternationalConferenceonBio-inspiredSystemsandSignalProcessing
170

frequency of the band pass filter should be set at
around 2.0Hz.
Discriminant analysis was conducted using the
features of ERP, in order to evaluate the significance
of these, and some significant accuracy was obtained.
To generate more significant features to measure the
viewer’s state of emotion while they are viewing im-
ages of facial expressions, some additional biosignals
such as eye movements using EOGs should be con-
sidered. They will be subject of our further study.
ACKNOWLEDGEMENT
This research was partially supported by the Japan
Society for the Promotion of Science (JSPS), Grant-
in-Aid for Scientific Research (B-26282046:2014-
2016).
REFERENCES
Brainard, D. H. (1997). The Psychophysics Toolbox. Spa-
tial Vision, 10:433–436.
Ekman, P. and Friesen, W. V. (1975). Unmasking the Face:
A guide to recognizing emotions from facial clues.
Prentice-Hall, New Jersey, USA.
Guitton, C. (2010). Emotions estimation from eeg
recordings. Master’s thesis, Imperial College,
Londo, UK. http://www.academia.edu/1203149/
Emotions
Estimation from EEG Recordings.
Huang, J., Fan, J., He, W., Yu, S., Yeow, G., Sun, G., Shen,
M., Chen, W., and Wang, W. (2009). Could inten-
sity ratings of Matsumoto and Ekman’s JACFEE pic-
tures delineate basic emotions? A principal compo-
nent analysis in Chinese university students. Person-
ality and Individual Differences, 46:331–335.
Kirchner, H. and Thorpe, S. J. (2006). Ultra-rapid object de-
tection with saccadic eye movements: Visual process-
ing speed revisited. Vision Research, 46:1762–1776.
Lin, Y.-P., Wang, C.-H., Jung, T.-P., Wu, T.-L., and Jeng, S.-
K. (2010). EEG-Based emotion recognition in music
listening. IEEE Transaction on biomedical Engineer-
ing, 57(7):1798–1806.
Matsumoto, D. and Ekman, P. (1988). Japanese and Cau-
casian facial expression of emotion (JACFEE) and
neutral faces (JACNeuF). San Fransisco State Uni-
versity, San Francisco, CA, USA.
Nittono, H. (2005). Event-related potential guidebook
for psychological research. Kitaohji-shobo, Kyoto,
Japan.
Petrantonakis, P. C. and Hadjileontiadis, L. J. (2010). Emo-
tion recognition from EEG using higher order cross-
ings. IEEE Transaction on information technology in
biomedine, 14(2):186–197.
Rugg, M. D. (1997). Cognitive Neuroscience. Psychology
Press, UK.
Russell, J. A., Weiss, A., and Mendelsohn, G. A. (1989).
Affect grid: A single-item scale of pleasure and
arosal. Journal of Personality and Social Psychology,
57(3):493–502.
Shibui, S. and Shigemasu, K. (2005). A model of
two-dimensional placement of the facial expressions
of emotion. The Japanese Journal of Psychology,
76(2):113–121.
Takehara, T. and Suzuki, N. (2001). Robustness of the two-
dimensional structure of recognition of facial expres-
sion: evidence under differentt intensities of emotion-
ality. Perception and Motor Skills, 93:739–753.
Thorpe, S., Fize, D., and Marlot, C. (1996). Speed of pro-
cessing in the human visual system. Nature, 381:520–
522.
VanRullen, R. and Thorpe, S. J. (2001). The time
course of visual processing: From early perception to
decision-making. Journal of Cognitive Neuroscience,
13(4):454–461.
Yasuda, M., Dou, Z., and Nakayama, M. (2014). EEG fea-
tures of recognizing facial expressions. Technical Re-
port HCS2014-41, IEICE Technical report.
FeaturesofEvent-relatedPotentialsUsedtoRecognizeClustersofFacialExpressions
171
