
Using Phase Congruency Model for Microaneurysms Detection in
Fundus Image
Zhitao Xiao
1
, Fang Zhang
1
, Lei Geng
1
, Jun Wu
1
, Xinpeng Zhang
1
, Long Su
2
and Chunyan Shan
3
1
School of Electronics and Information Engineering, Tianjin Polytechnic University, Tianjin 300387, China
2
Tianjin Medical University Eye Hospital, Tianjin 300384, China
3
Tianjin Medical University Metabolic Disease Hospital, Tianjin 300070, China
Keywords: Microaneurysms, Phase Congruency, Directional Cross-Section Profiles, Diabetic Retinopathy.
Abstract: This paper addresses an automatic detection method of microaneurysms in color fundus images, which
plays a key role in computer assisted diagnosis of diabetic retinopathy, a serious and frequent eye disease.
The main concentration of this paper is to detect microaneurysms with phase congruency. The first step
consists in image normalization and green channel extraction. The second step aims at obtaining
microaneurysms candidate regions, which is achieved using phase congruency. Then the irrelevant
information, such as the vessel fragments, is removed by constructing directional cross-section profiles.
Through testing on 50 fundus images provided by ROC website, the experimental results show that this
method can accurately get microaneurysms in color fundus images.
1 INTRODUCTION
Diabetic retinopathy (DR) is a complication of
diabetes that results from damage to the blood
vessels of the light-sensitive tissue at the back of the
eye (retina). It is a sight-threatening disease that
possibly leads to vision impairment and blindness. It
has been shown that an automated DR screening
system would be a great assist in the processes of
diagnosing and progression tracking.
Microaneurysm (MA) is the swelling of the capillary
caused by a weakening of the vessel wall, which
appears as the tiny and reddish isolated dot. MAs are
amongst the first clinical signs of the presence of
DR. Hence, the automatic detection of MAs in color
fundus images is critical for diagnosing the process
of Diabetes and plays an important role on mass DR
screening.
In section 2 we will briefly review the available
methods for fundus images MAs detection, after
which in section 3 phase congruency theory is
introduced. The proposed method is described in
details in section 4. Finally, the experiment results
and conclusion of our method are presented in
section 5 and section 6.
2 STATE-OF-THE-ART MA
DETECTORS
MAs are characterized by their diameter which is
always smaller than 125μm. They have typically low
contrast and may be hard to distinguish from noise
or pigmentation variations. In addition, color fundus
images often suffer from non-uniform illumination,
poor contrast and noise. Therefore, achieving
efficient detection of MAs becomes a complex and
challenging issue. Existing MAs detection
algorithms can be divided into three categories,
mathematical morphology methods (Spencer, 1996;
Hipwell, 2000; Fleming, 2006; Walter, 2007),
supervised learning based methods (Sinthanayothin,
2002; Niemeijer, 2005; Zhang, 2010), and filter
based methods (Quellec, 2008; Hatanaka, 2012).
Spencer et al. (Spencer, 1996) described a
mathematical morphology based detection method
for MAs. Using shade-correction and top-hat
transformation, they gave satisfactory results.
Whereas it is in fluorescein angiographies images
and not appropriate for color fundus images. To
detect the MA candidates in color fundus
photographs, Niemeijer et al. (Niemeijer, 2005)
presented a hybrid scheme that uses both the top-hat
transformation and the supervised pixel
158
Xiao Z., Zhang F., Geng L., Wu J., Zhang X., Su L. and Shan C..
Using Phase Congruency Model for Microaneurysms Detection in Fundus Image.
DOI: 10.5220/0005186801580163
In Proceedings of the International Conference on Pattern Recognition Applications and Methods (ICPRAM-2015), pages 158-163
ISBN: 978-989-758-077-2
Copyright
c
2015 SCITEPRESS (Science and Technology Publications, Lda.)
classification based method. Zhang et al. (Zhang,
2010) proposed a method based on Sparse
Representation Classifier (SRC). Hatanaka et al.
(Hatanaka, 2012) achieved automatic detection in
non-dilated fundus images using the double-ring
filter and the artificial neural network (ANN).
Although these methods described above have
achieved automatic detection of MAs in different
kinds of fundus images, there are still some
problems, such as high false detection rate, high
missing detection rate, and complex operation. The
fundamental reason is that these approaches mainly
use gradient information to describe image. Gradient
based detection methods are sensitive to the contrast
of image and noise. Thus such algorithms require
initial images with high quality. If the fundus images
are degraded due to the non-uniform illumination or
low contrast, these methods will have difficulties to
detect the real MAs and exclude a large number of
non-MA objects. And the system will be more
complex in further classification based on the region
feature. On the whole, gradient-based approaches
are difficult to achieve good detection results for
fundus images with complex background.
Phase information is consistent with human
visual system perception characteristics. It has many
advantages in image description, such as invariance
to contrast and brightness, high noise immunity.
Therefore this article describes a novel MAs
detection method based on phase information.
Because phase information is invariant to contrast
and brightness, it needs no enhancement
preprocessing. Moreover, the proposed method
detects MAs directly, which avoids the complex
process of feature training and object classification.
As a result, it greatly reduces the complexity and
running time. The performance of the proposed
method is demonstrated through experiments.
3 PHASE CONGRUENCY
MODEL
Phase Congruency model (PC) is an image feature
detector (Morrone, 1987; Xiao, 2004). It assumes
the most accordant point of phase in Fourier
component as the feature points, which can be used
to detect step feature, line feature and roof feature.
PC has been successfully applied to texture
segmentation, edge detection, image denoising and
other fields with satisfactory results. Using PC for
marking feature has significant advantages over
gradient-based methods. It is invariant to image
brightness and contrast. Hence it provides an
absolute measurement of the significance of feature
points, which accords to human visual perception
characteristics. These excellent features make it
ideal for medical images with various characteristics.
4 METHOD OF MA DETECTION
IN FUNDUS IMAGE BASED ON
PHASE CONGRUENCY
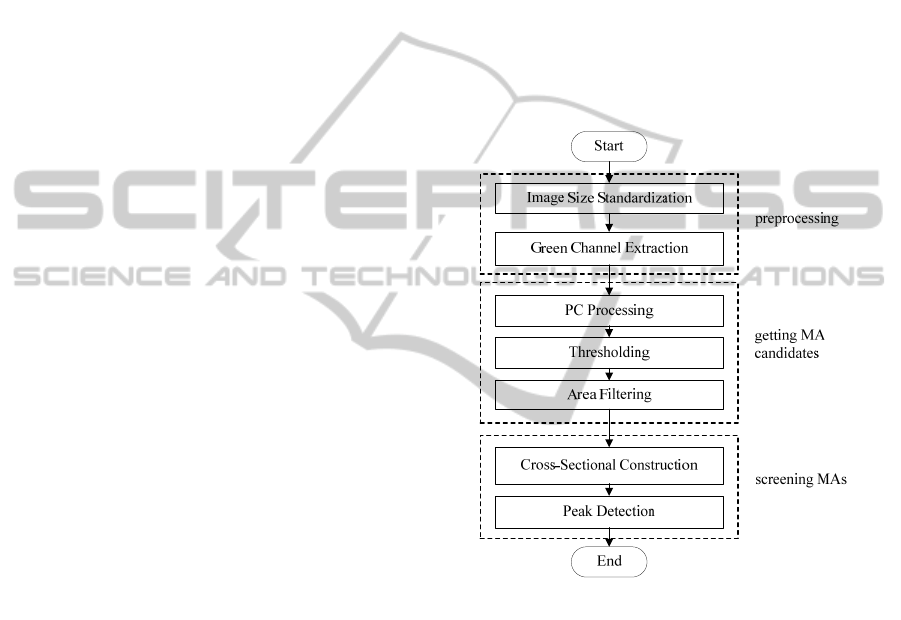
The proposed method is divided into three
processes: preprocessing, getting MA candidates,
and screening MAs. The flowchart of this method is
illustrated in Figure 1.
Figure 1: Flowchart of MAs detection in fundus image
based on PC.
4.1 Preprocessing
Firstly, for setting the parameters conveniently, the
images are resized to horizontal resolution 768
pixels using bicubic interpolation. Compared with
the red and blue channels, the objects such as blood
vessels and MAs in the retinal layer are best
represented (see Figure 2) in the green channel.
Therefore, the green channel of the color fundus
image is chosen for the subsequent processing. In
the green channel of color fundus image, MAs
appear as dark patterns, small, isolated and circular
shape, as shown in Figure 3.
UsingPhaseCongruencyModelforMicroaneurysmsDetectioninFundusImage
159
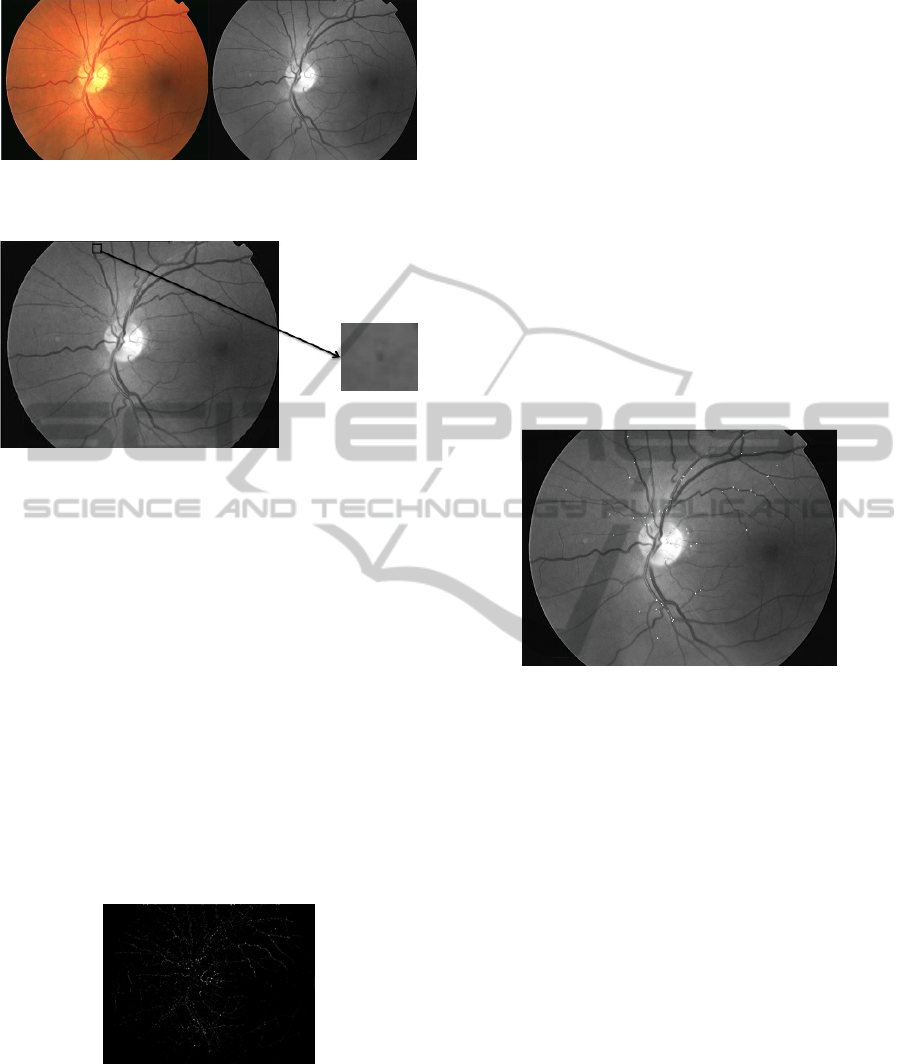
(a) original image; (b) green channel.
Figure 2: Original image and its green channel image.
Figure 3: MA details in green channel.
4.2 MA Candidates Detection
4.2.1 Objects Detection based on PC
Here, we use the PC calculating method provided by
Kovesi (Kovesi, 1999), which extended the 1-D PC
to allow the calculation of 2-D PC of image by
applying 1-D analysis over several orientations and
scales. After PC calculation, a pattern mask is
chosen to eliminate the boundary of the image. The
PC detection result is shown in Figure 4 (Because
the image has low gray value after PC processing, in
order to demonstrate the result of PC clearly, the
image is shown with gray enhancement). The
structures which have large local energy (including
MAs) are preserved, while blood vessels and other
large lesions have been filtered out mostly.
Figure 4: Detection result from PC.
4.2.2 MA Candidates Detection
After feature detection by PC, points with high gray-
scale correspond to the targets with salient features
in green channel fundus image. Thus, MA
candidates can be extracted by thresholding. Here,
one-tenth of the maximum gray value in the PC
detection result is selected as the threshold to
achieve binarization for Figure 4. Then the area
filtering is executed, through which large structures
(blood vessels and other large lesions) and small
structures (noise) are removed, and the MA
candidates (including some false MAs and the real
MAs) are left. Figure 5 shows the filtered results
superimposed on the green channel image. We can
see that most of the MA candidates occur on the
blood vessels. Some corners and junctions of blood
vessels, which have similar brightness and shape
with MAs, lead to error detection. With the
knowledge of pathology, MAs are located on
capillaries. And as these capillaries are not visible in
color fundus images, MAs should appear as isolated
patterns. Based on these characteristics, false MAs
can be wiped away (shown in next Section).
Figure 5: MA candidates superimposed on the green
channel image.
4.3 Cross-Section Construction
According to the shape feature of MA candidates,
non-MA targets can be excluded. For each MA
candidate point (x,y), a W×W neighborhood window
centered on (x,y) is taken at the original green
channel image (W=2L-1. L is considered according
to the image resolution. Here, L=8 is selected
corresponding to the image horizontal resolution of
768 pixels). In the selected neighborhood, eight
scanning lines with different angles passing through
the center point are tested (here, they are 0°, 22°,
45°, 66°, 90°, 111°, 135°, 156°). The records of the
pixel gray values along the eight scanning lines
constitute a set of one dimensional intensity profiles,
in other words, form a set of cross-section profiles
(Lazar, 2013). Vessel segments, background regions
and MAs have different characteristics, as shown in
Figure 6. It is found that MAs show significant
Gaussian-like peaks for all directions. While in the
case of the blood vessels, only the profiles of
scanning lines cross the vessel show clear peaks. As
ICPRAM2015-InternationalConferenceonPatternRecognitionApplicationsandMethods
160

the directions of the scanning lines approximate to
the direction of the vessel segment, the peaks of the
profiles become more and more unclear, until almost
completely disappears.
(a)vessel segment; (b)background region; (c)MA.
Figure 6: Cross-section profiles of a vessel segment,
background region and an MA.
Peak detection is applied on each profile. Several
parameters for the peaks, including size, height, and
shape are calculated subsequently. Once a peak is
detected at the center of the window, the slope
between adjacent pixels is calculated. Thereby the
four special points of the peak are determined.
Specifically, the values of inc
s
and inc
e
correspond
to the start and the end indices of the increasing
ramp. Similarly, dec
s
and dec
e
denote the boundaries
of the decreasing ramp, respectively. Figure 7 shows
a graphical interpretation of the ramps. Then the
following five properties of each peak are calculated
using these four points.
(1) The peak width is the difference between the
start and the end indices of the peak:
() () ()
peak e s
wideciinci
(1)
(2) The top width is the size of the gap between
the increasing and the decreasing ramp:
() () ()
top s e
w i deci inci
(2)
Figure 7: Four special points of peak detection.
(3) The average ramp height:
() () () 2
inc dec
Rheights i h i h i
(3)
where
( ) [ ( )] [ ( )]
inc e s
hi Pinci Pinci
(4)
stands for the increasing ramp height, and
()[()][()]
dec s e
hi Pdeci Pdeci
(5)
is the decreasing ramp height, P[·] denotes the gray
value of a given pixel;
(4) The average ramp slope:
() () () 2
inc dec
Rslopes i S i S i
(6)
where
() () () ()
inc inc e s
S i h i inc i inc i
(7)
is the increasing ramp slope, and
() () () ()
dec dec e s
S i h i dec i dec i
(8)
is the decreasing ramp slope;
(5) The peak height is computed as the difference
between the intensity of the center pixel and a
baseline that connects the start and the end of the
profile:
)]([)]([)(
)])([)]([(][
)(
iincPiincLiw
iincPidecPLP
ih
sspeak
se
peak
(9)
where i=0,1,2,...,7, represents the eight scanning
directions. After obtaining the five properties, Score
is calculated by the following equation, which has
considered the shape, symmetry, sharpness and
contrast of the candidates.
1
peak
top peak
peak
hRslopes
w w Rslopes Rheights h
M
Score
(10)
where
peak
h
M
is the minimum of h
peak
,
Rslopes
is the
mean of Rslopes,
peak
w
is the standard deviation of
w
peak
. Similarly,
top
w
,
Rheights
,
Rslopes
and
peak
h
are the standard deviation of w
top
, Rheights, Rslopes
and h
peak
, respectively.
By calculating the Score of a large of real MAs,
we get the Score value range as [20, 30] for the real
MAs. Accordingly, when the candidate’s Score
value falls into this range, it can be considered as the
real MA. Otherwise, it will be treated as the false
target and be removed away.
UsingPhaseCongruencyModelforMicroaneurysmsDetectioninFundusImage
161
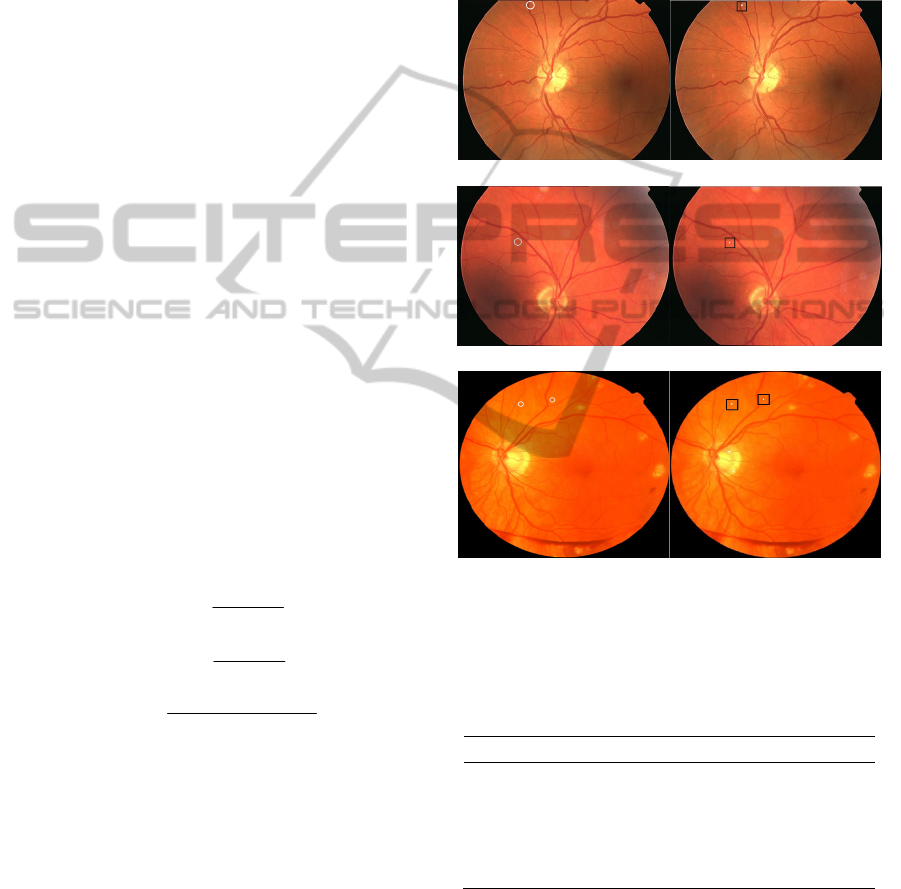
5 RESULTS AND DISCUSSION
5.1 Materials and Results
To examine the performance of the proposed
method, we utilize the fundus images provided by
Retinopathy Online Challenge (ROC) website
(Retinopathy Online Challenge, 2008). The ROC
provides 50 training cases and 50 test cases, in
which “gold standard” locations of MAs are
provided for the training cases, and the MAs in the
test ones are not labeled. In the experiment, the
computerized scheme is developed using the training
set, and the performance of the proposed method is
validated with “gold standard”. Figure 8 shows the
MAs detection results of three images from the
training set, where (a1), (a2) and (a3) are the “gold
standard” given by ROC, (b1), (b2) and (b3) are the
final MAs detection results of our method. There are
uneven illumination and low contrast problems in
(a1) and (a2). Although the image quality of the
three selected fundus pictures are different,
experimental result shows that the proposed method
can detect the MAs accurately in color fundus
images without any enhancement processing.
5.2 Quantitative Evaluation and
Comparison
In the image level, the detection sensitivity,
specificity and accuracy are selected as the
algorithm stability criteria, which are defined as the
following formulas (Gao, 2012):
TP
sensitivity
TP FN
TN
specificity
TN FP
TP TN
accuracy
TP TN FP FN
where TP means true positive, FP is false positive,
TN stands for true negative, and FN notes false
negative.
In this paper, 50 fundus images in training set are
detected. To the image level, the method achieved
sensitivity of 94%, specificity of 100%, and
accuracy of 96%, respectively. Experimental data
show that this method can give good performance in
detecting MAs in color fundus images, which also
obtain satisfactory results for distinguishing between
normal and diseased fundus images.
Table 1 shows the sensitivity of different
methods at 1.0 FP per image (that is, the sensitivity
when the number of False Positive is 1.0).
Sensitivity is the number of true MAs correctly
detected, while false positive is the number of non-
MAs detected as MAs. Table 1 demonstrates the
performance of the proposed method and some
existed methods. From Table 1, one can see that our
method can precisely locate MAs with high
sensitivity at low false positive rate.
(a1) (b1)
(a2) (b2)
(a3) (b3)
(a1), (a2), (a3) are MAs labeled by ROC (MAs are circled); (b1),
(b2), (b3) are the MAs detection results of the proposed method
(white dots in squares are detected MAs).
Figure 8: MAs detection results of the proposed method.
Table 1: Comparison of the sensitivity at 1.0 FP per image.
Sensitivity at 1.0 FP
Niemeijer (Niemeijer, 2005) 0.018
Math Morph (Spencer, 1996) 0.072
SRC (Zhang, 2010) 0.13
double-ring (Hatanaka, 2012) 0.15
Proposed Method 0.23
6 CONCLUSIONS
This paper proposes a novel MAs detection method
in color fundus image based on phase information,
ICPRAM2015-InternationalConferenceonPatternRecognitionApplicationsandMethods
162

which including three processes, i.e. preprocessing,
getting MA candidates, and screening MAs. The PC
model is used to get MAs candidates. The obtained
MAs candidates are very near to the true MAs,
which give the good basis for next processing. Then,
the irrelevant information, such as the vessel
fragments, is removed by constructing directional
cross-section profiles. This approach is invariant to
image contrast and brightness, which needs no
enhancement processing. The experiments results on
50 images provided by ROC website show that this
method can accurately detect microaneurysms in
color fundus images.
ACKNOWLEDGEMENTS
This work was supported by the National Nature
Science Foundation of China (NSFC) under grant
No. 61102150 and the Tianjin Science and
Technology Supporting Projection under grant No.
13ZCZDGX02100.
REFERENCES
Spencer, T., Olson, J. A., McHardy, K. C., et al, 1996. An
image-processing strategy for the segmentation and
quantification of microaneurysms in fluorescein
angiograms of the ocular fundus [J]. Computers and
Biomedical Research, 29(4): 284-302.
Hipwell, J. H., Strachant, F., Olson, J. A., et al, 2000.
Automated detection of microaneurysms in digital red-
free photographs: A diabetic retinopathy screening
tool [J]. Diabetic Medicine, 17(8): 588-594.
Fleming, A. D., Philip, S., Goatman, K. A., et al, 2006.
Automated microaneurysm detection using local
contrast normalization and local vessel detection [J].
IEEE Transactions on Medical Imaging, 25(9):1223-
1232.
Walter, T., Massin, P., Erginay, A., et al, 2007. Automatic
detection of microaneurysms in color fundus images
[J]. Medical Image Analysis, 11(6): 555-566.
Sinthanayothin, C., Boyce, J. F., Williamson, T. H., et al,
2002. Automated detection of diabetic retinopathy on
digital fundus images [J]. Diabetic Medicine,
19(2):105-112.
Niemeijer, M., Ginneken, B., Staal, J., et al, 2005.
Automatic detection of red lesions in digital color
fundus photographs [J]. IEEE Transactions on
Medical Imaging, 24(5): 584-592.
Zhang, B., Karray, F., Zhang, L., et al, 2010.
Microaneurysm (MA) detection via sparse
representation classifier with MA and Non-MA
dictionary learning [C]. In IEEE International
Conference on Pattern Recognition, 277-280.
Quellec, G., Lamard, M., Josselin, P. M., et al, 2008.
Optimal wavelet transform for the detection of
microaneurysms in retina photographs [J]. IEEE
Transactions on Medical Imaging, 27(9): 1230-1241.
Hatanaka, Y., Inoue, T., Okumura, S., et al, 2012.
Automated microaneurysm detection method based on
double-ring filter and feature analysis in retinal fundus
images[C]. In 25th International Symposium on
Computer-Based Medical Systems. Rome, 1-4.
Morrone, M. C., Owens, R. A., 1987. Feature detection
from local energy [J]. Pattern Recognition Letters,
6(5): 303-313.
Xiao, Z. T., Hou, Z. X., 2004. Phase based feature detector
consistent with human visual system characteristics
[J]. Pattern Recognition Letters, 25(10): 1115-1121.
Kovesi, P., 1999. Image features from phase congruency
[J]. Journal of Computer Vision Research, 1(3): 1-26.
Lazar, I., Hajdu, A., 2013. Retinal Microaneurysm
detection through local rotating cross-section profile
analysis [J]. IEEE Transactions on Medical Imaging,
32(2): 400-407.
Retinopathy Online Challenge, 2008. http://roc.health-
care.uiowa.edu/.
Gao, W. W., Shen, J. X., Wang, Y. L., 2012. Efficient and
automated detection of microaneurysms from non-
dilated fundus images [J]. Chinese Journal of
Biomedical Engineering, 31(6):839-845.
UsingPhaseCongruencyModelforMicroaneurysmsDetectioninFundusImage
163
