
Brain Activity Quantification for Sport Audiovisual Content
Visualization using EEG
Adri
´
an Colomer
1
, Valery Naranjo
1
, Jaime Guixeres
1
, Juan Carlos Rojas
1
,
Javier Coret
1
and Mariano Alca
˜
niz
1,2
1
Instituto Interuniversitario de Investigaci
´
on en Bioingenier
´
ıa y Tecnolog
´
ıa Orientada al Ser Humano,
Universitat Polit
`
ecnica de Val
`
encia, I3BH/LabHuman, Camino de Vera s/n, 46022, Valencia, Spain
2
Ciber, Fisiopatolog
´
ıa de Obesidad y Nutrici
´
on, CB06/03 Instituto de Salud Carlos III, Valencia, Spain
Keywords:
Human Behaviour, Cerebral Activity, Sport, Football, EEG, GFP, ICA, ADJUST.
Abstract:
This study aims to analyse the brain activity occurring during the observation of football videos randomly
intermingled in a documentary. The electroencephalography recording is employed to measure the signal scalp
of 20 healthy subjects. The signal preprocessing is performed using Independent Component Analysis (ICA)
and ADJUST. The cerebral activity is quantified through Global Field Power (GFP) in order to classify the
clips following an emotive scale, to establish differences between positive and negative video stimuli. Results
are summarized as follows: (1) Comparing the cerebral activity of a positive video with its predecessor neutral
stimulus, significant differences were obtained (p = .0019). However, the same analysis for negative videos
shows no significant differences (p = .096). (2) The number of peaks in brain activity allow us to classify the
videos used in the study. (3) The brain activity in theta and beta bands presents different distribution of peaks,
occurring at different frames.
1 INTRODUCTION
Today there is an increasing interest in understanding
the human behaviour in certain situations. Using var-
ious sensors it is possible to collect physiological sig-
nals from people and to obtain metrics that quantify
feelings, emotions, and memory among others (Su-
laiman et al., 2010; Sulaiman et al., 2011; Brouwer
et al., 2011; Norhazman et al., 2012).
Researchers within the consumer neuroscience
community promote the view that findings and meth-
ods from neuroscience complement and illuminate
existing knowledge in consumer research in order
to better understand consumer behaviour (Klucharev
et al., 2008). In the literature, there are recent inter-
esting works (Vecchiato et al., 2010a; Vecchiato et al.,
2010b) where Electroencephalography signal (EEG),
Galvanic Skin Response (GSR) and Heart Rate (HR)
were employed to analyse the brain activity during the
”naturalistic” observation of commercial ads.
In this paper, the same methodology used in the
observation of commercials has been applied to a new
field, sport, of vital importance to society.
The present work is a preliminary study that anal-
yses the brain activity occurring during the observa-
tion of football videos randomly intermingled in a
documentary in order to understand the behaviour and
feelings of fans when they are watching a match in the
stadium and when they are enjoying a title earned by
their football clubs.
The experimental questions to be studied in this
work are the following:
• Are there differences in cerebral activity during
the observation of positive and negative emotional
videos?
• May the cerebral activity be objectively quantified
and may this objective measurement be used to
sort all videos from low to high emotionality?
• Is it possible to automatically determine the video
frames that produce a significant increase or de-
crease in cerebral activity?
The paper is organized as follows: in Section 2 the
main stages of the proposed method are described,
including information of participants, the experimen-
tal design of the study and the procedures for EEG
recording and analysis. Section 3 shows the experi-
mental results and discussion. Finally, Section 4 pro-
vides conclusions and some future work lines.
145
Colomer A., Naranjo V., Guixeres J., Rojas J., Coret J. and Alcañiz M..
Brain Activity Quantification for Sport Audiovisual Content Visualization using EEG.
DOI: 10.5220/0005184001450149
In Proceedings of the International Conference on Bio-inspired Systems and Signal Processing (BIOSIGNALS-2015), pages 145-149
ISBN: 978-989-758-069-7
Copyright
c
2015 SCITEPRESS (Science and Technology Publications, Lda.)
2 METHODS
2.1 Subjects
In the experiment twenty Valencia C.F fans were in-
volved (18 males and 2 females), aged between 22 to
50 years old. However, EEG data from one male par-
ticipant were removed due to corrupted data. The cor-
rupted data caused standard deviation greater than av-
erage value for Theta and Beta bands. Therefore, the
study consisted of 17 males and 2 females. All partic-
ipants had normal or corrected-to-normal vision and
hearing. They had not participated in a brain study
before. Participants were duly informed about the en-
tire protocol of the study before signing the consent
form.
2.2 Experimental Design
The procedure of the experimental task consisted in
observing a thirty-minute documentary of Valencia
city sequences in which three Valencia C.F video
blocks of two minutes were inserted: the first one
after eight minutes from the beginning, the second
one in the middle and the last one at the end of
the trial. Each of these blocks was formed by two
emotional videos of important moments of the foot-
ball team history. These videos were randomly dis-
tributed within the blocks according to one of the
following configurations: positive-positive, positive-
negative, negative-positive, negative-negative. Dur-
ing the whole documentary, a total of six emotional
videos were presented. The chosen clips showed
highlights of the club’s history, for example: Two
Champions’ League’s finals that the team lost (2000
and 2001), the titles won in the 2003-2004 season (
Spanish League and UEFA cups), the goals scored in
the last season and some sequences of club’s junior
teams. Randomization of the occurrence of Valencia
C.F videos within the blocks was made to remove the
factor ”sequence” as possible confounding effect in
the later analysis.
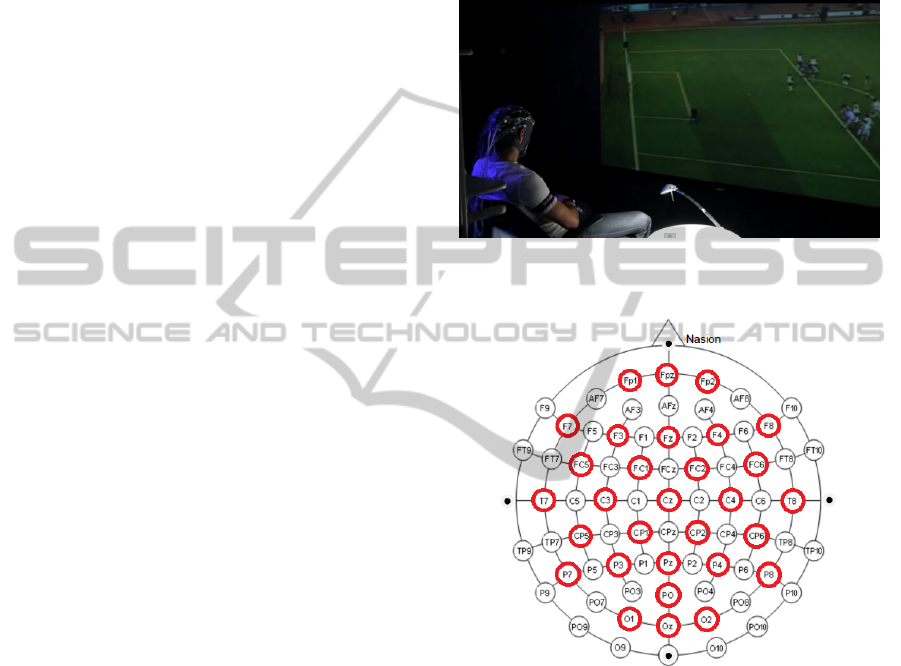
2.3 EEG Recording
The cerebral activity was recorded by means of a sta-
tionary 32-channel system (TMSI hardware and Neu-
rolab Software) Ag/AgCl water based electrode. All
subjects were comfortably seated on a reclining chair,
in an electrically-shielded, dimly-lit lab room. They
watched the audiovisual content of the experiment on
a large screen through a projector with the purpose
of simulating that the subject was at the football sta-
dium in stimulating phases (Figure 1). EEG activ-
ity was collected at a sampling rate of 256 Hz while
impedances kept below 5kΩ. For the experiment, we
used thirty electrodes and the bracelet ground located
on the opposite wrist to the habitual subject hand.
The montage followed the International 10-20 system
(Sanei and Chambers, 2007) and is shown in Figure
2.
Figure 1: Subject using the 32-channel system in the exper-
iment.
Figure 2: Position of electrodes used following 10-20 Inter-
national system.
2.4 EEG Analysis
First, the baseline of EEG traces was removed and
the output dataset was band pass (0.5 - 40 Hz) fil-
tered. Then, the corrupted data channels were rejected
and the stimuli events were integrated into the data
in order to segment the EEG signal. Next step was
to calculate the kurtosis of the extracted segmenta-
tion epochs in order to reject the epochs with high
kurtosis level. Later, Independent Component Anal-
ysis (ICA) was applied to detect and remove com-
ponents due to eye movements, blinks and muscular
artefacts using a electroencephalography software in
Matlab (EEGLAB) (Delorme and Makeig, 2004). An
automatic method (ADJUST) (Mognon et al., 2011)
BIOSIGNALS2015-InternationalConferenceonBio-inspiredSystemsandSignalProcessing
146

was used to discriminate the artefacted components
of EEG signals by combining stereotyped artefact-
specific spatial and temporal features.
Each artefact-free trace EEG was band pass fil-
tered twice in order to isolate the only spectral com-
ponents in theta (4 - 7 Hz) and beta (13 - 24 Hz)
bands. These frequency bands are associated with hu-
man memorization process (Vecchiato et al., 2010a;
Vecchiato et al., 2010b).
The record obtained directly from the scalp shows
intra-cranial synchronous activation of many neurons.
To quantify the amount of cerebral activity the Global
Field Power (GFP) (Lehmann and Skrandies, 1980)
was employed using (1).
GFP =
s
∑
N
e
i=1
∑
N
e
j=1
(u
i
− u
j
)
2
N
e
(1)
where u
i
is the potential at the electrode i (over time),
u
j
is the potential at the electrode j (over time) and N
e
is the total number of electrodes employed to compute
the GFP.
Frontal areas are the cerebral locations mainly in-
volved in the phenomena we are interested in inves-
tigating (Vecchiato et al., 2010a). Thus, the frontal
electrodes were used to compute GFP, concretely the
signals coming from the following frontal, pre-frontal
and central electrodes of the 10-20 International sys-
tem (Fp1, Fpz, Fp2, F7, F3, Fz, F4, F8, Fc5, Fc1,
Fc2 and Fc6) were taken into account in the calcula-
tion. A GFP signal was then calculated for each band
considered in the experiment, theta and beta. Finally,
these GFP signals were normalized according to (2),
obtaining the corresponding Zscore measurements.
Zscore =
GFP
i
− GFP
B
σ(GFP
B
)
(2)
where GFP
i
is the Global Field Power during the
stimulus under analysis, GFP
B
is the GFP mean dur-
ing a period of two-minute neutral documentary, con-
sidered as baseline, and σ(GFP
B
) is the standard de-
viation of the same period.
For each positive and negative stimulus and sub-
ject the most significant peaks for Zscore variables
were obtained, considering a peak all values that ex-
ceeds the threshold of Zscore >= 3, associated with
a p < 0.05 in the gaussian curve fitted over Zscore
distribution (averaged for all participants).
In this way, two parameters were calculated: the
number of peaks inside the time window defined by
the clip duration (N p
s
) and the number of peaks inside
a window of the same length during the visualization
of the documentary immediately preceding the stim-
ulus under analysis (N p
ps
). Figure 3 shows the EEG
traces for a subject during an interval of the exper-
iment. Blue bars delimit the block of documentary
previous to the stimulus under analysis and red bars
delimit the stimulus. N p
s
and N p
ps
were obtained
only considering the yellow window shown in Fig-
ure 3, because both time intervals (pre-stimulus and
stimulus) must have the same length.
Figure 3: Temporal window in stimulus and pre-stimulus.
Besides N p
s
and N p
ps
, an average value of
Zscore, Zscore, was calculated for subject and stimu-
lus by means of:
Zscore =
1
N
∑
n∈W
Zscore[n],
where W is a window of duration N (stimulus length).
These parameters, Zscore, N p
s
and N p
ps
, were
obtained for both bands of interest (theta and beta).
3 RESULTS AND DISCUSSION
In this section two different kind of results will be
shown. Firstly, the results of the Zscore evolution for
a typical subject will be presented, showing moreover
the results of peak detection as well as the frames cor-
responding to these peaks of activation (key frames).
Besides that, the statistical analysis of Zscore and N p
s
versus N p
ps
was performed by using the Analysis of
Variance (ANOVA) for different factors.
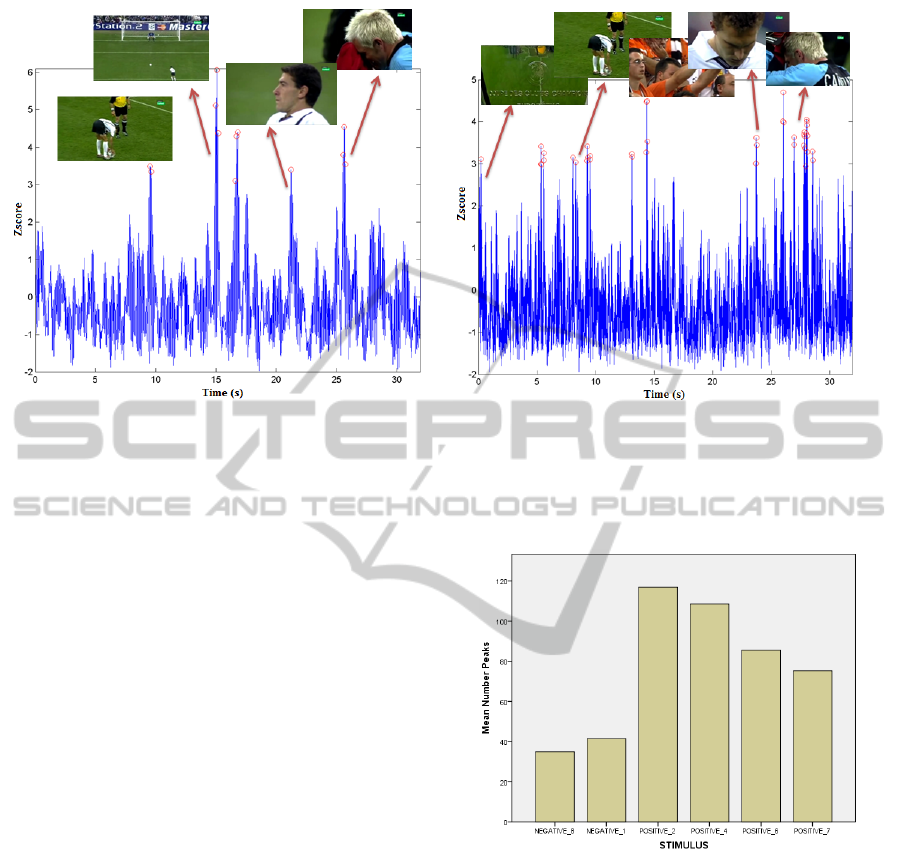
3.1 GFP Evolution
Figure 4 shows the typical responses of the Zscore
variable obtained by the GFP of frontal electrodes in
theta (Figure 4.a) and beta (Figure 4.b) bands for a
representative Valencia C.F fan during the observa-
tion of a emotionally negative video within the doc-
umentary. As can be seen, the Zscore in each band
presents different response, showing different num-
ber and distribution of peaks, occurring at different
frames of the stimulus (Vecchiato et al., 2010a).
BrainActivityQuantificationforSportAudiovisualContentVisualizationusingEEG
147
(a) (b)
Figure 4: Responses of the Zscore computed on frontal electrodes in theta (a) and beta (b) frequency bands and peaks of
cerebral activity (Zscore >= 3) with the corresponding keyframes detected for a representative subject during the observation
of a negative emotional video within the documentary.
3.2 Differences Between Stimuli
As mentioned in the introduction section of this work,
another purpose of this study was to explore the pos-
sibility of distinguishing between the emotional char-
acter of the stimuli (positive or negative) by means
of cerebral activity quantification. Significant differ-
ences (F = 6.054, p = .0019) were obtained when the
mean number of peaks (N p
s
) of positive emotional
videos was compared with the mean number of peaks
of the predecessor neutral stimulus (N p
ps
). However,
when the same comparison for negative stimuli was
done, the results were not significant (F = 2.916 , p =
.096). The average of Zscore was computed but not
significant differences were obtained in the statistical
analysis.
For the classification of the different videos em-
ployed in the study according to the brain activity
quantification, the average number of peaks for all
subjects for each video has been used.
According to Figure 5 videos that showed higher
cerebral activity were positive 2 (the UEFA title won)
and positive 4 (the Spanish League title won). Oth-
erwise the two negative videos registered the lowest
number of peaks therefore the lowest cerebral activ-
ity. A negative video is emotional for subjects be-
cause they remember those moments but a positive
video is more rewarding for them.
Figure 5: Average number of peaks measured at each stim-
ulus.
4 CONCLUSIONS
Results of the present study suggests the following
answers to the questions elicited in the introduction
section:
• After analysing all stimuli presented in the ex-
periment using the cerebral activity quantification
based on the number of peaks, a different be-
haviour between positive and negative video has
been found out. Comparing the cerebral activity
of a positive video (N p
s
) with its predecessor neu-
tral stimulus (N p
ps
), significant differences were
BIOSIGNALS2015-InternationalConferenceonBio-inspiredSystemsandSignalProcessing
148

obtained. However, the same analysis for nega-
tive videos doesn’t show significant differences.
An increase in brain activity was recorded when
positive emotions are stimulated.
• The quantification of the brain activity has been
performed using GFP. As a result, an emotional
classification of the videos was made taking into
account the average number of peaks across the
subjects for each stimulus. As it was shown in
previous question, an increase in cerebral activity
occurs while the positive videos are displayed.
• Using the Zscore index obtained from the GFP, it
is possible to analyse frame by frame each video
in order to study the moments of the video where
the subject shows higher cerebral activity (key
frames). Zscore in theta and beta bands presents
different distribution of peaks, occurring at differ-
ent frames. The key frames detected for most of
the subjects were the same, showing similar pat-
terns. Celebration of goals and titles by players
and fans were the frames where the highest brain
activity was measured.
In conclusion, the football videos analysed in this
study provoked an increase in the cerebral activity in
relation to the viewing of the documentary. More-
over, during the visualization of positive videos the
subjects experimented on average an increase in cere-
bral activity higher than the experimented during the
visualization of negative videos.
In future research, observations and conclusions
of this work will be widely validated. The human be-
haviour in diverse audiovisual content will be evalu-
ated in order to understand better the emotions and
feelings processed in the brain.
ACKNOWLEDGEMENTS
This work has been possible by the collaboration
of Valencia C.F S.A.D. with i3bh/LabHuman re-
search group and partially by projects Consolider-C
(SEJ2006 14301/PSIC), “CIBER of Physiopathology
of Obesity and Nutrition, an initiative of ISCIII” and
Excellence Research Program PROMETEO (Gener-
alitat Valenciana. Conselleria de Educaci
´
on, 2008-
157).
REFERENCES
Brouwer, A.-M., Neerincx, M., Kallen, V., Van Der Leer,
L., and ten Brinke, M. (2011). Eeg alpha asymmetry,
heart rate variability and cortisol in response to virtual
reality induced stress. Journal of Cybertherapy and
Rehabilitation, 4(1):27–40.
Delorme, A. and Makeig, S. (2004). Eeglab: an open
source toolbox for analysis of single-trial eeg dynam-
ics. Journal of Neuroscience Methods, 134:9–21.
Klucharev, V., Smidts, A., and Fernandez, G. (2008). Brain
mechanisms of persuasion: How ”expert power” mod-
ulates memory and attitudes. Soc Cogn Affect Neu-
rosci, 3(4):353–366.
Lehmann, D. and Skrandies, W. (1980). Reference-free
identification of components of checkerboard-evoked
multichannel potential fields. Electroencephalogra-
phy and clinical neurophysiology, 48(6):609–621.
Mognon, A., Jovicich, J., Bruzzone, L., and Buiatti, M.
(2011). Adjust: An automatic eeg artifact detector
based on the joint use of spatial and temporal features.
Psychophysiology, 48(2):229–240.
Norhazman, H., Mohamad Zaini, N., Taib, M. N., Omar,
H. A., Jailani, R., and Lias, S. (2012). Behaviour of
eeg alpha asymmetry when stress is induced and bin-
aural is applied. In International Symposium on Com-
puter Applications and Industrial Electronics (ISCAIE
2012), pages 297–301, Kota Kinabalu, Malaysia.
Sanei, S. and Chambers, J. A. (2007). EEG Signal Process-
ing. Wiley.
Sulaiman, N., Taib, M. N., Aris, S. A. M., Hamid, N. H. A.,
Lias, S., and Murat, Z. H. (2010). Stress features
identification from eeg signals using eeg asymmetry
& spectral centroids techniques. In Biomedi-
cal Engineering and Sciences (IECBES), 2010 IEEE
EMBS Conference on, pages 417–421. IEEE.
Sulaiman, N., Taib, M. N., Lias, S., Murat, Z. H., Aris,
S. A. M., and Hamid, N. H. A. (2011). Novel meth-
ods for stress features identification using eeg signals.
International Journal of Simulation, Systems, Science
and Technology, 12(1):27–33.
Vecchiato, G., Astolfi, L., De Vico Fallani, F., Cincotti, F.,
Mattia, D., Salinari, S., Soranzo, R., and Babiloni, F.
(2010a). Changes in brain activity during the observa-
tion of tv commercials by using eeg, gsr and hr mea-
surements. Brain Topogr, 23(2):165–79.
Vecchiato, G., Astolfi, L., Tabarrini, A., Salinari, S., Mattia,
D., Cincotti, F., Bianchi, L., Sorrentino, D., Aloise, F.,
Soranzo, R., and Babiloni, F. (2010b). Eeg analysis
of the brain activity during the observation of com-
mercial, political, or public service announcements.
Comp. Int. and Neurosc.
BrainActivityQuantificationforSportAudiovisualContentVisualizationusingEEG
149
