
Mobility Assessment of Demented People Using Pose Estimation
and Movement Detection
An Experimental Study in the Field of Ambient Assisted Living
Julia Richter, Christian Wiede and Gangolf Hirtz
Department of Electrical Engineering and Information Technology
Chemnitz University of Technology, Reichenhainer Str. 70, 09126 Chemnitz, Germany
Keywords:
Pose Estimation, Stereo Vision, Image Understanding, Video Analysis, 3-D Image Processing, Machine
Learning, Support Vector Machine, Ambient Assisted Living.
Abstract:
The European population will steadily be growing older in the following decades. At the same time, the risk of
getting dementia increases with higher age. Both these factors are apt to cause serious problems for the society,
especially with regard to the caring sector, which also suffers from the lack of qualified personnel. As technical
support systems can be of assistance to medical staff and patients, a mobility assessment system for demented
people is presented in this paper. The grade of mobility is measured by means of the person’s pose and
movements in a monitored area. For this purpose, pose estimation and movement detection algorithms have
been developed. These process 3-D data, which are provided by an optical stereo sensor installed in a living
environment. In order to train and test a discriminative classifier a variety of labelled training and test data
was recorded. Moreover, we designed a discriminative and universal feature vector for pose estimation. The
experiments demonstrated that the algorithms work robustly. In connection with a human machine interface,
the system facilitates a mobilisation as well as a more valid assessment of the patient’s medical condition than
it is presently the case.
1 INTRODUCTION
The increasing life expectancy is an important
achievement of modern medicine. Over the com-
ing years, the number of elderly people will contin-
ually rise and with it the number of demented peo-
ple (Berlin Institut f
¨
ur Bev
¨
olkerung und Entwicklung,
2011). Due to this development, care facilities will
encounter challenges in maintaining the quality of hu-
man care.
People in an early state of dementia should remain
in their familiar household as long as possible in or-
der to mitigate these problems. The encouragement
of their cognitive, social and physical functions will
also help to keep their quality of life at high level.
Next to activation, assessing the need of care in regu-
lar intervals is another task medical experts are facing.
Since the health status of a person is examined only
irregularly at present, the result is highly dependent
on the form on the inspection day and might be fur-
ther influenced by the fact that patients can prepare for
the inspection. Additionally, many patients put par-
ticular concern on personal hygiene on that day and
when questioned about their physical and psycholog-
ical comfort, they usually feel embarrassed and avoid
talking about their problems. The medical findings
are therefore not always reliable.
In this paper, only persons living alone at home
without the care of a partner are considered. The fo-
cus lies on the physical capabilities of the demented
person – and particularly his or her mobility. This pa-
rameter was measured by the detection of the general
pose (i. e. standing, sitting and lying) and of the per-
son’s movements in the living environment. To this
end, a single, wide angle stereo camera was mounted
at the ceiling. The information gathered about the
general pose and the movements were recorded over
a certain period of time. If long periods of inactivity
were detected, the demented person was encouraged
to do some exercises or to go for a walk. The com-
munication was realized via a human machine inter-
face, i. e. a tablet or a monitor, on which the messages
appeared, optionally in combination with an acoustic
signal. Furthermore, statistics were calculated from
the recorded data. At a later time, such statistics could
be analysed by medical personnel to notice consider-
able changes in a patient’s mobility and to draw reli-
able conclusions about the need of care.
22
Richter J., Wiede C. and Hirtz G..
Mobility Assessment of Demented People Using Pose Estimation and Movement Detection - An Experimental Study in the Field of Ambient Assisted
Living.
DOI: 10.5220/0005178700220029
In Proceedings of the International Conference on Pattern Recognition Applications and Methods (ICPRAM-2015), pages 22-29
ISBN: 978-989-758-077-2
Copyright
c
2015 SCITEPRESS (Science and Technology Publications, Lda.)

2 RELATED WORK
Various works address the subject of supporting el-
derly people in their home environment. The assis-
tance concepts are closely related to the topic of AAL
(Ambient Assisted Living). Their unobtrusive inte-
gration into the living environment is one of the most
important requirement for AAL systems.
Clement et al. detected ADLs (Activities of Daily
Living) with the help of ’Smartmeters’, which mea-
sure the energy consumption of household devices
(Clement et al., 2013). A Semi-Markov model was
trained in order to construct behaviour profiles of
persons and to draw conclusions about their state of
health. Kalfhues et al. analysed a person’s behaviour
by means of several sensors integrated in a flat, e. g.
motion detectors, contact sensors and pressure sen-
sors (Kalfhues et al., 2012). Link et al. employed
optical stereo sensors to discern emergencies, i. e.
falls and predefined emergency gestures (Link et al.,
2013). Chronological sequences of the height of the
body centre and the angle between the main body axis
and the floor were analysed. Belbachier et al., who
also applied stereo sensors to detect falls (Belbachir
et al., 2012), used a neural network-based approach to
classify the fall event. The major advantage of optical
sensors is their easy integration into a flat. A consid-
erable amount of additional information can be ob-
tained by applying image processing algorithms, es-
pecially in connection with RGB-D sensors, which
deliver red, blue and green channel images as well
as depth information. Therefore, we decided to use
a stereo camera in our study. Although other sensors
that provide RGB-D data, such as the Kinect, could
also be installed in a flat, they show features that have
proved to be disadvantageous with regard to the appli-
cation field of AAL: Firstly, if the Kinect is mounted
at the ceiling, the range and the field of view do not
cover the complete room. It would be necessary to in-
tegrate several Kinect sensors at different places in a
flat, which is hardly applicable. Secondly, the resolu-
tion is not sufficient enough for the recognition of ob-
jects that are far away from the sensor. When, thirdly,
several Kinects are installed for better coverage of the
room, they are apt to influence each other, due to their
active technique for determining depth information.
Consequently, although the Kinect is highly perfor-
mant for a variety of applications, we considered this
sensor as unsuitable for AAL purposes.
The approaches listed above either address ADL
detection or emergency scenarios. In the context of
assessing the health status of persons, several former
projects have focused especially on the analysis of
mobility. Scanaill et al. employed body-worn sensors
for mobility telemonitoring (Scanaill et al., 2006).
However, this type of sensor unsuitable for demented
persons, as this group tends to forget to put them on
or puts them off intentionally. In the work of Steen et
al., another way of measuring mobility was presented
(Steen et al., 2013). In first field tests, several partici-
pants’ flats were equipped with laser scanners, motion
detectors and contact sensors. By means of these sen-
sors, the persons could be localised within their flats.
Apart from this, the traversing time between the sen-
sors as well as walking speeds were computed. These
field tests gave evidence that the evaluation of sensor
data allows conclusions about mobility.
In addition to a person’s location and the move-
ments, we think that the pose, i. e. standing, sitting
and lying, provides also an indication of a person’s
mobility. We therefore introduce a pose estimation
algorithm, which detects the pose of a person within
the area observed by a single stereo camera.
There is a variety of pose estimation algorithms
that use optical sensors. They differ, for exam-
ple, with respect to such parameters as camera type
(mono, stereo), inclusion of temporal information and
utilisation of explicit human models. Ning et al.
discerned the human pose using a single monocu-
lar image (Ning et al., 2008). By modifying a bag-
of-words approach, they were able to increase the
discriminative power of features. They also intro-
duced a selective and invariant local descriptor, which
does not require background subtraction. The poses
walking, boxing and jogging could be classified af-
ter supervised learning. Agarwal et al. determined
the pose from monocular silhouettes by regression
(Agarwal and Triggs, 2006) and thus needed nei-
ther a body model nor labelled body parts. Along
with spatial configurations of body parts, Ferrari et
al. additionally considered the temporal information
in their study (Ferrari et al., 2008). Haritaoglu et
al. employed an overhead stereo camera in order to
recognize the ’pick’ movement of customers while
shopping (Haritaoglu et al., 2002). In this study, a
three dimensional silhouette was computed by back-
projecting image points to their corresponding world
points by the use of depth information and calibration
parameters. The persons’ localizations were found at
regions with significant peaks in the occupancy map.
The pose is determined by calculating shape features
instead of using an explicit model. Other approaches
applied the Kinect sensor. Their results proved that
the Kinect, when suitable for the particular applica-
tion, leads to results of high quality. Ye et al. esti-
mated the pose from a single depth map of the Kinect
(Ye et al., 2011). They then compared this map with
mesh models from a database. In a first step, a simi-
MobilityAssessmentofDementedPeopleUsingPoseEstimationandMovementDetection-AnExperimentalStudyinthe
FieldofAmbientAssistedLiving
23

lar pose was searched by point cloud alignment using
principal component analysis and nearest neighbour
search. In a second step, the found pose was refined.
Missing information of occluded parts could be re-
placed by data from the corresponding mesh model.
As a result, skeleton joints comparable to the Kinect
skeleton output could be determined. Another study
addressed the design of a scale and viewing angle ro-
bust feature vector, which describes a person’s head-
to-shoulder signature (Kirchner et al., 2012): Points
between head and shoulder are first assigned to verti-
cal slices. The points within each slice are then pro-
jected to a virtual overhead view and the feature vec-
tor is eventually composed of the slices’ spans. The
authors aim at detecting persons in a 3-D point cloud.
However, this approach can also be adapted and uti-
lized for pose estimation.
3 MOBILITY ASSESSMENT
This section describes the algorithms for movement
detection and pose estimation. First of all, the per-
son has to be detected and localized within the mon-
itored area. Therefore, the stereo camera is extrinsi-
cally calibrated with respect to a defined world coor-
dinate system. The 2-D position is measured in rela-
tion to the origin of this coordinate system. On the
basis of this position, the person is classified as ’mov-
ing’ if the position changes considerably between two
successive frames in a video sequence. The pose esti-
mation requires three steps. Firstly, 3-D points be-
longing to the person are extracted from the back-
projected point cloud. Secondly, discriminative fea-
ture vectors, which allow a reliable classification, are
designed. Finally, a suitable machine learning tech-
nique is selected and a model is trained with feature
vectors generated from training examples.
3.1 Person Localisation
The person localisation is performed on the back-
projected 3-D point cloud obtained from the stereo
camera (Richter et al., 2014). Hypotheses of possi-
ble foreground regions are generated in a first step,
so a mixture of Gaussian algorithm is applied to the
world z-map, which represents the z component, i. e.
the height, of the corresponding world point for every
pixel.
The mixture model is calculated for every pixel in
the map and updated for every new frame according
to the new pixel value. The model was described by
(Zivkovic, 2004) and is expressed as follows:
p(x
(t)
|χ
T
;BG +FG) ∼
M
∑
m=1
ˆ
π
(t)
m
· N(x
(t)
; ˆµ
(t)
m
,
ˆ
σ
2(t)
m
)
(1)
p(x
(t)
|χ
T
;BG + FG) is the probability density func-
tion for the value x of a pixel in the z-map for frame
t with the history χ
T
. This density function models
both the background BG and the foreground FG. M
denotes the number of Gaussian distributions N. Each
distribution is characterised by its mean value ˆµ
(t)
m
and
its variance
ˆ
σ
2(t)
m
.
ˆ
π
(t)
m
denotes the influence of every
single distribution on the mixture model.
In a second step, the points within the foreground
mask are projected on a virtual overhead plan view.
The final determination of the persons’ positions is
executed on this view. The detected person is char-
acterised by a centre point ~p = (x, y, z), the expansion
in each direction – expansion
x
and expansion
y
– and
an orientation α related to the world coordinate sys-
tem. An example of detected persons is illustrated in
Figure 1.
Figure 1: Example point cloud with detected persons
(Richter et al., 2014). Detected persons are visualised via
red cuboids defined by a 3-D centre point and expansions
in each direction. White areas indicate regions, where 3-D
world points cannot be calculated due to the lack of depth
information.
3.2 Movement Detection
For movement detection, only vectors ~p
xy
containing
the x and y component of the 3-D centre point ~p are
processed.
The distance distance
frame
that a person moves be-
tween two frames depends on the f ramerate and can
be estimated with:
distance
frame
= v
movement
·t
frame
=
v
movement
f ramerate
(2)
Provided a person is walking with a speed
v
movement
of at least 0.5 m/s and the frame rate
ICPRAM2015-InternationalConferenceonPatternRecognitionApplicationsandMethods
24

is about 5 FPS, the distance
frame
is estimated at
100 mm. We consider a person to be moving when
a threshold distance of more than X m is covered.
Therefore, we utilize a sliding window containing
the vectors ~p
(t−i)
xy
with i = {0, ..., 4}. Each distance
j
crossed between two successive frames is calculated
according to Equation 3 with j = {0, ...,3}. It is the
Euclidean norm between the person’s position in the
frame t − j and the position in the previous frame
(t − j − 1).
distance
j
=
~p
(t− j)
xy
−~p
(t− j−1)
xy
(3)
Afterwards, the distances are summed up to the
final distance between the five frames of the sliding
window:
distance =
3
∑
j=0
distance
j
(4)
The distance between two frames is only added
to the sum if its value exceeds distance
frame
. Fur-
thermore, the threshold X mentioned above for this
sum is estimated according to the product of the esti-
mated distance between two frames distance
frame
and
the number of distances nDist within the window:
X = distance
frame
· nDist
= 100
mm
frame
· 5frames = 500 mm.
(5)
Moreover, the decision about movement or
non-movement is realised via a finite state ma-
chine consisting of the two states ’movement’ and
’non-movement’. At the transitions, the distance
is compared with two different thresholds T
high
and
T
low
that are slightly lower/higher than the estimated
threshold distance X (hysteresis):
T
high
= 600mm,
T
low
= 400mm.
(6)
The hysteresis suppresses oscillations near the
estimated threshold value. Finally, the value of
movement
(t)
is recorded over time, so that it can be
analysed later. Generally, these threshold values can
be adjusted when conditions in terms of velocity and
frame rate are altering.
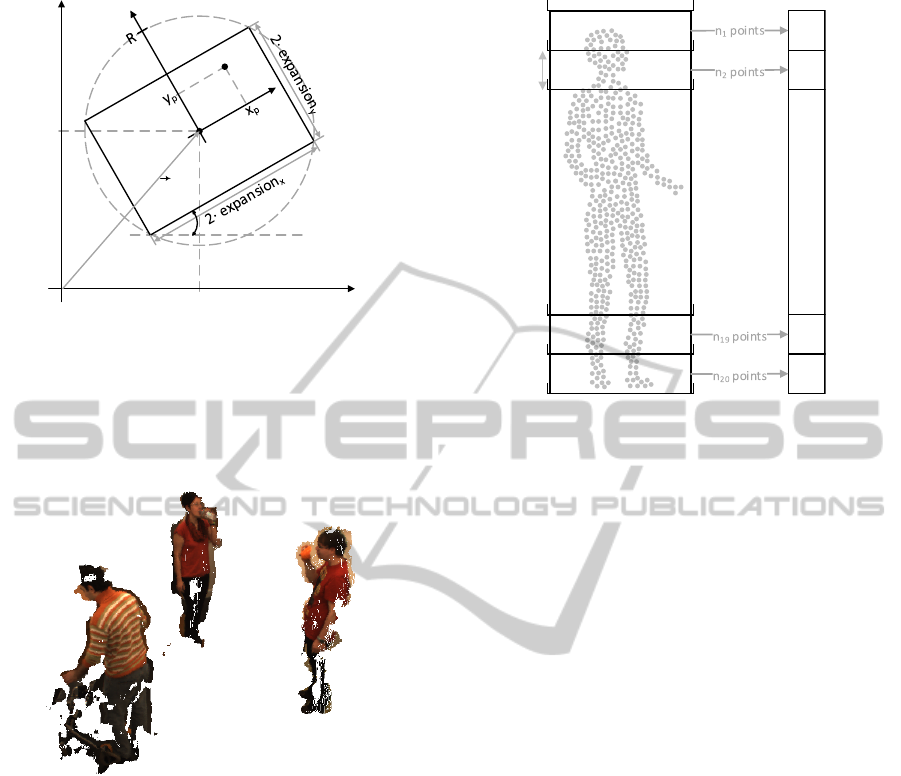
3.3 Pose Estimation
3.3.1 Point Cloud Extraction
The presented pose estimation algorithm processes
3-D world points belonging to the person. Every point
of the point cloud has therefore to be classified as per-
son or non-person. For that purpose, both the previ-
ously calculated cuboid and the foreground mask are
used for classification. The algorithm is outlined in
the following pseudo code, which is performed for
every detected person. The geometric context is il-
lustrated in Figure 2.
R = sqrt(expansion.xˆ2 + expansion.yˆ2);
for all points:
if (foregound
&& z < 2*expansion.z
&& expansion.x < R
&& expansion.y < R )
{
(xT,yT) = CoordinateTransformation(x, y);
if (!( xT < expansion.x
&& yT < expansion.y ))
{
deletePoint(x,y);
}
}
else
{
deletePoint(x,y);
}
Points are removed from the cloud if they belong
neither to the foreground nor to the interior of the
cuboid. In order to reduce processing power, it is first
checked whether a point (x
pc
,y
pc
) is within the per-
son’s radius R. If this is the case, the point is trans-
formed from the world coordinate system (x
w
,y
w
) to
the person’s coordinate system (x
p
,y
p
), which enables
a direct comparison of the point coordinate with the
corresponding expansion expansion
x
and expansion
y
.
The person’s coordinate system is defined by its ori-
gin, namely the 2-D centre point ~p
xy
, and its rotation
angle α.
The remaining points are denoted as the person’s
point cloud points
person
. Figure 3 shows the extracted
point clouds of three persons.
3.3.2 Feature Vector Generation
The determination of a person’s pose is based on the
points extracted in the previous step. In order to train
a machine, a discriminative feature vector has to be
designed first. For that purpose, the point cloud is di-
vided into 20 vertical bins of 110 mm height each,
which start at a z value of -100 mm. During the ex-
trinsic calibration, the origin of the world coordinate
system is set on the floor plane of the room. The plane
formed by the x and the y axis runs parallel to the floor
while the z axis is directed at the ceiling. Therefore,
the floor is defined by a z value around zero. Accord-
ing to their z component, all points are assigned to
one of these bins. Consequently, each bin contains the
MobilityAssessmentofDementedPeopleUsingPoseEstimationandMovementDetection-AnExperimentalStudyinthe
FieldofAmbientAssistedLiving
25
p
xy
y
w
x
w
α
(x
pc
, y
pc
)
Figure 2: Classifying points from the point cloud as per-
son or non-person by means of coordinate transformation.
If a point in the point cloud lies inside the circle defined by
radius R, this very point is transformed from the world coor-
dinate system to the person’s coordinate system. Provided
that the point has been classified as foreground, it belongs
to the person if its x and y component fall below the corre-
sponding expansion.
Figure 3: Point clouds of three persons.
number of points that fall within a certain z range. All
bins together form a feature vector. In a final step, the
feature vector is normalized by dividing every item by
the total number of points n. The process of feature
vector generation is visualised in Figure 4.
3.3.3 Training
After the feature vector generation, a machine was
trained in a supervised manner, i. e. with labelled
training samples . Video sequences with three differ-
ent persons (P3, P4 and P7) were recorded for this
purpose in a laboratory flat and manually labelled
(about 3000 images). Furthermore, a linear Support
Vector Machine (SVM) was chosen. The SVM is
a discriminative, maximum margin classifier. The
term ’discriminative’ means that the variable to be
predicted, i. e. the posterior probability, is modelled
whereas ’maximum margin’ refers to the fact that an
...
n
1
/n
n
2
/n
n
19
/n
n
20
/n
n points
...
2100
-100
110
Figure 4: Feature vector generation from point cloud. All
numbers in mm.
optimization problem is formulated: A separating hy-
perplane has to be determined, so that the margin be-
tween two adjacent classes is maximized. The outer
vectors of the classes form the support vectors. These
are the vectors with the minimum distance to the sep-
arating hyperplane. We decided to use this type of
classifier, because it ranks among the classifiers with
the best performance if the amount of training data is
limited (Bradski and Kaehler, 2008).
3.4 Human Machine Interface
The medical staff can view the statistically prepared
mobility data via a web interface. Additionally, if no
movement is detected over a certain period of time,
which can be specified beforehand, a reminder ap-
pears on a tablet as well as on a touch display. This
touch display might be a TV set, so that the person
is activated while watching TV, for example. In that
way, the person can be immediately addressed in an
unobtrusive way. Examples of such scenarios are il-
lustrated in Figure 5.
4 EXPERIMENTAL RESULTS
In order to determine the performance of the trained
pose classifier, we recorded several test sequences. A
total number of 2958 samples was classified during
the test.
The first test case consisted of realistic scenarios
in the laboratory flat with two elderly volunteers (P1
and P2). In the second test case, we attached high im-
ICPRAM2015-InternationalConferenceonPatternRecognitionApplicationsandMethods
26
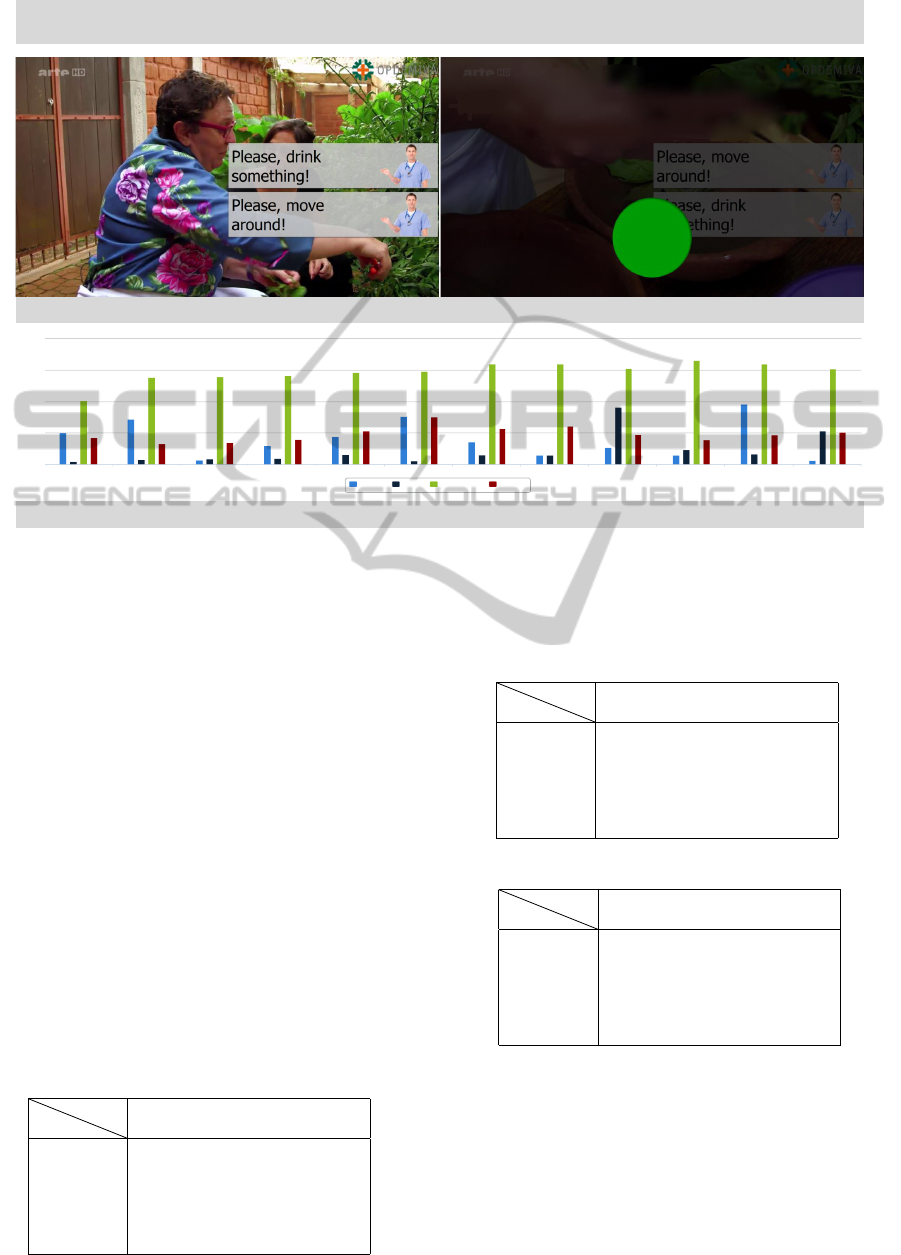
It is 8 p.m., please, take your medication!
Confirm
Human Machine Interface
Interface for patients
Interface for medical experts
Jan Feb Mar Apr May Jun Jul Aug Sep Oct Nov Dec
Standing SittingLying Moving
Frequency
150
100
150
150
200
Figure 5: Design for all: Interface for both patients and for medical personnel. The images at the top show the interface for
the patient. Reminders appear time-controlled. The patient can remove the messages either by touching the display (touch
screen) or by performing the action, e. g. when movement is detected by the sensor. The image at the bottom shows a graph
that presents pose and movements over a month. Other intervals can also be selected.
portance to the fact that the test sequences had been
recorded in a completely different environment com-
pared to the scene where the training sequences have
been recorded. We installed, therefore, a test set-up
with a stereo camera similar to the one in the labora-
tory flat. The sequences were recorded with four per-
sons (P3 - P6), of whom two had already participated
in the training sequences (P3 and P4).
Table 1 shows the results for the elderly persons in
the laboratory flat while Table 2 and Table 3 indicate
the classification results for both types of test persons
in the special test set-up. The letters L and C in the
table headings stand for classified pose and labelled
pose respectively. All numbers are percentages.
The experiments show that the classification re-
sults are of high quality. These first tests also revealed
that the algorithm does work reliably in different sur-
Table 1: Classification results for persons P1 and P2.
C
L
Standing Sitting Lying
Standing 100 0 6.5
Sitting 0 100 0
Lying 0 0 93.5
Table 2: Classification results for persons P3 and P4.
C
L
Standing Sitting Lying
Standing 97.6 0 0
Sitting 0 100 0
Lying 2.4 0 100
Table 3: Classification results for persons P5 and P6.
C
L
Standing Sitting Lying
Standing 100 0 0
Sitting 0 100 1
Lying 0 0 99
roundings and with different persons. The misclassi-
fication rate for ’Lying’ in Table 1 is obviously very
high compared to the other scenarios. This is, how-
ever, caused by the sparse and noisy point cloud at
the place, where the person was lying at this time.
The location was relatively far away from the stereo
sensor, so that the stereo matching algorithm reached
MobilityAssessmentofDementedPeopleUsingPoseEstimationandMovementDetection-AnExperimentalStudyinthe
FieldofAmbientAssistedLiving
27

its limits.
For the purpose of movement evaluation, we
recorded and labelled a video sequence, in which
persons were either walking through the room or
standing somewhere at the spot. We could thus
compare the labels with the output of the algorithm
(moving/non-moving) and calculate the true-positive
rate T PR and the false-positive rate FPR were cal-
culated. mov
detected|neg
denotes the number of frames
where movement was detected although the label was
non-movement, mov
detected|pos
the number of frames
where movement was detected and the label was
movement, mov
neg,labelled
the number of frames la-
belled as non-movement, mov
pos,labelled
the number of
frames labelled as movement.
T PR =
mov
detected|pos
mov
pos,labelled
=
288
298
≈ 96.6% (7)
FPR =
mov
detected|neg
mov
neg,labelled
=
5
193
≈ 2.6% (8)
These values show that significant movements be-
tween different positions in the monitored area are de-
tected by the algorithm.
5 CONCLUSIONS
In this paper, we presented an approach to measure
significant indicators for mobility, i. e. a person’s
pose and movement. The most significant finding
to emerge from this study is that the proposed ma-
chine learning technique works reliably in different
environments and with different persons. In combina-
tion with movement detection (e. g. crossing a room),
conclusions about a person’s mobility can be drawn.
In that way, long-term diagnostics involving mobility
observations can lead to more reliable diagnoses of
the health status, which will result in a better assess-
ment of the need of care. Moreover, activation and
mobilization by means of an HMI can support the de-
mented person in preserving his or her functional abil-
ities.
Further work needs to be done to enhance the sys-
tem by action recognition algorithms. In that way,
it will be possible to monitor and analyse activities
important for the need of care of demented persons.
Such activities are related to nourishment, social con-
tacts and personal hygiene. An essential aspect of our
future studies will be the conduction of field tests in
cooperation with our medical partners. The applica-
tion of the system in the field over a longer period of
time will provide data for a long-term statistical data
analysis and for system validation. Since the focus of
the presented approach lies on the patient, the HMI
has to be attuned to the special needs of demented
people, which shall result in a patient-oriented assis-
tance and assessment system.
With regard to the demographic developments, the
quality of care for demented people has to be ensured.
The proposed approach can contribute to a more valid
assessment and to the preservation of the patient’s
quality of life. Not only would this be of high ben-
efit for our caring sector, but it could also increase the
quality of life of demented persons and their relatives.
ACKNOWLEDGEMENTS
This project is funded by the European Fund for Re-
gional Development (EFRE). Special thanks are fur-
ther expressed to all persons participating in the train-
ing and testing recordings.
REFERENCES
Agarwal, A. and Triggs, B. (2006). Recovering 3D hu-
man pose from monocular images. Pattern Analy-
sis and Machine Intelligence, IEEE Transactions on,
28(1):44–58.
Belbachir, A. N., Litzenberger, M., Schraml, S., Hofstatter,
M., Bauer, D., Schon, P., Humenberger, M., Sulzbach-
ner, C., Lunden, T., and Merne, M. (2012). CARE: a
dynamic stereo vision sensor system for fall detection.
In Circuits and Systems (ISCAS), 2012 IEEE Interna-
tional Symposium on, pages 731–734. IEEE.
Berlin Institut f
¨
ur Bev
¨
olkerung und Entwicklung
(2011). Demenz-Report. http://www.berlin-
institut.org/fileadmin/user upload/Demenz/Demenz
online.pdf. Accessed: 2014-07-07.
Bradski, G. and Kaehler, A. (2008). Learning OpenCV:
Computer vision with the OpenCV library. O’Reilly
Media.
Clement, J., Ploennigs, J., and Kabitzsch, K. (2013). Erken-
nung verschachtelter ADLs durch Smartmeter. Leben-
squalit
¨
at im Wandel von Demografie und Technik.
Ferrari, V., Marin-Jimenez, M., and Zisserman, A. (2008).
Progressive search space reduction for human pose es-
timation. In Computer Vision and Pattern Recogni-
tion, 2008. CVPR 2008. IEEE Conference on, pages
1–8. IEEE.
Haritaoglu, I., Beymer, D., and Flickner, M. (2002). Ghost
3d: detecting body posture and parts using stereo.
In Motion and Video Computing, 2002. Proceedings.
Workshop on, pages 175–180. IEEE.
Kalfhues, A. J., H
¨
ubschen, M., L
¨
ohrke, E., Nunner,
G., Perszewski, H., Schulze, J.-E., and Stevens, T.
(2012). JUTTA–JUsT-in-Time Assistance: Betreuung
ICPRAM2015-InternationalConferenceonPatternRecognitionApplicationsandMethods
28

und Pflege nach Bedarf. In Technologiegest
¨
utzte Di-
enstleistungsinnovation in der Gesundheitswirtschaft,
pages 325–349. Springer.
Kirchner, N., Alempijevic, A., and Virgona, A. (2012).
Head-to-shoulder signature for person recognition. In
Robotics and Automation (ICRA), 2012 IEEE Interna-
tional Conference on, pages 1226–1231. IEEE.
Link, N., Steiner, B., Pfl
¨
uger, M., Kroll, J., and Egeler,
R. (2013). safe@ home–Erste Erfahrungen aus
dem Praxiseinsatz zur Notfallerkennung mit optischen
Sensoren. Lebensqualit
¨
at im Wandel von Demografie
und Technik.
Ning, H., Xu, W., Gong, Y., and Huang, T. (2008). Discrim-
inative learning of visual words for 3D human pose
estimation. In Computer Vision and Pattern Recogni-
tion, 2008. CVPR 2008. IEEE Conference on, pages
1–8. IEEE.
Richter, J., Findeisen, M., and Hirtz, G. (2014). Assess-
ment and Care System Based on People Detection
for Elderly Suffering From Dementia. In Consumer
Electronics Berlin (ICCE-Berlin), 2014. ICCEBerlin
2014. IEEE Fourth International Conference on Con-
sumer Electronics, pages 59–63. IEEE.
Scanaill, C. N., Carew, S., Barralon, P., Noury, N., Lyons,
D., and Lyons, G. M. (2006). A Review of Ap-
proaches to Mobility Telemonitoring of the Elderly in
Their Living Environment. Annals of Biomedical En-
gineering, 34(4):547–563.
Steen, E.-E., Frenken, T., Frenken, M., and Hein, A. (2013).
Functional Assessment in Elderlies Homes: Early Re-
sults from a Field Trial. Lebensqualit
¨
at im Wandel von
Demografie und Technik.
Ye, M., Wang, X., Yang, R., Ren, L., and Pollefeys, M.
(2011). Accurate 3d pose estimation from a single
depth image. In Computer Vision (ICCV), 2011 IEEE
International Conference on, pages 731–738. IEEE.
Zivkovic, Z. (2004). Improved adaptive gaussian mixture
model for background subtraction. In Pattern Recog-
nition, 2004. ICPR 2004. Proceedings of the 17th In-
ternational Conference on, volume 2, pages 28–31.
IEEE.
MobilityAssessmentofDementedPeopleUsingPoseEstimationandMovementDetection-AnExperimentalStudyinthe
FieldofAmbientAssistedLiving
29
