
Exploring the Use of Smartphone Accelerometer and Gyroscope to
Study on the Estimation of Road Surface Roughness Condition
Viengnam Douangphachanh and Hiroyuki Oneyama
Department of Civil and Environmental Engineering, Graduate School of Urban Environmental Sciences,
Tokyo Metropolitan University, 1-1 Minami-osawa, Hachioji, Tokyo, Japan
Keywords: Smartphone Sensors, Accelerometer, Gyroscope, Road Roughness Condition, Condition Estimation.
Abstract: Smartphones are potentially useful to be adopted as a cost-effective and easy to implement tool for the
measurement of road surface roughness condition, which is very essential for road monitoring and
maintenance planning. In this study, an experiment has been carried out to collect data from accelerometers
and gyroscopes on smartphones, which are placed at different locations inside vehicles running on road
sections with different roughness conditions. The collected data is processed in the frequency domain to
calculate magnitudes of the vibration. It has been revealed that at the considered frequency range of 40-
50Hz, there is a very strong relationship between road roughness condition and the magnitudes of vibration,
calculated from each axis of the accelerometers and gyroscopes; as well as the average speed. Road
roughness condition that is modelled as a linear function of the vibration magnitudes, taking into account of
both data from accelerometer and gyroscope as well as the average speed, achieves better estimation than
the model that takes into account the magnitude from the accelerometer and the average speed alone. The
finding is potentially significant for the development of a more accurate model and a better smartphone app
to estimate road roughness condition from smartphone sensors.
1 INTRODUCTION
To properly monitor, plan for maintenance and
manage road infrastructure, substantial amount of
data is always needed, particularly time series and
up to date road condition data. Road condition data
changes over time; since it also usually requires
considerably significant investment and time to
collect the data on a regular basis, obtaining such
data is often a challenge that many governments are
facing, especially in countries where budget is
limited and advance technology is still unaffordable.
Road surface roughness is regarded as one of the
most important road conditions, because it affects
vehicle maintenance costs, fuel consumption,
comfort, and safety. International Roughness Index
(IRI) is an indicator that is widely adopted as a
measurement for road surface roughness condition.
IRI measurement is normally done either by one or a
combination of two main approaches, which include
a subjective rating or a visual inspection, an
approach that is labour intensive and very time
consuming; and the use of sophisticated profilers,
which are highly accurate but costly to obtain,
operate and maintain, requires skilful operators as
well as cumbersome calibration before deployment.
In the smartphone era, where the number of
smartphone users is increasing steadily, using
smartphones to collect road condition data and
estimate road roughness condition could change the
way the government monitor, plan for maintenance
and manage the road infrastructure forever, because
the chance of having plenty of up to date data with
inexpensive investment is huge. On the other hand,
today’s smartphones usually come with sensors that
are capable of recording useful signal for road
surface condition estimation similarly to those used
in many high-tech equipment.
There are some studies that are relevant to this
work, such as the use standalone, mobile and
smartphone sensors to assess and monitor road and
traffic conditions, detect road bumps/anomalies and
their locations, and analyse events/features of
different road defects; in simulation and real-life
traffic conditions (Gonzalez, et al., 2008; Eriksson,
et al., 2008; Mohan, et al., 2008; Tai, et al., 2010;
Menis, et al., 2011; Strazdins, et al., 2011; Perttunen,
et al., 2011). Further development includes the
783
Douangphachanh V. and Oneyama H..
Exploring the Use of Smartphone Accelerometer and Gyroscope to Study on the Estimation of Road Surface Roughness Condition.
DOI: 10.5220/0005117407830787
In Proceedings of the 11th International Conference on Informatics in Control, Automation and Robotics (ICINCO-2014), pages 783-787
ISBN: 978-989-758-039-0
Copyright
c
2014 SCITEPRESS (Science and Technology Publications, Lda.)
introduction of smartphone apps that claim to work
in detecting road bumps (BumpRecorder, 2013) and
roughness condition (Roadroid, 2013). The final
goal of this study, however, is to develop a
significantly simpler app that does not require the
smartphones to be fixed at a specific location, in a
specific orientation, and a troublesome calibration
before use.
Our previous studies (Douangphachanh and
Oneyama, 2013a; 2013b; 2013c) suggest that there
is a strong relationship between the magnitudes of
the vibration from smartphone accelerometers, IRI,
and the average speed. The strength of the
relationship also differs at different frequency
ranges, in which the strongest relationship is
observed at the frequency range of 40-50Hz. Based
on these findings, IRI is roughly modelled as a linear
function of the magnitudes, from accelerometers,
and the average speed.
The main objective of this study is to explore
whether adding gyroscope vibration magnitudes, in
the linear function, would improve the estimation
results, in comparison to the function that only takes
into account the magnitudes from accelerometers
and the average speed, which is included in the
scope of our previous studies. This study only
focuses at the frequency range of 40-50 Hz.
2 APPROACH
2.1 The Experiments
To achieve the objective of this study, we use the
data from the experiment that is conducted in
Vientiane, Laos in November, 2012. In the
experiment, many smartphones and equipment are
set at different location inside experiment vehicles
that run along selected roads to collect data for our
analysis.
Main equipment used in this experiment includes
4 smartphones, 2 Samsung Galaxy Note 3 (GT-
N7100), a Galaxy S3 (GT-I9300), and a LG 4X HD
(LG-P880); a GPS trip recorder (747Pro), and a
Sony video camera.
The smartphones are pre-installed with an
application called AndroSensor (2012). The
application is used to record data from
accelerometers, gyroscopes and GPS. Data recording
is done at an interval of 0.01 second or at a sampling
rate of 100Hz. This sampling rate enables us to
study the magnitudes of the vibration from the
frequency range of 0-50Hz.
The roads selected for the experiment include
various sections with diverse roughness conditions
ranging from good (0≤IRI<4), fair (4≤IRI<7), Poor
(7≤IRI<10), and bad (IRI≥10). These condition
classifications are based on condition indices used in
Lao Road Management System.
We use Vehicular Intelligent Monitoring System
(VIMS, 2012a) to measure the actual roughness
condition of the selected road sections. VIMS
comprises of both hardware, which includes a data
acquisition module, an accelerometer and a GPS
logger, all connected to a laptop computer via
cables; and software, which includes two main
programs, one for calibration and data collection,
and another one for the analysis. The system
calculates the International Roughness Index (IRI)
for every 10 meter road section. The main limitation
of VIMS is that it cannot estimate IRI of road
sections where the travel speed of the experiment
vehicle is less than 20km/h.
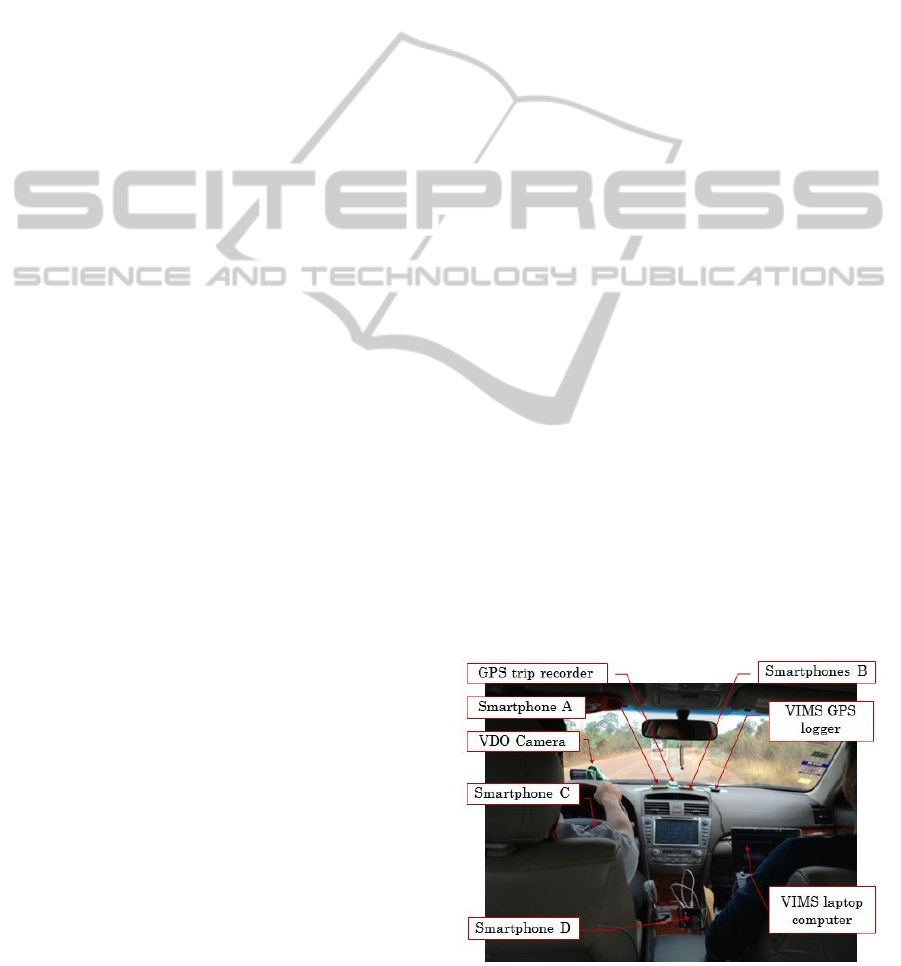
In our experiment setting, we place the
smartphones at 3 different locations, on the
dashboard, inside the driver’s shirt pocket and in a
box near the gearshift (Figure 1). On the dashboard,
two smartphones are glued tightly assuming that the
orientation of the smartphones is fixed (Smartphone
A and Smartphone B), while the other two
smartphones inside the pocket and the box are
allowed to move freely (Smartphone C and
Smartphone D, respectively). It is important to note
that Smartphone C, though can move accordingly
with the driver’s movement, will not change its
orientation. Smartphone D, which is inside the box
near the gearshift, however, may change its
orientation if the vehicles shake violently due to
severe road surface condition. The violent vehicle
shaking does not happen during the course of this
experiment.
Figure 1: The experiment setting.
ICINCO2014-11thInternationalConferenceonInformaticsinControl,AutomationandRobotics
784
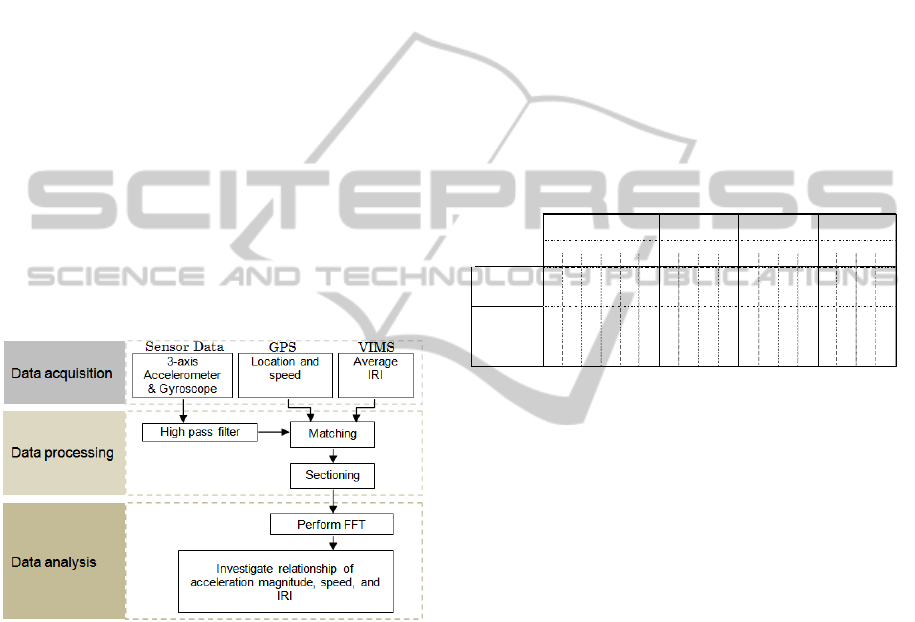
Figure 1 also shows the setting of the GPS and the
video camera, which are also placed on the dash
board. VIMS components are also installed in
accordance to VIMS (2012b).
Four vehicles are used in this experiment, a
Toyota Vigo 4WD pick-up truck as Vehicle 1,
Vehicle 2 is a Toyota Camry sedan, Vehicle 3 is a
Toyota Vigo 2WD pick-up truck, and Vehicle 4 a
Toyota Yaris sedan.
Note that throughout the experiment, the two
Samsung Galaxy Note 3 have been assigned as
Smartphone A and C, the Galaxy S3 has been
assigned as Smartphone B, and the LG 4X HD has
been assigned as Smartphone D. For the Vehicle 1,
Smartphone C and D have been switched their
locations on one occasion during the entire course of
the experiment. See Table 1 for details.
2.2 Data Processing and Analysis
Data processing for this study is similar to those
described in our previous studies. The following
figure (Figure 2) shows the data processing
flowchart:
Figure 2: Data processing and analysis flowchart.
After data is obtained, it is checked and filtered
(high pass) to remove irrelevant data and signal.
Next, the qualified data will be matched with
roughness data before dividing into 100 meter
sections. A 100 meter length of sensors’ data is
chosen as a unit for road roughness estimation in this
study because (i) Road Management System in Laos
requires road pavement condition to be estimated for
every 100 meter section as it is believed to be
convenient for maintenance planning; (ii) there is
also a concern on the accuracy of GPS position data,
therefore choosing a shorter section unit may cause
some issues in data matching between VIMS and
smartphone GPS data.
Also similar to the previous studies, after
sectioning, road sections that have incomplete data
will be excluded from the analysis. The sections
with incomplete data are those that have no data
from VIMS, at the time when the experiment vehicle
is travelling at a speed slower than that required by
VIMS (less than 20km/h) in traffic jam condition,
for instance; and sections that have no GPS data, as
sometimes GPS would fail to record information due
to some satellite signal obstruction. Road sections
where experiment vehicles have stopped (checking
from speed and VIMS data) are also excluded since
data at these sections cannot be used to estimate road
roughness condition. In addition, sections that have
the lengths that are 10% less or more than 100
meters, less than 90 meters or more than 110 meters,
are also omitted from the analysis.
Table 1: Number of road sections by smartphone,
locations, and vehicles.
The analysis is carried out in the frequency
domain using Fast Fourier Transform (FFT) to
calculate magnitudes for every selected 100 meter
section for each axis of the acceleration and
gyroscope vibration. For the sampling rate of 100
Hz, FFT can calculate the magnitudes for each
vibration axis from 0-50 Hz. FFT results allows us
to study the relationship between the magnitudes and
IRI at different ranges of frequency, to see whether
the sum of magnitudes at a particular range of
frequency is more useful in expressing the road
roughness condition or not.
3 RESULTS AND DISCUSSION
The analysis shows that IRI can also be roughly
modelled as a linear function of the magnitudes,
calculated from both accelerometer and gyroscope
data, and the average speed. By adding gyroscope
vibration as an additional parameter in the function,
significant improvement in the estimation of IRI is
observed.
Figure 3 below shows a selected result of a
comparison of IRI estimation for the function that is
taking into account only the average speed and the
magnitudes, from accelerometer (Function 1); and
ABCaCbDaDbABCDABCDABCD
Number of
sections selected
for analysis
703 674 311 246 320 492 497 489 467 592 314 319 309 421 408 411 382 450
Location of
smartphone
Dashboard
Dashboard
Pocket
Near gearshift
Near gearshift
Pocket
Dashboard
Dashboard
Pocket
Near gearshift
Dashboard
Dashboard
Pocket
Near gearshift
Dashboard
Dashboard
Pocket
Near gearshift
Vehicl e 1 : Toyota VIGO
4WD Pick UP
Vehicle 2: Toyota
Camry Sedan
Vehicle 3: Toyota
VIGO 2WD Pick
Vehicl e 4 : Toyota
Yaris Sedan
Smartphone Smartphone Smartphone Smartphone
ExploringtheUseofSmartphoneAccelerometerandGyroscopetoStudyontheEstimationofRoadSurfaceRoughness
Condition
785
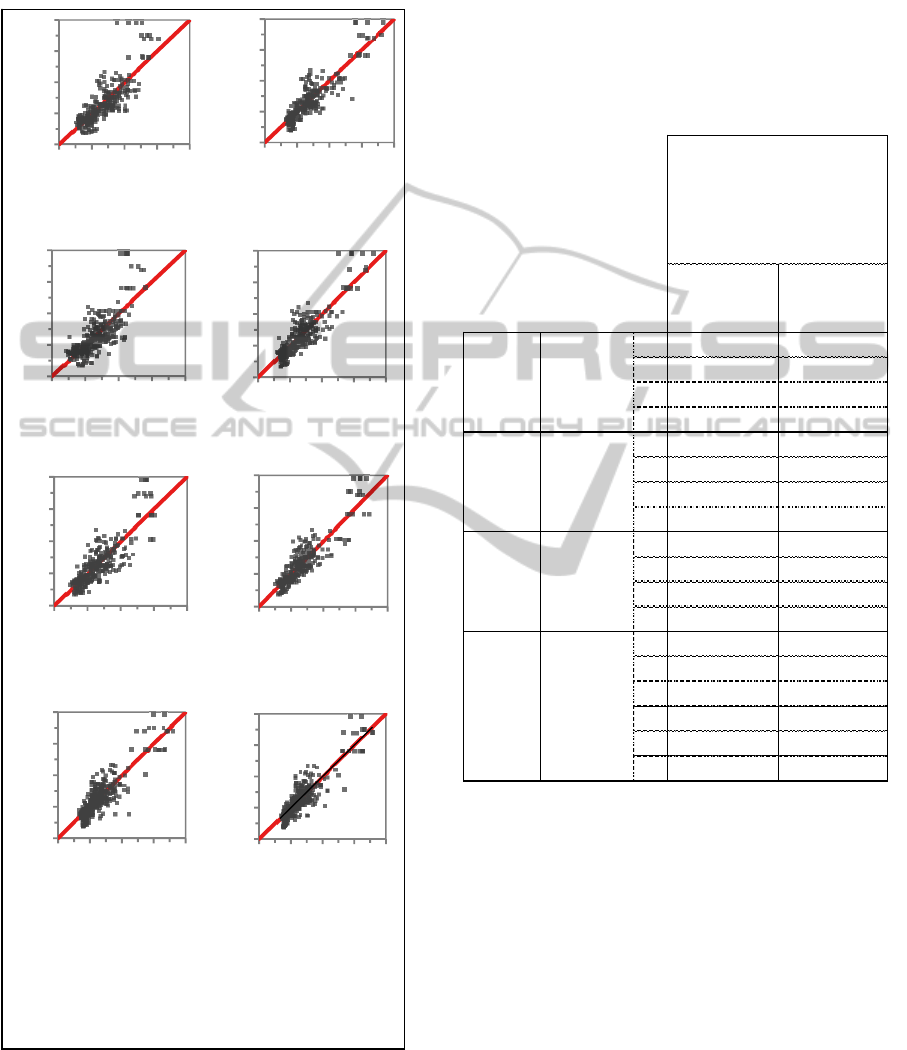
the function that considers the average speed and the
magnitudes from both accelerometers and
gyroscopes (Function 2).
Smartphone A
Smartphone B
Smartphone C
Smartphone D
Note: Graphs on the left hand side are the
estimated by Function 1; while graphs on the right
hand side are estimated using Function 2.
The
frequency range is
40-50Hz. AvgIRI is the
average IRI.
Figure 3: Comparison of estimation results, for all
smartphones in Vehicle 3.
As the figure shows, for all smartphones in
vehicle 3, the R
2
values in the right hand side graphs
are greater than the R
2
values in the left hand side
graphs. This indicates that Function 2 is better than
Function 1. Smartphone B, for instance, the R
2
improves significantly from 0.575 to 0.766 of the
estimation predicted by Function 1 and Function 2,
respectively.
Table 2: Summary of estimation results for both functions,
all smartphones and all vehicles.
Table 2 above summarises R
2
that are derived
from the estimation of Function 1 and Function 2 for
all smartphones and all vehicles. In general, it can be
concluded that R
2
that are estimated by Function 2
are greater than that estimated by Function 1.
Almost all R
2
estimated by Function 2 are greater
than 0.74, while less than half of R
2
estimated by
Function 1 reach that value. The greatest values of
R
2
from Function 2 are as great as 0.8 in four cases
(0.804, 0.806, 0.809, and 0.817 for Smartphone C
Vehicle 4, Smartphone Da Vehicle 1, Smartphone
Ca Vehicle 1, and Smartphone A Vehicle 4,
respectively). In many cases, Smartphone B Vehicle
3, Smartphone D Vehicle 2, and Smartphone B
Vehicle 1, for instances, there are significant
differences between R
2
values estimated by the two
R² = 0,658
0
4
8
12
16
0 4 8 12 16
Actual AvgIRI
Predicted AvgIRI
R² = 0,790
0
4
8
12
16
0481216
Actual AvgIRI
Predicted AvgIRI
R² = 0,575
0
4
8
12
16
0 4 8 12 16
Actual AvgIRI
Predicted AvgIRI
R² = 0,766
0
4
8
12
16
0 4 8 12 16
Actual AvgIRI
Predicted AvgIRI
R² = 0,696
0
4
8
12
16
0 4 8 12 16
Actual AvgIRI
Predicted AvgIRI
R² = 0,792
0
4
8
12
16
0 4 8 12 16
Actual AvgIRI
Predicted AvgIRI
R² = 0,755
0
4
8
12
16
0481216
Actual AvgIRI
Predicted AvgIRI
R² = 0,788
0
4
8
12
16
0 4 8 12 16
Actual AvgIRI
Predicted AvgIRI
Accelerometer
(Function 1)
Accelerometer
and Gyroscope
(Function 2)
A 0.735 0.817
B 0.666 0.735
C 0.790 0.804
D 0.725 0.739
A 0.658 0.790
B 0.575 0.766
C 0.696 0.793
D 0.755 0.788
A 0.616 0.764
B 0.620 0.758
C 0.550 0.694
D 0.520 0.736
A 0.600 0.793
B 0.545 0.736
Ca 0.775 0.809
Cb 0.602 0.618
Da 0.718 0.806
Db 0.594 0.625
Vehicle 2 Smartphone
Vehicle 1 Smartphone
R
2
derived from the estimation
function that takes intoaccount
the average speed and
magnitudes from:
Vehicle 4 Smartphone
Vehicle 3 Smartphone
ICINCO2014-11thInternationalConferenceonInformaticsinControl,AutomationandRobotics
786

functions (0.575 against 0.766, 0.520 against 0.736,
and 0.545 against 0.736, respectively).
4 CONCLUSIONS
In our previous studies, we have investigated the use
of smartphone accelerometers to estimate road
surface roughness condition (IRI) in which
promising results are observed. This study continues
to explore the use of more smartphone sensors,
including the accelerometers and gyroscopes, to
estimate IRI with the final goal of obtaining an
improved estimation model that is acceptably
accurate, simple and easy to implement. An
experiment is carried out to obtain data from the
smartphone relevant sensors. After the data is
processed, FFT is used to calculate the magnitudes
of the vibration. Similar to the findings in our
previous studies, IRI can also be modelled as a
linear function of the average speed and the
magnitudes, calculated from both accelerometers
and gyroscopes. The function can be used to
estimate IRI with an improved accuracy in
comparison to the function that only considers the
average speed and the magnitudes from the
accelerometers alone, which is presented in the
previous studies. The new estimation function is
potentially useful for the development of a
smartphone app, which may contribute to improve
the efficiency of road authorities and government in
obtaining needed data, and monitoring as well as
maintenance planning of the road infrastructure.
In our ongoing studies, more focus is being put
into the formulation, piloting, and improvement of
the final and practicable estimation model.
Additionally, in our future work, great emphasis will
also be directed to the integration of the model into a
smartphone app.
REFERENCES
AndroSensor, 2012. [Smartphone App]. Google Play
Store. Available at: https:// play.google.com/store/
apps/details?id=com.fivasim.androsensor&hl=en.
BumpRecorder, 2013. [Smartphone App]. http://
www.bumprecorder.com/ [Accessed 15 July 2013]
Douangphachanh, V., Oneyama, H., 2013a. A Study on
the Use of Smartphones for Road Roughness
Condition Estimation, Proc. Of the Eastern Asia
Society for Transportation Studies, P297, Vol.9, 2013;
and J. Eastern Asia Society for Transport Studies, Vol.
10, 1551-1564.
Douangphachanh, V., Oneyama, H., 2013b. Using
Smartphones to Estimate Road Pavement Condition,
Paper presented at the 1
st
International Symposium for
Next Generation Infrastructure, Wollongong, NSW,
Australia, October 1-4.
Douangphachanh V., Oneyama, H., 2013c. Estimation of
Road Roughness Condition from Smartphones under
Realistic Settings, Proc. Of the 13
th
International
Conference on ITS Telecommunication (ITST), pp.
433-439.
Eriksson, J., Girod, L., Hull, B., Newton, R., Madden, S.,
Balakrishnan, H., 2008. The pothole patrol: using a
mobile sensor network for road surface monitoring,
Paper presented at the Sixth International Conference
on Mobile System, Applications and Services,
Breckenridge, Colorado, United States, June 17-20.
González, A., O’brien, E. J., Li ,Y. Y., Cashell, K., 2008.
The use of vehicle acceleration measurements to
estimate road roughness. Vehicle System Dynamics,
46(6), 483–499.
Mednis, A., Strazdins, G., Zviedris, R., Kanonirs, G.,
Selavo, L., 2011. Real time pothole detection using
Android smartphones with accelerometers, Paper
presented at the 2011 International Conference on
Distributed Computing in Sensor Systems, Barcelona,
Spain, June 27-29.
Mohan, P., Padmanabhan, V.N., Ramjee, R., 2008.
Nericell: Rich Monitoring of Road and Traffic
Condition using Mobile Smartphones. Proceedings of
the 6
th
ACM Conference on Embedded Network Sensor
Systems, 323-336.
Perttunen, M., Mazhelis, O., Cong, F., Kauppila, M.,
Leppänen, T., Kantola, J., Collin J., Pirttikangas, S.,
Haverinen, J., Ristaniemi, T., 2011. Distributed road
surface condition monitoring using mobile phones.
Ubiquitous Intelligence and Computing, 64–78.
Roadroid. 2014. [Smartphone App]. http://
www.roadroid.se/ [Accessed 9 December 2013]
Sayer, M. W., Gillespie, T. D., Queiros, C. A. V., 1986.
International Road Roughness Experiment. The World
Bank. Available at: http://deepblue.lib.umich.edu/
bitstream/handle/2027.42/3134/72773.pdf;jsessionid=2D5
5BF78AABCA31452E6A59CD28D17C1?sequence=2
[Accessed 12 September 2012]
Strazdins, G., Mednis, A., Kanonirs, G., Zviedris, R.,
Selavo, L., 2011. Towards Vehicular Sensor Networks
with Android Smartphones for Road Surface
Monitoring, Paper presented at the 2
nd
International
Workshop on Networks of Cooperating Objects,
Chicago, USA, April 11.
Tai, Y., Chan, C., Hsu, J. Y., 2010. Automatic road
anomaly detection using smart mobile device, Paper
presented at the 2010 Conference on Technologies and
Applications of Artificial Intelligence, Hsinchu,
Taiwan, November 18-20.
VIMS., 2012a. Vehicle Intelligent Monitoring System,
Bridge and Structure Laboratory, the University of
Tokyo, Japan.
VIMS., 2012b. VIMS Manual, VIMS Consortium,
Nagasaki University, Japan.
ExploringtheUseofSmartphoneAccelerometerandGyroscopetoStudyontheEstimationofRoadSurfaceRoughness
Condition
787
