
Stereo-based Pedestrian Detection in Crosswalks for Pedestrian
Behavioural Modelling Assessment
D. F. Llorca
1
, I. Parra
2
, R. Quintero
1
, C. Fern´andez
1
, R. Izquierdo
1
and M. A. Sotelo
1
1
Computer Engineering Department, University of Alcal´a, Alcal´a de Henares, Madrid, Spain
2
Department of Signal Theory and Communications, Polytechnic University of Madrid, Madrid, Spain
Keywords:
Stereo-vision, Pedestrian Detection, Pedestrian Behaviour, Pedestrian Crossings, Accepted Gap.
Abstract:
In this paper, a stereo- and infrastructure-based pedestrian detection system is presented to deal with
infrastructure-based pedestrian safety measurements as well as to assess pedestrian behaviour modelling meth-
ods. Pedestrian detection is performed by region growing over temporal 3D density maps, which are obtained
by means of stereo reconstruction and background modelling. 3D tracking allows to correlate the pedestrian
position with the different pedestrian crossing regions (waiting and crossing areas). As an example of an
infrastructure safety system, a blinking luminous traffic sign is switched on to warn the drivers about the pres-
ence of pedestrians in the waiting and the crossing regions. The detection system provides accurate results
even for nighttime conditions: an overall detection rate of 97.43% with one false alarm per each 10 minutes.
In addition, the proposed approach is validated for being used in pedestrian behaviour modelling, applying
logistic regression to model the probability of a pedestrian to cross or wait. Some of the predictor variables are
automatically obtained by using the pedestrian detection system. Other variables are still needed to be labelled
using manual supervision. A sequential feature selection method showed that time-to-collision and pedestrian
waiting time (both variables automatically collected) are the most significant parameters when predicting the
pedestrian intent. An overall predictive accuracy of 93.10% is obtained, which clearly validates the proposed
methodology.
1 INTRODUCTION
The European Commission’s goal of reducing road
fatalities by 50% in the period 2000 − 2010 was
almost achieved (actual reduction is estimated to
be 44% (EC, 2012)) and the same target has been
adopted in the period 2010− 2020. Within this con-
text, pedestrians - including people with disabilities
or reduced mobility and orientation - account for the
20% of the fatalities in EU-24 with more than 6.000
pedestrians died in road traffic accidents in 2010.
The 75% of pedestrians fatalities takes place in ur-
ban environments and around the 25% occurs in on
or close to a pedestrian crossing (EC, 2012). Accord-
ingly, new solutions specifically devised to increase
the safety of pedestrians at urban crosswalks can be
of great help to reach this ambitious mid-term goal.
Improvements in pedestrian safety at crosswalks
can be addressed from two perspectives: vehicle
and/or infrastructure. In both cases, the systems have
to be devised to allow reliable detection and track-
ing of pedestrians and other road users. However,
although robust detection and tracking (Parra et al.,
2007) are essential pre-requisites for the successful
development of these systems, they are not suffi-
cient. Hence, besides locating, recognising and track-
ing the pedestrians, the most relevant parameters by
which the intention of the pedestrians to cross or wait
can be unambiguously predicted have to be identified
(Schmidt and Farber, 2009). Thus, accurate pedes-
trian path prediction and action recognition can be
possible from both the vehicle (Keller and Gavrila,
2014), (Quintero et al., 2014), and the infrastructure
(Kohler et al., 2013), allowing the development of
safety measures.
This paper presents the first stage of an
infrastructure-based pedestrian prediction system de-
vised to increase the safety of pedestrians as well as
to facilitate the analysis of the main parameters in-
volved in pedestrians behaviour at crosswalks in nat-
uralistic traffic conditions. A wide-angle stereo-based
pedestrian detection and tracking system has been de-
veloped to be used in both daytime and nighttime
conditions. The different areas of the crosswalk are
102
F. Llorca D., Parra I., Quintero R., Fernández C., Izquierdo R. and A. Sotelo M..
Stereo-based Pedestrian Detection in Crosswalks for Pedestrian Behavioural Modelling Assessment.
DOI: 10.5220/0005055401020109
In Proceedings of the 11th International Conference on Informatics in Control, Automation and Robotics (ICINCO-2014), pages 102-109
ISBN: 978-989-758-040-6
Copyright
c
2014 SCITEPRESS (Science and Technology Publications, Lda.)

previously defined (sidewalks, curbs, and crossing
area). Thus, the system can deal with automatic es-
timation of some of the main parameters with influ-
ence in pedestrians intent (e.g., waiting time, pedes-
trian speed, path changes, number of pedestrians, rel-
ative pedestrian-to-vehicle time-to-collision, accep-
tance gaps, etc.). Although some parameters are still
needed to be obtained by manual supervision (number
of observations at curb, number of observations while
crossing, approximated age, gender, etc.) of video se-
quences, the proposed approach drastically reduces
the time dedicated to this task. Performance results
are provided from three different crosswalks corre-
sponding to the University Campus of the University
of Alcal´a (Alcal´a de Henares, Madrid, Spain). In ad-
dition, the obtained pedestrian behavioural parame-
ters are analysed to validate the proposed approach
for pedestrian behaviour modelling.
The rest of the paper is organised as follows: Sec-
tion 2 describes the state-of-the-art concerning stereo-
and infrastructure-based approaches for pedestrian
detection as well as related work concerned with
pedestrian road crossing behaviour. The stereo-based
pedestrian detection and tracking system is presented
in Section 3. In Section 4 an overview of the main
parameters surveyed and the data collection process
are presented. Experimental results are described in
Section 5. Conclusions and future works are finally
addressed in Section 6.
2 RELATED WORK
Stereo-based pedestrian detection is a well-known
topic in the context of Advanced Driver Assistance
Systems (ADAS) and Intelligent Transportation Sys-
tems (ITS). Vehicle-based pedestrian protection sys-
tems have been recently surveyed in (Ger´onimo and
L´opez, 2014). The use of stereo vision has taken a key
role in this context since it enhances both the region
of interest selection stage (Llorca et al., 2012) and
the classification performance (Keller et al., 2011),
providing depth measurements that are essential for
collision avoidance manoeuvres such as emergency
braking (Milanes et al., 2012) or automatic steering
(Llorca et al., 2011). In the context of infrastructure-
based pedestrian detection, the use of monocular ap-
proaches has been widely proposed since background
subtraction (
´
Alvarez et al., 2014) or motion history
techniques (Kohler et al., 2013) can be directly ap-
plicable. However, accurate depth cues are still
needed to allow the applicability of infrastructure-
based safety measurements including V2I communi-
cations, traffic lights control, etc. Thus, in (Weimer
et al., 2011) a multisensor platform is used to detect
pedestrians at intersections, including laser scanning
systems and far-infrared (FIR) cameras. We also re-
mark the well-known SafeWalk commercial system
(Favoreel, 2011) which is the first stereo-based pedes-
trian detection platform available for its use at urban
intersections. The main drawbacks of this system are
its narrowfield of view and its close range, which lim-
its its use to the pedestrian waiting area at sidewalks.
Accordingly,monitoring a multiple lane crosswalk in-
cluding the pedestrian waiting areas requires at least
two SafeWalk systems for the waiting areas and one
C-Walk (monocular) for the crosswalk. Thus, stereo
measurements are only available at waiting zones. In
this paper we propose the use of a wide-angle stereo-
based pedestrian system able to monitor a two-lane
crosswalk including pedestrian waiting areas.
Considering pedestrian behaviour modelling,
most of the approaches are mainly based on quite
standardised methodologies such as the use of ques-
tionnaires, personal interviews and statistical analysis
of traditional crash data. The use of infrastructure-
based surveillance data from high resolution cameras
or radar sensors, using actors (Schmidt and Farber,
2009) or naturalistic data (Kadali and Vedagiri, 2013)
has been recently proposed allowing the connection
of new relevant variables with the pedestrian’s inten-
tion to cross in the short time. Some examples are:
vehicle-to-pedestrian distance and time-to-collision,
speed, pedestrian gaze frequency and duration before
and while crossing, number of crossing attempts, ac-
cepted gap, etc. It is worth to mention that surveil-
lance data is evaluated in a fully manual fashion,
which clearly limits their applicability and standardis-
ation potentials. In this paper we propose to automat-
ically assess some of these variables by means of the
stereo-based pedestrian monitoring system. Variables
such as time spent at the curb, speed of the pedestrian
while crossing the road, pedestrian speed and path
changes, number of pedestrians in the group, etc., can
be automatically collected.
3 PEDESTRIAN MMONITORING
3.1 System Architecture
The stereo platform is composed of two CMOS cam-
eras with optics of 2.8mm (wide-angle) and a base-
line of 30cm, integrated in a platform that includes
two cameras housing and an IR illuminator directly
controlled by a photocell (see Figure 1). Cameras are
connected by FireWire to an industrial PC. A specific
HW has been devised to control the external trigger
Stereo-basedPedestrianDetectioninCrosswalksforPedestrianBehaviouralModellingAssessment
103
ONͲLINE
OFFͲLINE
Calibration
Regions
selection
TemporalDensityMap
Generation
Undistort&
StereoRectification
Background
Subtraction
Disparitymap
SemiͲGlobal
BlockMatching
Referencechange&
Heightfiltering
Foreground
Masking
TemporalIntegration
Leftundistorted
stereoͲrectifiedimage
PedestrianandVehicle
detection
Regiongrowing
Vehicle/Pedestrian
Classification
Vehicles
Pedestrians
OcclusionReasoning
Tracking
Tracking
Behavior
Parameters
Pedestrian
Behavioral
Modeling
Parameters
Estimation
Safety
Measures
I2Vcommunication,
Infrastructure
actions,etc.
StereoImages
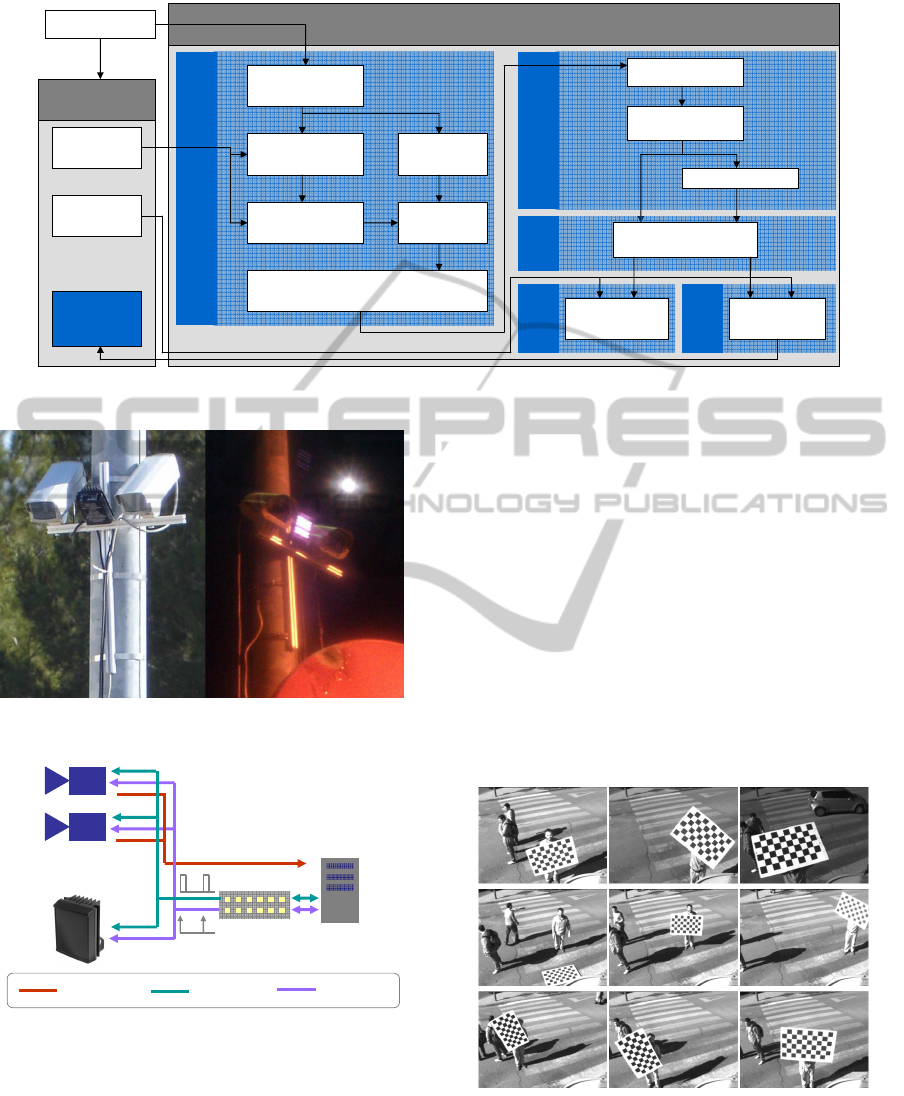
Figure 3: System overview: off-line and on-line tasks.
Figure 1: Stereo platform with IR illuminator.
CMOScameraswith2.8mmoptics
IRIlluminator
Processing
System&
StorageDevices
SensorData
HWShutter HWTrigger
Synchronization
HW
Figure 2: Sensor architecture.
of the cameras and the IR illuminator, including a se-
rial communication with the PC. When the photocell
is activated, the IR illuminator is pulsed with a work
cycle defined by the specific shutter time of both cam-
eras. Note that camera settings such as gain and shut-
ter are automatically adapted to the illumination con-
ditions. Figures 2 and 3 depict the general architec-
ture of the system.
3.2 Stereo-based Pedestrian Detection
The stereo system has to be calibrated first. Since the
platform is expected to be installed once and consid-
ered fixed since then, we only perform one calibra-
tion including intrinsic camera parameters, extrinsic
relationship of the stereo rig, and extrinsic relation-
ship between the left camera and the ground plane.
Both intrinsic and extrinsic parameters are obtained
by means of standard chessboard calibration proce-
dure (see Figure 4. A specific calibration software
that makes use of calibration functions of OpenCV
library has been developed to automatically detect
chessboard corners from each pair of images, and pro-
vide calibration parameters of the stereo rig.
Figure 4: Calibration images used for computing both in-
trinsic and extrinsic stereo rig parameters.
The images of the camera are firstly undistorted
and then stereo-rectified to assure that a point on the
left image produces an horizontal epipolar line at the
same v-coordinate. Then, disparities are computed
ICINCO2014-11thInternationalConferenceonInformaticsinControl,AutomationandRobotics
104
using OpenCV’s semi-global block matching algo-
rithm. The 3D-reconstruction of the scene is thus
referenced to the left camera optical centre. How-
ever, in order to use 3D-measurements in a consistent
fashion to assign the pedestrian position to the dif-
ferent regions (waiting regions and crossing area), a
rigid transformation between the stereo platform and
the ground plane has to be computed. A supervised
procedure has been designed to that effect. First, the
translation vector that includes the height of the cam-
era, and the displacement between the pole and the
crosswalk is manually obtained. Then rotation angles
are adjusted using a manual procedure in which the
operator has to rotate the 3D-map obtained from the
scene to fit the ground plane with a vertical plane us-
ing a bird’s eye view representation. The first step
consists in rotating over the Y-axis to assure that Z-
axis gets parallel to the crosswalk. Thus the yaw angle
is obtained. Then a 90
◦
rotation over the Z-axis is per-
formed including the adjustment needed to minimise
the width of the obtained plane which represents the
roll angle. Finally, pitch angle is estimated by rotat-
ing over the X-axis until the obtained plane appears
in a vertical position. An example of the procedure is
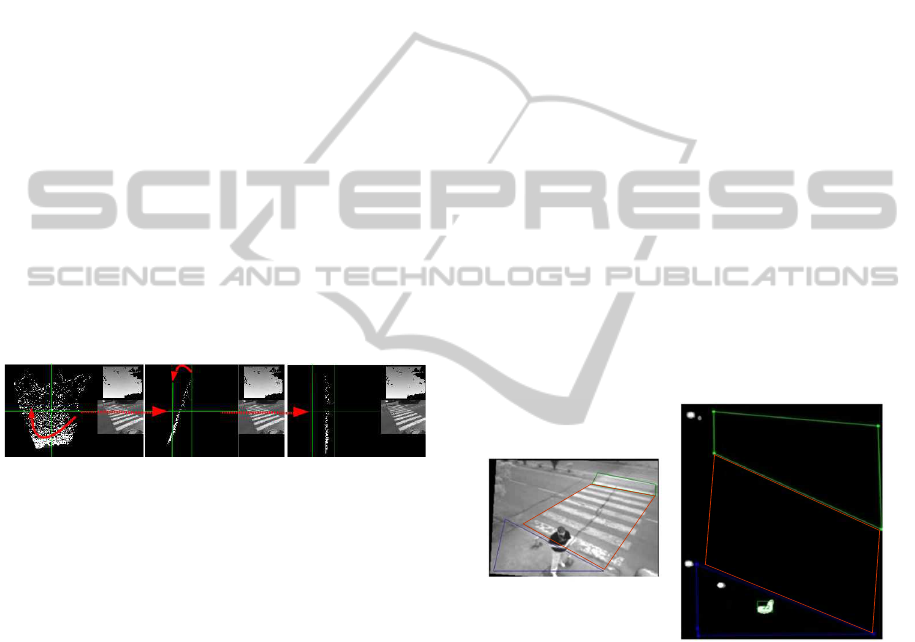
presented in Figure 5.
Figure 5: Manual procedure to obtain the rotation angles.
Left: original bird’s eye view and rotation over the Z-axis.
Middle: pitch correction by rotating over the X-axis. Right:
final result.
The last step corresponding to the manual installa-
tion process consists in defining the pedestrian wait-
ing regions and the crossing area. The regions are
selected using the undistorted left image. The se-
lected image points are considered as pertaining to
the ground plane (Y-coordinate or height is equal to
zero). Thus, the other two components of the 3D po-
sition (lateral position and depth or distance) can be
easily obtained. The selected regions are then trans-
lated into the 3D-map and they will be used to classify
the 3D-position of the detected and tracked pedestri-
ans.
Pedestrian detection is performed by using a den-
sity map or bird’s-eye map. The 3D-points are pro-
jected on a XZ-map (road plane). Considering the
road as flat and taking into account that 3D-points
are related to the road plane, a 3D filtering procedure
is applied to remove points inside the range 0.2m <
Y < 2m. Thus points pertaining to the ground plane
and to very high regions are not considered for pedes-
trian detection. As described in (Nedevschi et al.,
2009), the density map can be seen as an accumulator
buffer. Each projected point within the previously de-
fined height margins (after 3D-filtering) adds a value
to the accumulation buffer. A pixel in the accumu-
lator buffer covers a small area (around 80 × 80mm).
The weights that each point adds to the density map
follow a Gaussian distribution with the maximum at
the centre pixel and decreasing in the neighbouring
pixels. Because the influence of each 3D-point on the
density map is cumulative, the resulting map will con-
tain large values in regions with a high density of 3D
points. In order to reduce the effect of stereo matching
errors, a temporal density map is finally obtained by
integrating the projected points during the last three
frames (around 200msec at 15Hz). An example of
this temporal density map is depicted in Figure 6. As
can be observed, the obtained map includes informa-
tion related with pedestrians and other vertical objects
such as poles, trees, etc. In order to remove static ob-
jects a dynamical background subtraction algorithm
-proposed by the authors in (
´
Alvarez et al., 2012) for
monocular traffic detection- is applied to mask the
disparity map with the foreground objects. The back-
ground is adapted with a learning rate of 0.1 minimis-
ing the probabilities of incorporating pedestrians or
vehicles inside the background model.
Figure 6: Left: undistorted left image with selected regions.
Right: temporal density map of filtered points.
Object segmentation is performed on the filtered-
temporal density map (masking with background sub-
traction result and removing ground plane and very
high 3D-points), using a region-growing algorithm.
The result of the segmentation is a list of object hy-
potheses on the density map. Each candidate is firstly
classified as pedestrian or vehicle analysing their ve-
locities (orientation and speed), size and the image
location of the first appearance in the scene. Some re-
strictions over the minimum and maximum blobs size
are applied to filter small objects and split big objects
classified as pedestrians. The shape of each object
with a size that may correspond to multiple pedestri-
ans is analysed using the occlusion reasoning algo-
Stereo-basedPedestrianDetectioninCrosswalksforPedestrianBehaviouralModellingAssessment
105

Table 1: Collected variables to model pedestrian behaviour.
Variable Type Manual / Description
Automatic
Time-to-collision Cont. M/A Gap time when pedestrian decides to wait or cross
Distance Cont. M/A Gap distance when pedestrian decides to wait or cross
Vehicle Speed Cont. M/A Speed of the vehicle at crosswalk area
Waiting time Cont. A Duration of time spent by a pedestrian for accepting gap
Pedestrian Speed Cont. A Speed of pedestrian while crossing
Curb observ. time Cont. M Duration of pedestrian observing time for accepting gap
Observations curb Cont. M Number of observations made by a pedestrian at the curb
Gender Cat. M Male/Female
Age Cat. M Elders/Middle/Child
Platoon Cat. A Number of pedestrians in the group (1, 2 or >2)
Baggage Cat. M Whether pedestrian is carrying baggage or not
Type of vehicle Cat. M/A Heavy/Car/Powered Two Wheeler
Gap acceptance Cat. A Whether pedestrian at the curb accepts/rejects the gap
*
Cont. = Continuous; Cat. = Categorical; M = Manual; A = Automatic.
rithm presented in (
´
Alvarez et al., 2014) which makes
use of the compactness, the convexity and the convex
hull to divide the blob in multiple blobs (note that this
procedure is only applied to object hypotheses previ-
ously selected as vehicles).
Tracking is carried out using a linear Kalman fil-
ter. The motion of both pedestrians and vehicles are
modelled using a constant velocity model, allowing
accelerations by means of process noise. The state
variables are pixel and 3D positions and their cor-
responding velocities. Only the pixel and the 3D
positions are considered in the measurement vector.
Data association problem is carried out by means of
3D Mahalanobis distance, template matching (nor-
malised cross-correlation) and Hungarian assignment
as in (Parra et al., 2007).
4 PEDESTRIAN BEHAVIOUR
PARAMETERS
Considering pedestrians road crossing behaviour
modelling, the use of surveillance data has been es-
sential to obtain relevantinformation. Gap acceptance
theory played a key role in these studies. Determin-
istic approaches are mainly based on the computation
of a critical gap that assumes that all pedestrian intent
are homogeneous and consistent (Das et al., 2005).
However, in other studies it has been concluded that
gap acceptance behaviour depends on many factors
(Kadali and Vedagiri, 2013), (Koh and Wong, 2014),
(Schmidt and Farber, 2009) leading to the use of prob-
abilistic approaches. This is a more realistic approach
mainly based on the assumption that pedestrian’s min-
imum gap acceptance is a random variable. The prob-
abilistic methods, which can be generativeor discrim-
inative, incorporate intrinsic variables (age, gender,
etc.) and traffic attributes (time-to-collision, relative
distance, type of vehicle, etc.) in order to estimate the
probability of a pedestrian to cross or wait. This prob-
ability has to be consistent with the aforementioned
variables.
In previous approaches all variables are manually
obtained by tedious manual labelling procedures ap-
plied on the surveillance data. However, the stereo-
based pedestrian detection module can be here ap-
plied to automatically obtain some of these variables.
Following similar approaches of previous studies, we
have selected some important variables that are listed
in Table 1. A brief description and some properties of
each variable are depicted in Table 1. The variables
can be continuous or discrete (categorical), and can
be manually or automatically selected. The manual
procedure is based on visual analysis of the video se-
quences, which were recorded at 30Hz. Accordingly,
the accuracy of the temporal measurements can not be
better than 33msec. When vehicles are inside the field
of view of the stereovision system at the time when
the pedestrian is located at the curb, time-to-collision,
relative distance and vehicle speed measurements are
directly obtained using stereo data. However, when
vehicles are out of the stereo field of view, these vari-
ables are estimated using the difference of the time
when the vehicle passed the position where pedestrian
stands assuming a constant velocity model. To over-
come this limitation other sensors would have to be
included to increase the range and the field of view.
Table 1 summarises all the variables obtained to deal
with pedestrian behaviour modelling.
5 EXPERIMENTS
5.1 Pedestrian Detection Results
The proposed infrastructure- and stereo-based pedes-
ICINCO2014-11thInternationalConferenceonInformaticsinControl,AutomationandRobotics
106

Table 2: Datasets global description.
Id. Lighting Duration Pedestrians
Conditions (minutes) Intent
1 Daytime 4,1 30
2 Daytime 9,4 159
3 Nighttime 15,7 70
Total 29,28 259
trian detection system is tested in three different two-
lane unsignalised crosswalks. As can be seen in Fig-
ure 7 the system is installed and configured to cover
the two-lane crossing region and two pedestrian wait-
ing areas. Table 2 summarises the duration (at 30Hz),
lighting conditions and number of pedestrians intent
collected at the three locations.
Figure 7: Three different locations covering the two-lane
crossing region and two pedestrian waiting areas, including
different lighting conditions.
Considering the global architecture of the system
presented in Figure 3 we have devised a safety system
that includes a luminous intermittent traffic signal that
is switched on when pedestrians are waiting or cross-
ing to warn the driver. Accordingly, we define the
following variables:
• True Positives (TP): warning is switched on and
pedestrians are waiting or crossing
• True Negatives (TN): warning is switched off and
no pedestrians are waiting or crossing
• False Positives (FP): warning is switched on and
no pedestrians are waiting or crossing
• False Negatives (FN): warning is switched off and
pedestrians are waiting or crossing
Detection rate (DR) is defined as DR = TP/(TP+
FN). Taking into account the previous definitions,
Table 3 depicts the obtained results. As can be ob-
served the system provides very accurate results even
for nighttime conditions. The number of false posi-
tives remains very low (one per each 10 minutes ap-
proximately). On average, the obtained detection rate
is 97.43%. In addition, we have analysed the detec-
tion delay considering all the true positives. On aver-
age the 80% of all the detected pedestrians were de-
tected in less than 0.33 seconds (less than 10 frames
since the pedestrian is fully visible).
Table 3: Detection Results: Detection Rate (DR) and num-
ber of False Positives (#FP).
Id. Lighting DR # FP
Conditions
1 Daytime 99,79% 1
2 Daytime 97,01% 2
3 Nighttime 97,17% 0
Total 97,43% 3
5.2 Pedestrian Behavioural Modelling
All the variables collected by means of automatic and
manual supervision mechanisms are used to define a
probabilistic model able to reasoning about the pedes-
trian intent (walk or wait?). Although a total of 259
pedestrian intent were collected, the data was unbal-
anced since only 17 rejected gaps were collected. In
addition, a total of 114 accepted gaps corresponded to
groups of more than 2 pedestrians and no one rejected
gap was collected in these cases. In order to alleviate
these effects, we did not take into account data corre-
sponding to groups of pedestrians of more than 2 peo-
ple. Accordingly a total of 17/128 rejected/accepted
gaps were collected. We firstly estimate the distribu-
tion of accepted gaps in terms of time-to-collision. A
log-normal distribution is fitted to the data (see Fig-
ure 8). The obtained results are in concordance with
previous studies (Koh and Wong, 2014).
0 2 4 6 8 10 12
0
0.02
0.04
0.06
0.08
0.1
0.12
Accepted Time To Collision Gap (s)
Density
Histogram of accepted TTC gap
Fitted lognormal distribution
Figure 8: Accepted gap distribution fitted by a lognormal
distribution.
In order to model the decision to accept the gap
a binary logistic regression was used. World state
w ∈ {0,1} is modeled following a Bernouilli distribu-
tion with one parameter λ and contingent to the data
x. In this case the data x corresponds to the variables
described in Table 1. Accordingly, Pr(w = 1) = λ for
accepting the gap and Pr(w = 0) = 1 − λ for reject-
ing the gap. A linear combination of the inputs β
T
x is
used to model the parameter λ using a sigmoid func-
tion to ensure that 0 ≤ λ ≤ 1. Thus, the probability of
accepting the gap contingent to the data is given by:
Stereo-basedPedestrianDetectioninCrosswalksforPedestrianBehaviouralModellingAssessment
107
Pr(w|x, β) = Bern
w
[sig(β
T
x)] =
1
1+ e
−β
T
x
(1)
As proposed by previous studies (Schmidt and
Farber, 2009), (Koh and Wong, 2014), there is a
strong correlation between the time-to-collision and
the road-crossing probability. Accordingly, the first
logistic regression was performed using the time-to-
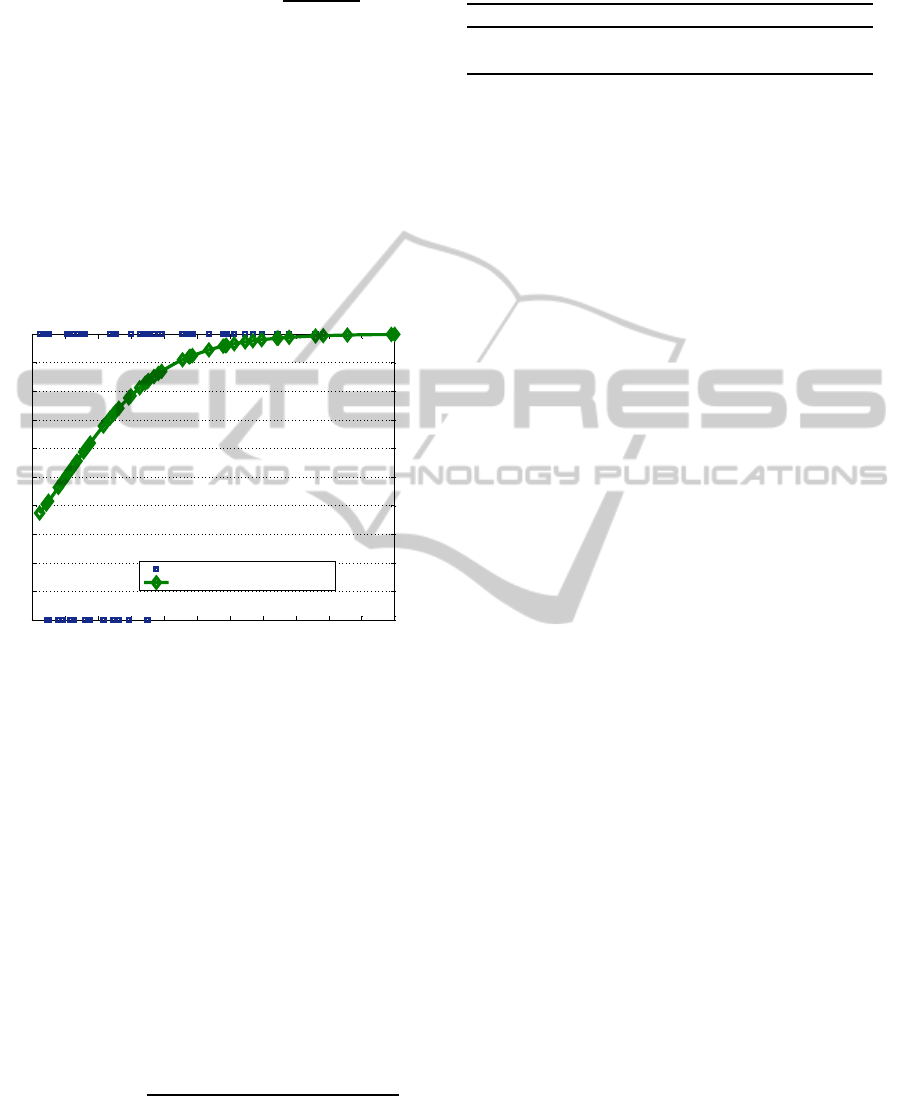
collision as the unique predictor variable. Figure 9
shows the accepted/rejected gaps depending on the
time-to-collision and the logistic regression model.
The time-to-collision variable made a significant con-
tribution to the regression model (p = .0004). The
predictive quality of the overall model was 88.97%
correct classifications.
0 1 2 3 4 5 6 7 8 9 10 11
0
0.1
0.2
0.3
0.4
0.5
0.6
0.7
0.8
0.9
1
Time to Collision (s)
Gap acceptance probability (road-crossing probability)
Pedestrian accepted/rejected gaps
Logistic regression model
Figure 9: Accepted/rejected gaps as a function of the time-
to-collision and logistic regression model obtained.
The probability of accepting gaps was further
modelled using all the variables listed in Table 1. In
order to analyse the significance of each variable, a se-
quential feature selection method was applied. Time-
to-collision is selected as the first variable to enter
into the model. Then, the other independent vari-
ables were put into the model one by one leading to
several candidate feature subsets. A 10-fold cross-
validationis applied to each feature subset. The whole
process stopped until no additional variable can en-
ter the model. Through this process, the variables se-
lected for the final model (see Table 4) were time-to-
collision (TTC) and waiting time (WT) and the fol-
lowing posterior is thus given:
Pr(w = 1|x,β) =
1
1+ e
−0.9772−0.7833TTC+0.6264WT
(2)
The predictive quality of the overall model was
93.10% correct classifications, which represents an
improvement greater than 4% with respect to the
model just based on time-to-collision. Variables such
Table 4: Sequential feature selection results.
Variable β
i
Std. t p
TTC .7833 .2366 3.31 .0009
WT −.62643 .2094 −2.99 .0028
as age, type of vehicle or baggage did not provide a
significant contribution since the 99% of the data cor-
responds to middle age pedestrians, car vehicles and
pedestrian not carrying baggage. Distance and ve-
hicle speed, which have been reported as significant
in other studies (Schmidt and Farber, 2009), are here
not significant. This can be partially explained by the
fact that both variables are integrated in the time-to-
collision variable.
6 CONCLUSIONS AND FUTURE
WORK
In this study we have presented a stereo- and
infrastructure-based pedestrian detection system
specifically designed to deal with infrastructure-
based safety applications as well as to assess
pedestrian behavioural modelling methods. Temporal
density maps are generated by means of stereo
reconstruction, background modelling and temporal
integration. Then, objects are detected using a
region growing algorithm and classified as vehi-
cles/pedestrians or group of pedestrians depending
on the motion, size and first appearance in the scene.
Each pedestrian is then tracked in 3D, allowing the
estimation of his/her position in a set of manually
selected regions corresponding to the pedestrian
waiting areas and the crossing region. As an example
of an infrastructure safety system, a blinking lumi-
nous traffic sign is switched on to warn the drivers
about the presence of pedestrians in the waiting and
the crossing regions. The system runs in real time,
with an overall detection rate of 97.43% and one
false alarm each 10 minutes, including nighttime
conditions (IR illumination).
The use of the stereo-based pedestrian detection
system is extended to assess pedestrian behavioural
modelling. A set of variables are usually collected by
fully manual supervision of surveillance data (video
sequences). However, the proposed scheme allows to
automatically collect some of these variables, easing
this tedious procedure. In order to validate the pro-
posed approach, the decision of a pedestrian to cross
or wait is modelled using logistic regression. Al-
though our data is unbalanced, we obtain results that
are very similar to previous studies in which time-to-
collision (gap) appears as the main contribution fac-
tor. A sequential feature selection method showed
ICINCO2014-11thInternationalConferenceonInformaticsinControl,AutomationandRobotics
108

that by introducing the waiting time dedicated by a
pedestrian in the waiting area as a predictor of the lo-
gistic regression model, the overall predictive qual-
ity increases a 4%, leading to an accuracy of 93.10%,
which clearly validates the proposed methodology.
Future works will be focused on new experiments
with balanced data obtained from different locations
at urban environments. In addition, experimental
comparisons between manual and automatic selection
of several parameters will be performed to validate
the proposed automatic stereo-based pedestrian be-
havioural parameters collection method. Finally, a
more sophisticated probabilistic predictive approach
will be developed and validated to increase the effec-
tiveness of the infrastructure-based safety measure-
ments.
ACKNOWLEDGEMENTS
This work was supported by the Spanish Ministry of
Economy under Grant ONDA-FP TRA2011-27712-
C02-02.
REFERENCES
´
Alvarez, S., Llorca, D. F., and Sotelo, M. A. (2014). Hierar-
chical camera auto-calibration for traffic surveillance
systems. Expert Systems with Applications, 41:1532–
1542.
´
Alvarez, S., Sotelo, M. A., Llorca, D. F., Quintero, R., and
Marcos, O. (2012). Monocular vision-based target de-
tection on dynamic transport infrastructures. Lecture
Notes in Computer Science, 6927:576–583.
Das, S., Manski, C. F., and Manuszak, M. D. (2005). Walk
or wait? an empirical analysis of street crossing deci-
sions. Journal of Applied Econometrics, 20(4):529–
548.
EC (2012). Basic fact sheets 2012. mobility and trans-
port, road safety. site: http://ec.europa.eu/transport/
road
safety/specialist/statistics/index en.htm.
Favoreel, W. (2011). Pedestrian sensing for increased traf-
fic safety and efficiency at signalized intersections.
In 8th IEEE International Conference on Advanced
Video and Signal-Based Surveillance.
Ger´onimo, D. and L´opez, A. M. (2014). Vision-based
Pedestrian Protection Systems for Intelligent Vehicles.
Springer.
Kadali, B. R. and Vedagiri, P. (2013). Modelling pedestrian
road crossing behaviour under mixed traffic condition.
European Transport, 15(3).
Keller, C. G., Enzweiler, M., Rohrbach, M., D. F. Llorca,
C. S., and Gavrila, D. M. (2011). The benefits of dense
stereo for pedestrian detection. IEEE Transactions on
Intelligent Transportation Systems, 12(4):1096–1106.
Keller, C. G. and Gavrila, D. M. (2014). Will the pedestrian
cross? a study on pedestrian path prediction. IEEE
Transactions on Intelligent Transportation Systems. In
press.
Koh, P. P. and Wong, Y. D. (2014). Gap acceptance of viola-
tors at signalised pedestrian crossings. Accident Anal-
ysis and Prevention, 62:178–185.
Kohler, S., Goldhammer, M., Bauer, S., Zecha, S., Doll, K.,
Brunsmann, U., and Dietmayer, K. (2013). Station-
ary detection of the pedestrian’s intention at intersec-
tions. IEEE Intelligent Transportation Systems Mag-
azine, 5(4):87–99.
Llorca, D. F., Milan´es, V., Parra, I., Gavil´an, M., Daza,
I. G., P´erez, J., and Sotelo, M. A. (2011). Autonomous
pedestrian collision avoidance using a fuzzy steering
controller. IEEE Transactions on Intelligent Trans-
portation Systems, 12(2):390–401.
Llorca, D. F., Sotelo, M. A., Hell´ın, A. M., Gavil´an, M.,
Daza, I. G., and Lorente, A. G. (2012). Stereo regions-
of-interest selection for pedestrian protection: a sur-
vey. Transportation Research Part C, 25:226–237.
Milanes, V., Llorca, D. F., Villagr´a, J., P´erez, J., Parra, I.,
Gonz´alez, C., and Sotelo, M. A. (2012). Vision-based
active safety system for automatic stopping. Expert
Systems with Applications, 39(12):11234–11242.
Nedevschi, S., Bota, S., and Tomiuc, C. (2009). Stereo-
based pedestrian detection for collision-avoidance ap-
plications. IEEE Transactions on Intelligent Trans-
portation Systems, 10(3):380–391.
Parra, I., Llorca, D. F., Sotelo, M. A., Bergasa, L. M.,
de Toro, P. R., Nuevo, J., Ocana, M., and Garc´ıa-
Garrido., M. A. (2007). Combination of feature ex-
traction methods for svm pedestrian detection. IEEE
Transactions on Intelligent Transportation Systems,
8(2):292–307.
Quintero, R., Almeida, J., Llorca, D. F., and Sotelo, M. A.
(2014). Pedestrian path prediction using body lan-
guage traits. In IV2014, IEEE Intelligent Vehicle Sym-
posium.
Schmidt, S. and Farber, B. (2009). Pedestrians at the kerb
- recognising the action intentions of humans. Trans-
portation Research Part F, 12(4):300–310.
Weimer, D., Kohler, S., Hellert, C., Doll, K., Brunsmann,
U., and Krzikalla, R. (2011). Gpu architecture for sta-
tionary multisensor pedestrian detection at smart in-
tersections. In IV2011, IEEE Intelligent Vehicle Sym-
posium.
Stereo-basedPedestrianDetectioninCrosswalksforPedestrianBehaviouralModellingAssessment
109
