
Load-aware Reconfiguration of LTE-Antennas
Dynamic Cell-phone Network Adaptation Using Organic Network Control
Sven Tomforde
1
, Alexander Ostrovsky
2
and J¨org H¨ahner
1
1
Organic Computing Group, University of Augsburg, Eichleitnerstr. 30, 86159 Augsburg, Germany
2
Technische Universi¨at M¨unchen, Arcisstr. 21, 82220 M¨unchen, Germany
Keywords:
Organic Computing, Adaptivity, Intelligent System Control, Learning, Antennas, LTE.
Abstract:
The utilisation of cell phone networks increases continuously, especially driven by the introduction of new
mobile services and smart phones. Network operators can follow two directions to deal with the problem:
either install new hardware or increase the efficiency of the existing infrastructure. This paper presents a novel
algorithm to improve the efficiency of current networks by allowing for a self-organised load-dependent recon-
figuration of antennas. The algorithm is capable of identifying hotspot traffic, assigning this to a neighbouring
cell, and learning the best strategy at runtime. This leads to a self-improving intelligent control mechanism.
The simulation-based evaluation results demonstrate the potential benefit, while simultaneously keeping the
hardware’s deterioration at a comparable level.
1 INTRODUCTION
Wireless cellular networks are growing rapidly. Cisco
estimates that the overall mobile traffic in 2017 will
reach 11.2 exabytes per month, which is 13 times
more than it was in the year 2012
1
. As a result, net-
work operators have to increase the capacity of their
networks significantly. Since new hardware installa-
tions are costly, intelligent control mechanisms and
means to optimise the utilisation of existing infras-
tructure are necessary. Such an approach is investi-
gated by this paper.
Typically, the load within a cell phone network
such as LTE (Long Term Evolution) is not homo-
geneously distributed – instead, it is subject to spa-
tial and temporal variations (Willkomm et al., 2009).
While some cells are overloaded at one point of time,
they can be lightly loaded at some other point of time.
For instance, this can be observed in office areas,
where heavy traffic load appears at working hours
followed by light usage at other times. Such an un-
even loading can also be observed among neighbour-
ing cells at the same point in time. The approach pre-
sented in this paper provides a solution that balances
the load among neighbouring LTE cells without the
need of major hardware modifications of the antennas
1
Cf. “Rethink Research” (CISCO),
http://www.theregister.co.uk/2013/02/11/mobile traffic
will be video/, 2013
or changes in the LTE specifications. Thereby, the
algorithm is able to improve its behaviour over time
based on an online learning approach.
The remainder of this paper is concerned with the
developed algorithm. Therefore, we start with an
overview of the current state of the art in Section 2,
followed by a description of the physical model used
as basis for this paper (Section 3). Section 4 intro-
duces the novelalgorithm for dynamic antenna recon-
figuration. Afterwards, its performance is evaluated
based on simulations (Section 5). Finally, the paper
closes with a summary and an outlook in Section 6.
2 STATE OF THE ART
Methods for optimising antenna parameters for
UMTS (Universal Mobile Telecommunications
System), LTE and other mobile networks have been
widely discussed in the literature. In (Temesvary,
2009), an algorithm for the optimisation of antenna
tilt and power based on LTE networks is presented,
which makes use of the optimisation heuristic Simu-
lated Annealing. The goal is to improveSINR (Signal
to Interference plus Noise Ratio) measured at the UEs
(User Equipment; i.e. cell phones). Therefore, so-
called CQI (Channel Quality Indication) reports are
236
Tomforde S., Ostrovsky A. and Hähner J..
Load-aware Reconfiguration of LTE-Antennas - Dynamic Cell-phone Network Adaptation Using Organic Network Control.
DOI: 10.5220/0005045102360243
In Proceedings of the 11th International Conference on Informatics in Control, Automation and Robotics (ICINCO-2014), pages 236-243
ISBN: 978-989-758-039-0
Copyright
c
2014 SCITEPRESS (Science and Technology Publications, Lda.)

collected
2
. The simulation-based evaluation showed
that employing a combination of antenna power and
tilt optimisation does not lead to significantly better
performance than just optimising the tilt.
Furthermore, the work in (Deruyck et al., 2013)
demonstrated that decreasing transceiver power re-
sults not necessarily in a significant decrease of the
antenna’s overall power consumption. Another at-
tempt to optimise the cell network’s efficiency has
been presented in (Du et al., 2002): A genetic algo-
rithm has been used to determine size and shape of
cells. Thereby, antenna gains are optimised in each
direction to find a trade-off between minimising the
overall base station power consumption and maximis-
ing the capacity. Besides cell shapes, so-called cell-
zooming has been investigated in (Niu et al., 2010).
The concept relies on switching inactive cells off,
which results in saving energy due to a concentration
among only few necessary cells. Simulations carried
out here show that about 30 to 50% of the base sta-
tions can be switched off without loss of functionality
– but a transfer to UMTS or LTE networks is missing.
More focussed towards the algorithm presented in
this paper, (Awada et al., 2011) investigates the usage
of Taguchi’s Method (Weng et al., 2007) for the op-
timisation of uplink power, antenna tilt and azimuth.
Simulation results showed that an offline optimisation
converges faster than approaches using simulated an-
nealing (Kirkpatrick et al., 1983) in most cases. Sim-
ilarly, (Razavi, 2012) focuses on the antenna tilt as
optimisation parameter by using the golden section
search algorithm to find an optimised angle, followed
by frequent explorations to fine-tune it. The results
for a homogeneous traffic distribution show that the
optimal antenna tilt is rather large, so this method con-
verges fast. In (Kim et al., 2012), the authors model
a mobile network as a M/G/1 queue and introduce
a distributed algorithm to optimise parameters such
as the throughput of the network. The algorithm is
shown to convergefast towards the searched optimum
but has not been applied to UMTS or LTE networks,
yet. Similarly, the authors in (Fehske et al., 2013)
model a LTE network as a M/M/1 queue and intro-
duce a centralised algorithm to optimise handover pa-
rameters and antenna tilts. A system-level simulation
shows that it is able to improve user throughput even
during low-traffic times. In further work, e.g. (Razavi
et al., 2010), reinforcement learning techniques are
applied to improve coverage and capacity aspects.
The approach presented in this paper is different
2
An overview of metrics related to CQI can be
found in a Technical Report by Ericsson, available
online: http://www.ericsson.com/res/docs/whitepapers/
wp-lte-acceptance.pdf
to the afore mentioned work due to several reasons.
The purpose is to automatically relieve hotspot traf-
fic in overloaded cells during runtime (i.e. while the
antennas operate), while most of the existing work is
situated at design-time. A hotspot is an accumulation
of UEs that lasts for a certain period of time. Reliev-
ing this traffic is done by shifting it to a neighbouring
cell with less load. In contrast to our solution, exist-
ing approaches for this problem require many steps
until a good configuration is found. Tilting antennas
has impact on the hardware: Doing this too often will
lead to increased maintenance intervals and necessary
exchange of components.
Finally, the presented work is part of the Organic
Network Control project (ONC) (Tomforde et al.,
2009). Based on principles of Organic Computing
(M¨uller-Schloer, 2004), the project investigates pos-
sibilities to augment data communication networks
with “life-like” characteristics, i.e. self-organisation,
robustness, and flexibility. The first phase was con-
cerned with self-improving reconfiguration of ex-
isting network protocol parameters in response to
changing conditions (Tomforde and H¨ahner, 2011).
The current second phase shifts the focus towards re-
configurationof hardware and collaborativesolutions.
3 ANTENNA TILT AND
PHYSICAL MODEL
The term antenna tilt describes the angle between the
antenna’s main beam and the horizontal pane. When
the beam is directed downwards, the antenna is tilted
down; when the beam is directed upwards, the an-
tenna is tilted up. By convention, a negative angle
indicates tilting the antenna up and a positive tilting it
down – a angle of 0 means that the beam is parallel to
the horizontal pane (Bratu, 2012). The adjustment of
tilts can be achieved either mechanically, electrically
(Bratu, 2012), or by vertical beam forming (Nokia
Siemens Networks Corporation, 2012). Mechanical
tilts are a result of mounting antennas with a certain
angle. In contrast, the electrical tilt is adjusted by
changing the phase characteristics – this can be done
remotely using Remote Electrical Tilt (RET). Verti-
cal Beam Forming adjusts the tilts for multiple UEs
independently (has to be supported by the antenna’s
hardware and specification). Tilt adjustment provides
several different possibilities for optimisation. How-
ever, changing antenna parameters is not trivial and
wrong decisions may lead to interferences and a de-
creased coverage (Holma and Toskala, 2012).
The Physical Model is used to predict the propa-
gation of radio waves. The distribution of these ra-
Load-awareReconfigurationofLTE-Antennas-DynamicCell-phoneNetworkAdaptationUsingOrganicNetworkControl
237

dio waves are influenced e.g. by obstacles and the
atmosphere. When a radio wave impinges an ob-
ject, it can pass through it, be absorbed, or it can
be reflected, scattered (i.e. reflection to multiple di-
rections) or diffracted (Dean, 2009). Wireless sig-
nals can follow multiple paths (multipath character-
istic) – it is therefore difficult to predict the exact
behaviour. However, this can be approximated by
combining pathloss, shadow fading, and fast fading
(Ghosh et al., 2010). Pathloss means the damping that
occurs in relation to the distance passed by the signal
and can be approximated (in dB) for macro cells in
urban area as follows (3GPP, 2012b):
L(R) = 40× (1− 4× 10
−3
× Dhb) × log
10
(R)
−18× log
10
(Dhb) + 21× log
10
( f) + 80 (1)
where R is the distance between the base station and
the UE (in km), f is the carrier frequency (in MHz),
and Dhb is the height of the base station above aver-
age rooftop level (in m).
The pathloss model described above assumes that
the damping is constant for all paths. This assumption
does not hold for all cases: While some paths suf-
fer increased loss (e.g. due to buildings), others are
less obstructed. This effect is called shadow fading
(Dean, 2009) and can be critical on cell edges and
create coverage holes. Models for shadow fading use
a log-normal distribution (Ikuno et al., 2010). Hence,
the combined effect (L in dB) of pathloss and shadow
fading can be expressed as: L =
¯
L + X, where
¯
L is
the mean pathloss, and X is a normal distributed ran-
dom variable with a mean of 0 and a standard devia-
tion of 10 (3GPP, 2012b; Ikuno et al., 2010). Due to
changes in the topology and vegetation, shadow fad-
ing changes over time (Wang, 2007). Contrary to in-
tuition, rain, fog and snow have only a negligible ef-
fect on signal damping (Wang, 2007).
Antenna tilt and azimuth (i.e. the angle between
the antenna’s main beam and the vertical pane) have
also impact on the signal damping. Decreasing the
vertical angle between UE and the eNodeB (the par-
ticular E-UTRAN Node with the considered antenna)
– in comparison to the angle with maximum gain di-
rection – will also lead to a decrease in the signal
damping. The gain of antenna power in a given direc-
tion is contrary to an antenna that radiates equally in
all directions (isotropic radiator) (Hill, 1976). Taking
this into account, the received power can be estimated
as follows (3GPP, 2012a):
RX
PWR
= TX
PWR
− max(L− G
TX
− G
RX
, MCL) (2)
where RX
PWR
is the received power, TX
PWR
the trans-
mitted power, L the pathloss, G
TX
the transmitter an-
tenna’s gain, G
RX
the receiver antenna’s gain, and
MCL the minimum coupling loss (which is defined
as 70dB for urban areas). Temporary anomalies that
may disturb the radio wave propagation (i.e. tropo-
spheric ducting) are neglected in the context of this
paper. The algorithm presented in the following con-
siders this physical model.
4 DYNAMIC ANTENNA
RECONFIGURATION
This section describes the distributed algorithm for
the optimisation of congested cells. It reconfigures
antenna tilts such that possible hotspots are shifted
from the coverage area of the congested cell to the
coverage area of a neighbouring (underutilised) cell.
Down-tilting should lead to a decrease in the covered
area and vice-versa – due to physical and weather
conditions, this is not always the case. Therefore, the
algorithm is based on estimating the achieved success.
This is combinedwith reinforcementlearning concept
to improve this behaviour at runtime.
The basic idea of the algorithm is to deal with the
existing hardware and to operate without changes in
the LTE specifications. Important mechanisms are
already available: 1) antenna tilts can be changed
with Remote Electrical Tilt (RET), 2) the discovery of
neighbours can be done with Automated Neighbour
Relation (ANR) (3GPP, 2012b), 3) the communica-
tion between neighbours is implemented using the X2
interface (3GPP, 2012a), and the positioning of users
is supported by LTE (Iwamura et al., 2009).
The algorithm for online antenna tilt optimisation
consists of five parts: the basic algorithm is respon-
sible for optimising the mapping of UEs to eNodeBs
(Part 1: Optimisation). This requires further aspects:
the identification of hotspot traffic that fulfils the re-
quirements to be handled as a cluster by the algorithm
(Part 2: Identification), a method to select a neigh-
bouring cell to relieve the cluster to (Part 3: Neigh-
bour Policy), a mechanism to learn from previous ex-
periences (Part 4: Learning), and finally a measure to
quantify the similarity of two clusters (Part 5: Simi-
larity). The remainder of this section introduces these
five parts in detail and discusses the possibilities and
limitations of the approach.
4.1 Part 1: Optimisation
The optimisation part of the algorithm aims at reliev-
ing clusters. Therefore, it analyses data collected in
previous runs and data provided by the exploration
part (see Section 4.3). This analysis leads to a pre-
diction of which neighbour should be tilted up. If no
ICINCO2014-11thInternationalConferenceonInformaticsinControl,AutomationandRobotics
238

such data exists for the analysis, the algorithm uses
heuristics to generate the prediction. In order to keep
the configuration chosen by the operator as static as
possible (i.e. apply as few changes simultaneously as
possible), only one neighbour is taken into consider-
ation in each step. The following Algorithm 1 is exe-
cuted for each eNodeB.
In Algorithm 1, the variable Cell
i
is the particular
cell maintained by the antenna. The parameter Deg
defines the number of degrees an antenna is tilted and
can be adjusted by the operator – it should be small
to prevent large deviations from the initial configu-
ration. The policy Pi
Cluster
defines which cluster is
to be processed – a simple policy is to select a clus-
ter that is located as far as possible from the serv-
ing eNodeB. Thereby,CL is the currently investigated
cluster. CandNeighbour specifies the set of possible
neighbouring cells to apply hotspot traffic to and N
s
is the currently investigated neighbour out of this set.
Finally, Fit
i
estimates the performance (or fitness) of
the cell before tilting, Fit
s
estimates the performance
after the last tilt change has been applied.
Algorithm 1: Dynamic Antenna Reconfiguration.
1: Input: Deg, Pi
Cluster
, Pi
Neighbour
;
2: if Cell
i
is congested and hotspots exist then
3: CL ← Select Clusters according to policy Pi
Cluster
;
4: Fit
i
← Current performance of cell;
5: for all CL
i
∈ CL do
6: CandNeighbours ← All Neighbours with free capac-
ity near CL
i
;
7: N
s
← Select eNodeB from CandNeighbours accord-
ing to policy Pi
Neighbour
;
8: Tilt down eNodeB serving Cluster by Deg degrees;
9: Tilt up N
s
by Deg degrees;
10: Fit
s
← Save to what extend Cluster was relieved;
11: if Fit
i
≥ Fit
s
then
12: Reset tilts of eNodeB and N
s
;
13: end if
14: end for
15: end if
Only neighbouring antennas with free capacity to
serve the cluster should be considered for tilting up
(otherwise they may also overload). Furthermore, a
relieved cluster does not necessarily result in a better
performance at user side. Hence, the tilts are reset if
the end user performance decreases.
4.2 Part 2: Identification of Clusters
The algorithm as presented before relies on knowl-
edge about existing clusters of UEs. Hereby, the num-
ber of clusters is unknown. Different approaches to
identify an unspecified number of clusters are known
in literature, DBSCAN (Density-Based Spatial Clus-
tering of Applications with Noise – (Ester et al.,
1996)) and OPTICS (Ordering Points To Identify the
Clustering Structure – (Ankerst et al., 1999)) are the
most appropriate ones in the context of this paper.
Both approachesidentify clusters based on the density
of points. Therefore, they need three parameters: 1)
SetOfPoints (data for clustering – here: positions of
UEs), 2) Eps (maximum distance of the points within
a single cluster), and 3) MinPts (minimum number
of points to form a cluster). These three parameters
must be known in advance; a good setup is chosen
empirically. In contrast to DBSCAN, OPTICS does
not return a certain cluster, but an ordering of possi-
ble cluster candidates. Hence, we used OPTICS as
techniques to identify cluster.
4.3 Part 3: Selection of Neighbours
Within Algorithm 1, a policy Pi
Neighbour
is needed that
chooses a neighbouring antenna for tilting up (and for
taking over the hotspot traffic). Depending on previ-
ous experiences, this policy has different options to
pursue. These experiences are either provided by the
exploration algorithm or exist due to previous runs
of the optimisation algorithm. In case there is no
previous cluster information being similar to the cur-
rent cluster CL
i
, no configuration can be re-used. A
conservative approach is here to keep the current tilt
settings until the exploration phase provides results.
In contrast, an opportunistic approach is to choose
a neighbour eNodeB heuristically. Both approaches
have advantages and drawbacks. The eNodeB chosen
by a heuristic may be a good choice, but its tilt change
may deteriorate the channel quality of the users with-
out relieving the cluster. If knowledge with clusters
similar to CL
i
has been collected before, the policy
Pi
Neighbour
determines the tilt configuration that re-
lieves CL
i
according to the previous experiences.
Two different heuristics have been implemented
and tested in simulations: 1) select a random neigh-
bour which azimuth is towards the cluster, and 2)
choose the eNodeB which has an azimuth towardsCL
i
and a part of the cluster in its coverage area (this is
based on the observation that a cluster located at the
edge of a cell is often located within the coverage ar-
eas of two cells). A hybrid solution consisting of both
is to use 1) if 2) has not been successful.
4.4 Part 4: Learning
In the context of the optimisation algorithm, learning
is concerned with the policy Pi
neighbour
. The selection
of an appropriate neighbouring antenna to hand over
hotspot traffic should be improved over time by con-
sidering the success of previous actions. Until now,
Load-awareReconfigurationofLTE-Antennas-DynamicCell-phoneNetworkAdaptationUsingOrganicNetworkControl
239

the algorithm selects a neighbour randomly or accord-
ing to heuristics. Afterwards, information whether the
tilt change led to a relief of a cluster or not (based on
the performance estimation) is collected. The more
UEs switched from the cluster to a non-congested
cell, the better is the quality of the tilt change. This
can be formalised as follows:
q = |U
b
| − |U
a
| (3)
with q being the performance function, U
a
the set
of UEs served by the particular overloaded antenna
before the tilt changes have been applied, |U
a
| the
number of UEs contained in this set, and U
b
the set
of UEs served by the particular overloaded antenna
after the tilt change. While running, the algorithm
collects the qualities of tilt changes and stores them
as quadruples containing cluster information, neigh-
bour to cooperate with, quality of the tilt change and
time. To decide which neighbour should be tilted up
for a given cluster, the qualities of tilt changes for all
UEs are combined using the beta distribution density
function. Especially in the context of deriving repu-
tation values for participants in e-commerce systems,
the beta distribution density function is used due to its
simplicity as well as solid mathematical foundations
(Josang and Ismail, 2002).
In the context of this paper, the beta distribution
approach is used to predict to which extend tilting up
of an antenna will relief a cluster. Therefore, previ-
ous data about tilt changes has to exist. Assume we
want to determine whether tilting up of a neighbour
N
j
will relieve a cluster CL
i
. We already collected
historical data to what extend tilting up of N
j
relieved
a previously observed similar cluster CL
i
. First, we
set the two parameters as needed for the distribution
function α and β to a predefined constant value larger
than one. We know due to the properties of the beta
distribution PDF that the modus is at 0.5. So we as-
sume 0.5 to be a neutral value. Afterwards, we iterate
through the historical data. Each time an indication
occurs that a tilt change of N
j
relieved CL
i
, we incre-
ment α. In contrary, each time an indication occurs
that a tilt change of N
j
did not relieve CL
i
, we incre-
ment β. Due to the properties of the beta distribution
PDF, we know: When α is larger than β, the modus
increases (and vice-versa). Hence, if there are more
positive indications than negative ones, the modus is
larger than 0.5. For further improvements, the incre-
ments can also be weighted by the quality of the par-
ticular tilt changes. The larger the absolute difference
is, i.e. |α− β|, the larger is the absolute value of the
difference between the modus and 0.5. Hence, we can
estimate the probability p that tilting up of N
j
will re-
lieve CL
i
by calculating the absolute difference of the
x-coordinate of the maximum and 0.5.
We observe that the bell shaped curve becomes
broader with decreasing values of α and β and nar-
rower with increasing values of α and β. Hence, the
value of the p%-quantile is used with a small value for
p instead of the modus. If p is small enough, then the
p%-quantile is smaller than the modus – if the modus
is larger than or equal to 0.5. With larger values for
α and β, the distance between p%-quantile and the
modus decreases.
By omitting the normalisation factor of the origi-
nal beta distribution function, the computability can
be improved. The result is given in the following
function:
f(p, α, β) = P
α−1
× (1− p)
β−1
(4)
for an interval [0;1] with 0 ≤ p ≤ 1, α > 0 and β > 0.
Thereby, f is the distribution function, α and β the
weighting factors and p a constant.
4.5 Part 5: Similarity of Clusters
The approach as presented before relies on previous
experiences with similar clusters of hotspot traffic.
This implies the possibility to compare clusters and
to store information about clusters. In an ideal case,
two clusters will consist of users at exactly the same
positions at different points of time. In reality, this
will not happen.
Assume we have two clusters c and c
0
occurring
at two different points of time. When the positions
of the UEs in c and c
0
only slightly differ, we define c
and c
0
as similar. Then e.g. experiences with c
0
can be
used to predict an eNodeB for tilting up to relieve c.
To compare two clusters we use a modified Fowlkes-
Mallows index (Fowlker and Mallows, 1983):
FM =
s
P
c,c
′
P
c,c
′
+ P
c
×
P
c,c
′
P
c,c
′
+ P
′
c
(5)
with P
c,c
′
being the UEs that are contained in both sets
(i.e. UEs that are contained in the convex hull of the
cluster), P
c
the positions of UEs contained only in c,
and P
c
′
the positions of UEs contained only in c
0
.
5 EVALUATION
5.1 Experimental Setup
To test the implemented algorithm, simulations were
performed using a modified Vienna LTE System Level
Simulator (Ikuno et al., 2010). The simulator was
configured using the values as listed in Table 1.
ICINCO2014-11thInternationalConferenceonInformaticsinControl,AutomationandRobotics
240

Table 1: Simulation parameters.
Antenna Model Kathrein 742 215
Base station height 20m
Transmit power 30dB
Mobile height 1.5m
Inter eNodeB distance 500m
Pathloss model 3GPP TR 36.942
(see (3GPP, 2012b))
Shadow fading model Lognormal distributed,
2D space correlated
(Claussen, 2005)
Electrical tilt range 0
◦
– 10
◦
Mechanical tilt 0
◦
Channel Model Winner II+
Min. coupling loss 70dB
Scheduler Round Robin
MIMO 2 senders, 2 receivers
MIMO transmission Closed-loop
spatial MUX
Bandwidth 20Mhz / 100RBs
Traffic distribution FTP: 10%;
HTTP: 20%;
VIDEO: 20%;
VoIP: 30%;
Gaming: 20%
(3GPP, 2007)
Hotspot definition ≥ 3 UEs in 3m
Min. switching UEs 5 UEs
5.2 Experimental Results
A: Antenna Tilt Reconfiguration
The developed algorithm is tested on different scenar-
ios. Each scenario consists of 21 active eNodeBs and
36 passive eNodeBs. The scenarios differ in terms
of UEs served by each eNodeB. Furthermore, hotspot
traffic is simulated – which has to be relieved by the
algorithm. For this paper, we investigated three dif-
ferent scenarios – where each eNodeB serves up to 9
(Scenario 1 – results are listed in Table 2), up to 15
(Scenario 2 – results are listed in Table 2), and up to
30 UEs (Scenario 3 – results are listed in Table 3).
Each randomly generated scenario is initially gener-
ated without hotspots. Afterwards, this is optimised
using simulated annealing with the goal function to
increase the 10%-percentile throughput. Thereby,
“no improvements for 20 iterations” has been chosen
as termination criterion. This optimsed setting then
serves as input for the algorithm, limiting the optimi-
sation potential to just the additional hotspot traffic.
Therefore, two random hotspots with 10 to 40 UEs
and a radius between 20m and 70m are added. The
distance between the centre of a hotspot and the near-
est eNodeB is at least 175m – in case the two hotspots
are located too close to each other, they automatically
merge into one large hotspot. In contrary, a hotspot
can automatically split into parts if the distance be-
tween UEs is too large. Similarly, a hotspot which
is too sparse is not recognised by the clustering al-
gorithm (cluster: min. 10 UEs; at least 25m to the
nearest neighbour).
The clustering part of the algorithm is configured
to only accept clusters defined by the area of the con-
vex hull of up to 300m
2
. Thereby, a single hotspot
can be relieved multiple times by different antenna
configurations. The results as described in the follow-
ing reflect aggregated simulation results of several (in
most cases: 10) randomised scenarios. In all cases,
we distinguish between two possibilities: Either we
let the algorithm modify the tilt by an angle of 1
◦
or
by an angle of 2
◦
. We measured the improvement
of the 10%-percentile throughput of the overloaded
eNodeB and its neighbours as an aggregated value,
since an improvement for the eNodeB might result in
a worsening for the neighbours accepting the hotspot
traffic (and vice-versa). The results given in the tables
reflect averages over all runs of the simulation.
Table 2 lists the results of the evaluation for the
first scenario with six to nine UEs connected to each
eNodeB additionally to the hotspots. Thereby, the ab-
breviation RB stands for Resource Block. When set-
ting the angle of tilt change to 1
◦
, the mean improve-
ment of the 10%-percentile throughput is significantly
larger compared to the results with a tilt change of 2
◦
.
This is probably due to the fact that there is a higher
negative effect on the channel quality for a higher
change of the tilts.
The same simulations have been evaluated for the
scenario with 15 UEs per eNodeB (in addition to
the hotspot traffic to be relieved). Table 2 lists the
achieved results. Again, changing the antenna tilt by
1
◦
led to a better performance than the change by 2
◦
.
Compared to the previous results, we can observe that
the algorithm needed slightly more iterations (2.13 vs.
1.74 for 1
◦
change; 2.22 vs. 1.81 for 2
◦
change). This
is still extremely fast – especially compared to the us-
age of an optimisation heuristic such as simulated an-
nealing, where hundreds of iterations are needed. The
simulation results for 30 UEs per eNode support the
observations for the previous two scenarios, see Ta-
ble 3 for details.
In some scenarios shifting the hotspot did not lead
to an increased 10%-percentile thrgouhput for the
overloaded eNodeB and its neighbours (cf. the num-
ber of successful relieves in Table 2 and 3). There
are several reasons for this behaviour. First, shifting
a hotspot may overload the neighbour. This can hap-
pen when the number of users in the hotpost is large
and the hotspot is near the coverage area of the neigh-
bour that should tilt up. A second reason is that UEs
might move to another eNodeB than the selected part-
ner for the handover process. This can especially hap-
pen in case of large clusters. Finally, UEs connected
to the overloaded eNodeB that are not in the cluster
may switch to other neighbouring cells after changing
tilts – which again influences the evaluation results.
Load-awareReconfigurationofLTE-Antennas-DynamicCell-phoneNetworkAdaptationUsingOrganicNetworkControl
241
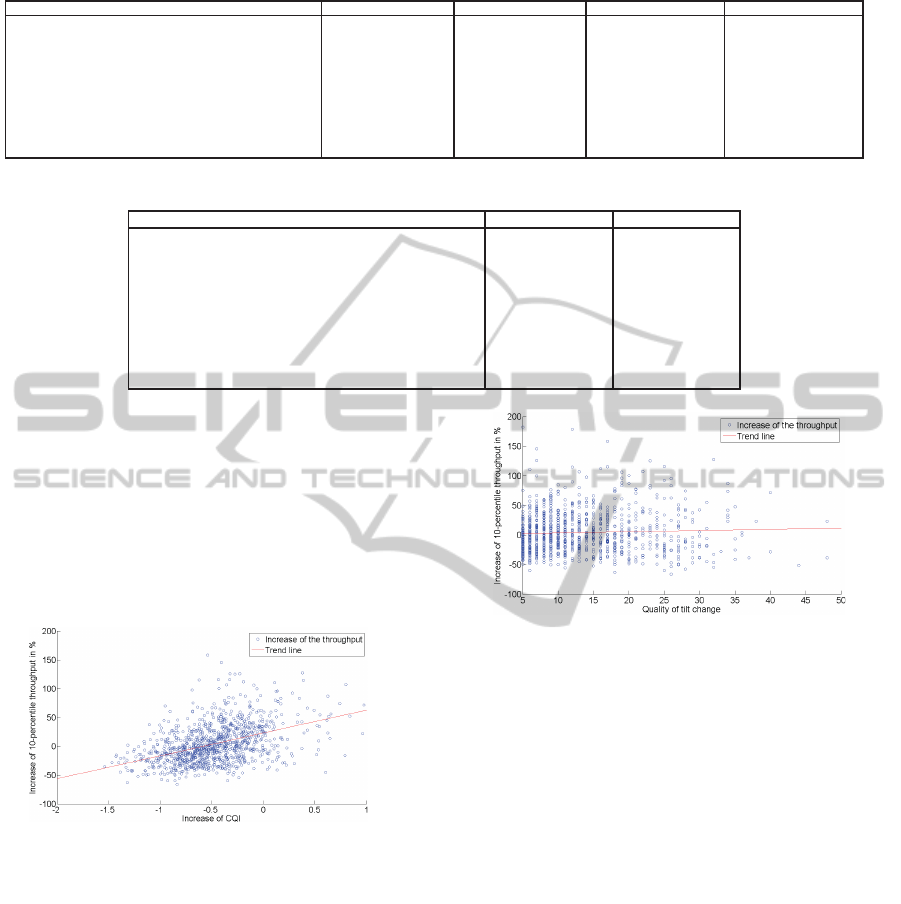
Table 2: Simulation results for the optimisation algorithm for 6 and 15 UEs per eNodeB additionally to the clusters.
Parameter Tilt change 1
◦
[6 UEs] Tilt change 2
◦
[6 UEs] Tilt change 1
◦
[15 UEs] Tilt change 2
◦
[15 UEs]
Number of hotspots 276 276 218 218
Number of scenarios 241 241 177 177
Max. number of RB scheduled to each UE in overloaded cell 3 3 3 3
Min. number of RB scheduled to each UE in free cell 6 6 6 6
Mean improvement of 10%-percentile throughput 17.38% 7.62% 5.04% 1.06%
Range of improvements (min. and max.) [−55.61%;186.08%] [−67.74%;174.91%] [−37.54%;79.67%] [−49.89%;119.57%]
Mean CQI decrease 0.27 0.34 0.37 0.40
Mean number of iterations until convergence 1.74 1.81 2.13 2.22
Mean distance of cluster centre to eNodeB 247.79m 241.57m 245.01m 243.27m
Number of successful relieves 198 400 111 187
Table 3: Simulation results for the optimisation algorithm for 30 UEs per eNodeB additionally to the clusters.
Parameter Tilt change 1
◦
Tilt change 2
◦
Number of hotspots 276 276
Number of scenarios 225 225
Max. number of RB scheduled to each UE in overloaded cell 2 2
Min. number of RB scheduled to each UE in free cell 3 3
Mean improvement of 10%-percentile throughput 8.71% −2.63%
Range of improvements (min. and max.) [−34.58%;69.81%] [−46.45%;53.94%]
Mean CQI decrease 0.20 0.31
Mean number of iterations until convergence 1.25 1.55
Mean distance of cluster centre to eNodeB 257.64m 247.65m
Number of successful relieves 121 294
B: Number of Users, CQI and Throughput
The last part of the evaluation deals with the impact
of the channel quality on the throughput. When in-
creasing the channel quality, the throughput usually
increases as well. This is illustrated by Figure 1 (see
the red trend line). Here, CQI before and after the op-
timisation is compared to the throughput before and
after the optimisation – if the hotspot was successfully
relieved.
Figure 1: CQI and 10%-percentile throughput.
The correlation between the number of users
switched to the neighbour and the increase of the
throughput is less obvious, see Figure 2. The results
show that the 10%-percentile throughput increases, if
there are at least 5 UEs switching from an overloaded
cell to a free neighbour. An advantage of tilt-based
load balancing (i.e. in comparison to only handover-
based load balancing) is the possible limitation of the
channel quality’s decrease (or even the increase for
UEs shifted to another cell).
6 CONCLUSION
This paper presented a novel distributed algorithm for
Figure 2: Number of users switched from the cluster in the
overloaded cell to a free neighbour vs. increase of 10%-
percentile throughput.
the optimisation of antenna tilts in LTE networks.
Thereby, hotspots of users are shifted from an over-
loaded cell to a free neighbouring cell, which re-
quires the LTE protocol in release 10 and higher
(LTE-Advanced). The simulation-based evaluation
demonstrated the potential benefit of assigning clus-
ters of users to neighbouring cells in oversaturated
conditions. Thereby, the search for an optimal an-
tenna tilt configuration is not trivial due to the unpre-
dictable propagation of radio waves – which leads to
the demand of an intelligent control mechanism. Such
a control mechanism is presented by this paper that
combines the advantages of a self-organised approach
and the capability of learning at runtime.
While the approach presented before optimises
hotspot traffic, future work will focus on a generalisa-
tion towards relieving different kinds of congestions.
Therefore, cells can be split into geographical sectors
and the tilt change can be explored for each sector
independently. Based on this method, users may be
clustered not only geographically but also based on
their channel quality. However, when changing an-
tenna tilt, the SINR of each cluster does not change
ICINCO2014-11thInternationalConferenceonInformaticsinControl,AutomationandRobotics
242

homogeneously.
Furthermore, the presented algorithm does not
consider the demanded QCIs and throughputs of dif-
ferent users. Real user data is needed to verify
whether there are clusters of users who need a high
throughput (e.g. privileged users) and clusters of users
who do not need a high throughput. In combination
with handover parameters, the scheduling algorithm,
MIMO transmission techniques and other parameters,
the optimisation might be even more successful.
REFERENCES
3GPP (2007). LTE Physical Layer Framework for Perfor-
mance Verification. Tech. rep., 3rd Generation Part-
nership Proj.
3GPP (2012a). Evolved Universal Terrestrial Radio Access
Network; X2 general aspects and principles. Tech.
rep. v. 11.0.0, 3rd Generation Partnership Proj.
3GPP (2012b). Technical Specification Group Radio Ac-
cess Network; Evolved Universal Terrestrial Radio
Access; Radio Frequency system scenarios. Tech. rep.
v. 11.0.0, 3rd Generation Partnership Proj.
Ankerst, M., Breunig, M., Kriegel, H., and Sander, J.
(1999). Optics: Ordering points to identify the clus-
tering structure. In Proc. of SIGM99, pages 49 – 60.
Awada, A., Wegmann, B., Viering, I., and Klein, A. (2011).
Optimizing the Radio Network Parameters of the LTE
System Using Taguchi’s Method. IEEE Trans. on Ve-
hicular Technology, 60(8):3825–3839.
Bratu, V.-I. (2012). Self-optimisation of Antenna Tilt in
Mobile Networks. Master’s thesis, KTH Royal Insti-
tute of Technology.
Claussen, H. (2005). Efficient Modelling of Channel Maps
with Correlated Shadow Fading in Mobile Radio Sys-
tems. In Proc. of 16th Symp. on Personal, Indoor and
Mobile Radio Com., pages 512 – 516.
Dean, T. (2009). Network+ Guide to Networks. Cengage
Course Technology.
Deruyck, M., Joseph, W., Lannoo, B., Colle, D., and
Martens, L. (2013). Designing Energy-Efficient Wire-
less Access Networks: LTE and LTE-Advanced. IEEE
Internet Computing, 17(5):39 – 45.
Du, L., Bigham, J., Cuthbert, L., Parini, C., and Nahi, P.
(2002). Cell size and shape adjustment depending on
call traffic distribution. In Proc. of WCNC’02, vol-
ume 2, pages 886 – 891.
Ester, M., Kriegel, H. P., Sander, J., and Xu, X. (1996).
A Density-Based Algorithm for Discovering Clusters
in Large Spatial Databases with Noise. In Proc. of
Int. Conf. on Knowledge Discovery and Data Mining,
pages 226 – 231.
Fehske, A., Klessig, H., Voigt, J., and Fettweis, G. (2013).
Concurrent Load-aware Adjustment of User Associa-
tion and Antenna Tilts in Self-organising Radio Net-
works. IEEE Trans. on Vehicular Technology, 1:99 ff.
Fowlker, E. and Mallows, C. (1983). A Method for Compar-
ing Two Hierarchical Clusterings. J. of the Amercian
Statistical Association, 78(383):553 – 569.
Ghosh, A., Zhang, J., Andrews, J., and Muhamed, R.
(2010). Fundamentals of LTE. Prentice Hall.
Hill, J. (1976). Gain of directional antennas. Technical
report, Watkins-Johnson Co.
Holma, H. and Toskala, A. (2012). LTE Advanced: 3GPP
Solution for IMT-Advanced. Wiley and Sons.
Ikuno, J. C., Wrulich, M., and Rupp, M. (2010). Sys-
tem Level Simulation of LTE Networks. In Proc. of
VTC’10, pages 1 – 5.
Iwamura, M., Umesh, A., and Hapsari, W. A. (2009). Fur-
ther Enhancements of LTE – LTE Release 9. NTT Do-
como Tech. J., 12(1):45 – 53.
Josang, A. and Ismail, R. (2002). The Beta Reputation Sys-
tem. In Proc. of Bled Electronic Commerce Conf.,
pages 41 – 55.
Kim, H., de Veciana, G., Yang, X., and Venkatachalam,
M. (2012). Distributed Alpha-optimal User Associ-
ation and Cell Load Balancing in Wireless Networks.
IEEE/ACM Trans. on Networks, 20(1):177–190.
Kirkpatrick, S., Jr., D. G., and Vecchi, M. P. (1983).
Optimization by Simmulated Annealing. Science,
220(4598):671 – 680.
M¨uller-Schloer, C. (2004). Organic Computing: On the
Feasibility of Controlled Emergence. In Proc. of
CODES and ISSS’04, pages 2–5.
Niu, Z., Wu, Y., Gong, J., and Yang, Z. (2010). Cell zoom-
ing for cost-efficient green cellular networks. IEEE
Com. Mag., 48(11):74–79.
Nokia Siemens Networks Corporation (2012). Active an-
tenna systems: A step-change in base station site per-
formance. Technical report.
Razavi, R. (2012). Self-optimisation of antenna beam tilting
in lte networks. In Proc. of VTC’12, pages 1–5.
Razavi, R., Klein, S., and Claussen, H. (2010). Self-
optimisation of Capacity and Coverage in LTE Using
a Fuzzy Reinforcement Learning Approach. In Proc.
of IEEE PIMRC’10, pages 1865 – 1870.
Temesvary, A. (2009). Self-Configuration of Antenna Tilt
and Power for Plug and Play Deployed Cellular Net-
works. In Proc. of Wireless Communications and Net-
working Conf., pages 1–6.
Tomforde, S., Cakar, E., and H¨ahner, J. (2009). Dynamic
Control of Network Protocols - A new vision for fu-
ture self-organised networks. In Proc. of ICINCO’09,
pages 285 – 290.
Tomforde, S. and H¨ahner, J. (2011). Biologically Inspired
Networking and Sensing: Algorithms and Architec-
tures, chapter Organic Network Control – Turning
standard protocols into evolving systems, pages 11 –
35. IGI Publishers.
Wang, J. (2007). Performance Analysis and Measurement
of CDMA2000 System in Metropolitan Taipei. PhD
thesis, Nat. Taiwan Univ. of Science and Tech.
Weng, W., Yang, F., and Elsherbeni, A. (2007). Linear An-
tenna Array Synthesis Using Taguchi’s Method: A
Novel Optimization Technique in Electromagnetics.
Trans. on Antennas and Propagation, 55:723 – 730.
Willkomm, D., Machiraju, S., Bolot, J., and Wolisz, A.
(2009). Primary User Behavior in Cellular Net-
works and Implications for Dynamic Spectrum Ac-
cess. IEEE Com. Mag., 47(3):88 – 95.
Load-awareReconfigurationofLTE-Antennas-DynamicCell-phoneNetworkAdaptationUsingOrganicNetworkControl
243
