
Thermal Storage in a Heat Pump Heated Living Room Floor for
Urban District Power Balancing
Effects on Thermal Comfort, Energy Loss and Costs for Residents
R. P. van Leeuwen
1,2
, J. B. de Wit
1
, J. Fink
2,3
and G. J. M. Smit
2
1
Sustainable Energy Group, Saxion University of Applied Sciences, P.O. Box 70.000, 7500 KB Enschede, The Netherlands
2
Department of Computer Science, Mathematics and Electrical Engineering, University of Twente,
P.O. Box 217, 7500 AE Enschede, The Netherlands
3
Supported by STW, Project iCare (11854)
Keywords: Thermal Activated Building Systems (TABS), Thermal Storage, Demand Side Management, Power
Balancing, Peak Shaving, Smart Grid, Optimal Control, Renewable Energy System, Thermal Network
Model, Thermal Comfort, Floor Heating System.
Abstract: For the Dutch smart grid demonstration project Meppelenergie, the effects of controlled thermal energy
storage within the floor heating structure of a living room by a heat pump are investigated. Storage
possibilities are constrained by room operative and floor temperatures. Simulations indicate limitations for
floor heating storage due to absorption of solar energy within the house. To balance power for district
renewable energy supply, substantial energy can be stored into the floor without violating comfort limits.
Heat loss to the outside due to floor heating storage is small in case of low energy houses and can be
financially compensated. This may result in a proposition for residents which is equivalent to heating
without thermal storage for power balancing purposes.
1 INTRODUCTION
For the smart grid demonstration project
Meppelenergie, funded by the Dutch program
Switch2Smartgrids, we develop smart grid control
for the energy system of the new Meppel district
Nieuwveense landen (AgentschapNL, N.D.).
The Meppel energy concept consists of a biogas
CHP (Combined Heat and Power engine), heat
pumps and underground thermal storage. The CHP
is the main electric and thermal heat generator. The
heat is used for a district heating system, supplying
part of the houses in the district with domestic hot
water and space heating. The electricity is used to
drive heat pumps placed at houses with no
connection to the district heating. The heat pumps
supply these houses with domestic hot water and
space heating. The heat source for the heat pumps is
an underground aquifer which consists of a warm
and cold well. During the heating season, the warm
well provides heat for the heat pumps, during the
cooling season, the cold well provides cooling
energy for the houses.
Using heat pumps together with underground
aquifers is increasingly applied in the Netherlands
for commercial buildings, e.g. hospitals, office parks
and malls (Rijkswaterstaat, 2013). Within housing
projects, underground aquifers are mainly used for
apartment buildings. Houses often use closed
systems such as underground heat exchangers (CBS,
2011) and as an example (Witte et al., 2006).
For the Meppel district heating, there are large
water stores to store thermal energy from the CHP,
which is beneficial for the heat grid control. The
houses with a heat pump have a domestic hot water
storage but not for space heating. However, some
storage capacity can be provided by thermal storage
within the inert concrete floor heating system, which
we will name Floor Heating Thermal Energy
Storage (FHTES) throughout the paper. The
application and economics of such a storage system
within smart grid electricity control is investigated in
(Toersche et al., 2012) and (Nykamp et al., 2012)
which demonstrates that investments for
strengthening the electricity grid can be avoided by
applying FHTES for demand side control. However,
FHTES has immediate effects on thermal comfort of
43
van Leeuwen R., de Wit J., Fink J. and Smit G..
Thermal Storage in a Heat Pump Heated Living Room Floor for Urban District Power Balancing - Effects on Thermal Comfort, Energy Loss and Costs
for Residents.
DOI: 10.5220/0004916300430050
In Proceedings of the 3rd International Conference on Smart Grids and Green IT Systems (SMARTGREENS-2014), pages 43-50
ISBN: 978-989-758-025-3
Copyright
c
2014 SCITEPRESS (Science and Technology Publications, Lda.)

residents and also on energy loss of the building and
therefore costs for the residents, which are not
investigated yet. The problem statement for this
paper is therefore: what are the effects on thermal
comfort if energy is stored in the floor heating
system, what is the energy loss and what are the
related financial consequences?
Contribution of this paper is to develop
mathematical relations and to demonstrate the
relation between FHTES, thermal comfort, energy
loss and energy costs. These insights and relations
are to be used for developing algorithms to control
district heating and heat pumps.
Outline of this paper: Chapter 2 describes related
works on Thermal Activated Building Systems
(TABS), control and performance. Chapter 3 gives
theoretical backgrounds on modelling and thermal
comfort. Chapter 4 describes a case study, followed
by results and discussion in chapter 5. Conclusions
are drawn in chapter 6. The appendix contains a list
of abbreviations and the applied thermal network
model.
2 RELATED WORK
In this section we discuss related work on TABS and
power balancing by FHTES.
FHTES is investigated for different applications.
One of the applications is cooling offices by thermal
activation of floors during night hours (Fellin and
Sommer, 2003), (Lehmann et al., 2007), (Pavlov and
Olesen, 2011), (Rijksen et al., 2010) and (Saelens et
al., 2011). Another application is lowering peak
heating power for residential buildings (Airaksinen
and Vuolle, 2013). More close to our application is a
study on measured performance of heating and
cooling systems using TABS in apartments (Alvi
and Qureshi).
Besides effects on thermal comfort, FHTES also
influences energy loss of the building and therefore
energy costs paid by the residents. In (Scheepens,
2013) the ecocost approach was applied to
investigate a novel house heating/cooling system
with individual room temperature control for the
Meppel project. In (Tahersima et al., 2011) the
contribution of a control strategy for power
balancing and FHTES is investigated. Thermal
tolerance is introduced as a measure for effects on
thermal comfort due to FHTES. In (Verhelst et al.,
2012) optimal heat pump control in case of floor
heating in relation with varying electricity prices is
investigated. Thermal discomfort is introduced as a
measure for effects on thermal comfort. Instead of
using thermal tolerance or thermal discomfort, we
propose in this paper to develop measures from
governing standards on thermal comfort, as outlined
in section 3.2.
Most of the mathematical work within the cited
papers is applicable for general use. However,
effects on thermal comfort, energy loss and energy
costs are not investigated yet in a way corresponding
with thermal comfort standards. Therefore we
investigate how thermal comfort is influenced by
FHTES and from this we deduce constraints and
guidelines for control algorithms.
3 MODELLING APPROACH
In this section we define a simulation model and
constraints from theory on thermal comfort.
3.1 Thermal Network Model
The thermal network approach is a convenient way
to demonstrate the relation between FHTES, energy
demand and effects on thermal comfort. Another
reason to adopt this approach is to use the model
equations for model predictive control within the
TRIANA smart grid control method (Molderink,
2011), which is a part of future work. Accuracy of
thermal networks is demonstrated in (Liu et al.,
2011) and (Bacher and Madsen, 2011).
The applied thermal network for the living room
of typical Dutch low energy house as defined by
(AgentschapNL, 2013) and model equations are
shown in the appendix. The concrete floor, the zone
including internal separation walls, inner and outer
parts of envelope walls and ceiling are modelled as
temperature nodes with a thermal capacitance. Solar
gains are defined at the outer wall node and the zone
node by window transmittance. Heat loss due to
ventilation and infiltration is defined at the zone
node, as well as appliances and people gains.
Heating input is defined at the floor node.
Weather data from Hoogeveen (close to Meppel)
of ambient temperature and global transmittance, i.e.
total solar radiation on the horizontal plane is used
as input data within the model. Solar radiation on
building planes is calculated using correlations by
(Erbs, 1982) and equations by (Duffie, 1980).
Transmitted radiation through the windows is for
25% absorbed by the floor and 75% by the zone
structure. The house orientation is ideal for passive
solar gains and there are no obstacles which could
cast shadows on the house surfaces. In practise, this
may not always be the case, especially not in mid-
SMARTGREENS2014-3rdInternationalConferenceonSmartGridsandGreenITSystems
44

winter when the sun is quite low above the horizon.
The simulation model includes Proportional
Integral (PI) control of the heating/cooling input to
the floor with the error between the zone
temperature and its set point as controlled variable.
3.2 Theory on Thermal Comfort
The thermal network model of the living room is
defined in such a way that it is possible to calculate
the operative temperature of the zone. The operative
temperature is defined in (ISO, 2005) and
(ASHRAE, 2010) and is the most important comfort
parameter to evaluate the influence of radiation from
surfaces and air convection on experienced human
thermal comfort. For relatively low air velocities
applicable for home situations, the operative
temperature of a zone is calculated from (ASHRAE,
2010):
2
TT
T
radair
op
(1)
In which T
air
is the zone air temperature and T
rad
is
the mean radiation temperature of all surfaces
surrounding a person. It is impractical to calculate
T
rad
for each person as this also depends on the place
where the person is situated in a room. Hence an
average for a zone is proposed based on (ASHRAE,
2009).
6
1i
4
ii
6
1i
i
4
rad
TAAT
(2)
The living room zone is surrounded by 6 surface
areas A
i
with surface temperature T
i
. Guidelines for
the operative temperatures are defined in ISO 7730
and are related to the outdoor temperature in case
adaptivity to outdoor conditions is taken into
account:
• If T
outdoor
< 10°C then 20°C < T
op
< 24°C
• If T
outdoor
> 15°C then 22°C < T
op
< 26°C
A heated or cooled floor has an effect on the mean
radiant temperature and on the operative
temperature. But according to ISO 7730, a warm or
cold floor also directly influences the thermal
comfort of people. Limits can be calculated from the
percentage dissatisfied equation given in ISO 7730
which yields: 19,2°C < T
f
< 28°C.
According to ISO 7730, another constraint is on
dynamic changes of the operative temperature.
Periodic peak-to-bottom variations should be limited
to 1°C which is combined with a maximum rate of
change of less than 2°C/hour.
Limits on radiant asymmetry pointed out in ISO
7730 are quite large and therefore not relevant for
floor heating systems.
For home applications, it is worth to note the
following:
1. ISO standard 7730 is developed and validated
mainly for people working in offices and
schools. People may evaluate thermal comfort
different in a home situation, while people are
more at rest while being at home. Besides that
older aged people tend for higher operative
temperatures than younger people. This causes
differences in energy demand between
households, which is important to take into
account for the energy system configuration.
2. The minimum allowable floor temperature may
not be reached during the heating season, as the
floor heating will have to compromise heat loss
of the house. So the minimum floor temperature
is the floor temperature which is necessary to
maintain a comfortable operative temperature of
the zone.
3. The minimum allowable floor temperature limits
cooling capacity of the floor cooling system
during the summer season.
4 CASE DESCRIPTION
In this section we describe relevant details for the
living room model and define scenarios for the case
study.
Model parameters, i.e. specific mass of the
concrete floor, ceiling and walls are derived from
Dutch building details (Bouwformatie, 2013),
(BUVA, 2013) and (VIEGA, 2009), which are
currently applied for low energy houses in the
Netherlands. The floor is a hollow channel concrete
type. On top of the floor, the floor heating tubes are
laid on a grid mat filled up with a concrete casting.
Specific density of the total floor is typically 514
kg/m
2
. The ceiling has the same structure as the
floor. The envelope wall consists of a concrete inner
wall, insulation material, air gap and brick outer
wall.
To calculate electricity demand for the heat
pump, a constant COP of 4,5 is assumed at all times.
Weather data of February 2012 from station
Hoogeveen is used. Simulation results are shown for
the 2
nd
week which runs from hour 168 to 336, i.e.
midnight of the 1
st
until the 7
th
day.
The following control scenarios are investigated:
1. Control 1: Constant temperature set point of
20°C.
ThermalStorageinaHeatPumpHeatedLivingRoomFloorforUrbanDistrictPowerBalancing-EffectsonThermal
Comfort,EnergyLossandCostsforResidents
45

2. Control 2: Varying temperature set point: 19,5°C
at night, 20,5°C at day. Control 2 is scheduled in
such a way that operative temperatures are
within thermal comfort limits during daytime
hours and total energy demand is comparable to
control 1.
3. Control 3: Same as scenario 2 but with additional
short term storage for district power balancing.
Besides these control scenarios, the following
energy price schemes are investigated:
1. Conventional: conventional power grid with
lower night time energy rates.
2. Alternative: district power grid based on
renewable PV-generation. Lower rates apply
during hours with sunshine and higher rates
during hours without sunshine.
5 DISCUSSION OF RESULTS
Simulated heating input for control 1 is shown in
Figure 1 together with the global transmission, G
t,h
and the operative temperature of the living room.
The influence of solar absorption by the interior of
the living room can be observed as hours of less or
even no required heating input. Besides this positive
effect, this however reduces the possibilities for
FHTES by the heat pump, as is deduced from the
operative temperature. As explained in section 3.2,
operative temperature variation should be less than
1°C, so the allowable range for this case is 20-21°C.
On the 1st day, 21,3°C is reached due to solar
absorption. As this is just outside the allowable
range and energy can be saved by using the absorbed
solar energy, possibilities to store energy by the heat
pump are limited. It is also observed that as solar
energy decreases the remainder of the week, longer
periods of heating energy are required and operative
temperatures are more stable, enabling more
possibilities for FHTES by a heat pump.
To study heat loss, control 3 is introduced, which
is basically the same as control 2 but with small
additional two hour storage periods taking place at
the indicated circles in Figure 3. As is observed from
Figure 2, the heating input of control 3 is shifted in
time compared to control 2. A simple way to
accomplish this in a smart grid is that the central
controller asks the home controller to temporarily
raise the temperature set point. The total stored
energy in the floor during each shift is 1600 Wh.
Observe from Figure 2 that the total energy demand
for the whole week is almost not influenced by these
storage periods. The additional energy loss is
calculated at 479 Wh, i.e. 6% of the total charged
energy (8.000 Wh). This is rather small because of
(a) good insulation of the house and (b) stored heat
is consumed by the interior and results in a period of
less heating input, observe the larger drop in the
heating input of control 3 after each storage period,
compared to control 2.
The effects of the storage periods on the
operative temperature are shown in Figure 3
(compare control 3 with 2). The last four peaks
almost reach to 21°C, which is just within the
allowable range. The operative temperature seems to
increase quite fast, but still less than 0,5°C/h, well
below the requirements set out in section 3.2.
The short term storage period which was just
calculated is significant for district power balancing.
For the living room, the average heating requirement
during the investigated week is calculated at 475 W.
Figure 1: Floor heating input and operative temperature for control 1.
SMARTGREENS2014-3rdInternationalConferenceonSmartGridsandGreenITSystems
46
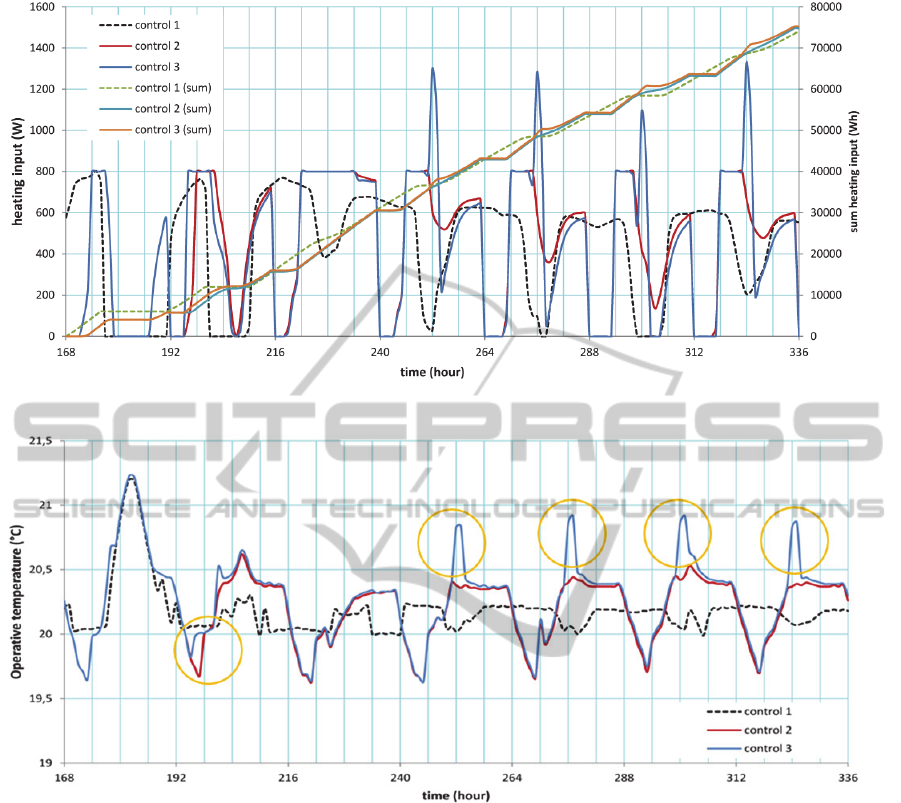
Figure 2: Heating input and sum of heating input to floor heating system.
Figure 3: Operative temperatures.
With the heat pump COP assumed at 4,5 the
CHP has to deliver on average 106 W electric
energy to the living room. The short term storage
period just investigated involved 800 W, i.e. 178 W
electric energy. This is 168% of the average electric
energy demand. Hence we conclude that floor
heating systems can be used very well for short term
periods of storage for district power balancing.
To study energy costs for the residents, the
simulated energy input for the three control methods
is translated into total required electric energy which
is multiplied by energy price rates. A high rate of
€0,30/kWh and low rate of €0,20/kWh including
taxes and network costs are defined, i.e. close to
actual Dutch consumer electricity rates.
Energy costs for the investigated week are
referred to the reference case on the first line (i.e.
100%) in Table 1. As observed from Table 1 costs
are higher for control 2 than for control 1 in case of
a conventional power grid (compare both grey
marked lines), because energy demand for control 2
is shifted towards daytime hours.
In case of PV-generation, control 1 has higher
costs and control 2 has lower costs, as is observed
from the 2
nd
and 4
th
line of Table 1.
Control 3 (5
th
line, Table 1) has the same basic
temperature control as control 2 (lower night time
temperature) but with some additional heat storage
periods during day hours, typical for district power
balancing in case of PV-generation. If on average
the heat storage is offered for €0,21/kWh then the
costs are comparable to the reference.
As a general rule for the storage rate, the
standard rate for the applicable hour should be
ThermalStorageinaHeatPumpHeatedLivingRoomFloorforUrbanDistrictPowerBalancing-EffectsonThermal
Comfort,EnergyLossandCostsforResidents
47

reduced with the percentage energy loss (i.e. 6% in
this case) caused by storage to offer a cost neutral
proposition for the residents.
Table 1: Results energy cost comparison.
control peak rate hours
energy costs (%)
1 07.00-23.00 100
1
18.00-24.00
0.00-09.00
112
2 07.00-23.00 119
2
18.00-24.00
0.00-09.00
100
3
18.00-24.00
0.00-09.00
100
6 CONCLUSIONS
By simulation the amount of Floor Heating Thermal
Energy Storage (FHTES) by a renewable energy
supply system, energy loss and cost strategies
associated with FHTES is investigated. Resulting
values are case specific, but the observed effects on
energy demand and operative temperatures due to
FHTES are valid for any building equipped with
floor heating.
Our simulations show that the amount of energy
that can be stored in a floor heating system depends
on the house and floor heating structure, degree of
insulation, weather and temperature settings by the
residents.
From theory on thermal comfort, we find the
following constraints for FHTES:
• allowable room operative temperature range: 20
to 24°C.
• periodic operative temperature variation: less
than 1°C peak to bottom.
• operative temperature rate of change: less than
2°C/hour.
• allowable floor surface temperature range: 19 to
28°C.
In our simulations we compare three types of
temperature control. A constant day/night
temperature set point (control 1) shows that heating
demand mostly occurs at night hours. A lower set
point during night hours (control 2) shifts heating
demand towards day hours. For district power
balancing, control 2 has the advantage that the heat
pump can be used more flexible during the night for
generating domestic hot water. If additional to
control 2, short storage periods during daytime hours
are introduced (control 3), we find that operative
temperatures remain within allowable comfort
limits. We conclude from this that a house with a
floor heating system provides substantial storage
capacity which can be used to maintain power
balance within a district energy supply system.
Energy loss due to FHTES appears to be small,
at least for low energy houses. However, a fair
energy cost policy should take this loss into account,
e.g. by offering a discount energy storage rate to
residents. In this way FHTES can facilitate district
power balancing while maintaining acceptable levels
of thermal comfort and energy costs for residents.
Our future work will be dedicated to further
research on district power balancing and algorithms
for smart grid control in which we apply knowledge
presented in this paper.
REFERENCES
Agentschapnl. N. D., Meppel heats new housing
development with biogas. Available:
http://www.agentschapnl.nl/sites/default/files/Meppel
heats new housing development with biogas.pdf,
retrieved: 18-10-2013.
Agentschapnl. 2013. Referentiewoningen nieuwbouw
2013. Available: http://www.agentschapnl.nl/sites/
default/files/2013/09/Referentiewoningen.pdf, retrie-
ved: 18-10-2013.
Airaksinen, M. & Vuolle, M. 2013. Heating Energy and
Peak-Power Demand in a Standard and Low Energy
Building. Energies, 6, 235-250.
Alvi, A. & Qureshi, 2011, H. F. Evaluation of Building
Integrated Heating System in Terms of Thermal
Comfort & Energy Efficiency, Mälardalen University,
Sweden.
ASHRAE 2009. ASHRAE Handbook-Fundamentals,
Atlanta, American Society of Heating, Refrigerating
and Air-Conditioning Engineers (ASHRAE).
ASHRAE 2010. ASHRAE standard 55-2010 Thermal
environmental conditions for human occupancy.
Atlanta, USA: American Society of Heating,
Refrigerating and Air-Conditioning Engineers
(ASHRAE).
Bacher, P. & Madsen, H. 2011. Identifying suitable
models for the heat dynamics of buildings. Energy and
Buildings, 43, 1511-1522.
Bouwformatie 2013. Available: http://bouwdetails.
bouwformatie.nl., retrieved: 18-10-2013.
BUVA 2013. BUVA bouwdetails [Online]. Available:
buva.archidat.nl., retrieved: 18-10-2013.
CBS 2011, Hernieuwbare energie in Nederland 2011.
Heerlen: CBS.
Duffie, J. A., Beckman, W. A. 1980. Solar engineering of
thermal processes, New York, Wiley.
Erbs, D. G., Klein, S. A., Duffie, J. A. 1982. Estimation of
the diffuse radiation fraction for hourly, daily and
monthly-average global radiation. Solar Energy, 28,
293-302.
Fellin, F. & Sommer, K. 2003. Study of a low energy
office building with thermal slabs and ground coupled
SMARTGREENS2014-3rdInternationalConferenceonSmartGridsandGreenITSystems
48

heat pump. Dipartimento di Fisica Tecnica, Università
di Padova (Italia).
ISO 2005. NEN-EN-ISO 7730 Ergonomics of the thermal
environment - Analytical determination and
interpretation of thermal comfort using calculation of
the PMV and PPD indices and local thermal comfort
criteria (ISO 7730:2005,IDT). Delft: NEN.
Lehmann, B., Dorer, V. & Koschenz, M. 2007.
Application range of thermally activated building
systems tabs. Energy and Buildings, 39, 593-598.
Liu, K., Tian, Z., Zhang, C., Ding, Y. & Wang, W. 2011.
Establishment and validation of modified star-type
RC-network model for concrete core cooling slab.
Energy and Buildings, 43, 2378-2384.
Molderink, A. 2011. On the tree step methodology for
smart grids. University of Twente.
Nykamp, S., Molderink, A., Bakker, V., Toersche, H.,
Hurink, J. & Smit, G. 2012. Integration of heat pumps
in distribution grids: Economic motivation for grid
control. 3rd IEEE PES International Conference and
Exhibition on Innovative Smart Grid Technologies
(ISGT Europe), IEEE, 1-8.
Pavlov, G. K. & Olesen, B. W. 2011. Building thermal
energy storage-concepts and applications, Technical
University of Denmark.
Rijksen, D. O., Wisse, C. J. & Van Schijndel, A. W. M.
2010. Reducing peak requirements for cooling by
using thermally activated building systems. Energy
and Buildings, 42, 298-304.
Rijkswaterstaat. 2013. WKO tool. Available:
www.wkotool.nl, retrieved: 21-10-2013.
Saelens, D., Parys, W. & Baetens, R. 2011. Energy and
comfort performance of thermally activated building
systems including resident behavior. Building and
Environment, 46, 835-848.
Scheepens, A. E., Flipsen S.F.J., Vogiatzakis, P., Brezet,
J.C. 2013. An Ecocost-Value Ratio (EVR) approach to
the design of a Product-Service System for
environmentally sustainable residential heating energy
use. Energy and Environment Knowledge Week -
E2KW2013. Toledo, Spain.
Tahersima, F., Stoustrup, J., Meybodi, S. A. &
Rasmussen, H. 2011. Contribution of domestic heating
systems to smart grid control. 50th IEEE Conference
on Decision and Control and European Control
Conference (CDC-ECC), IEEE, 3677-3681.
Toersche, H., Bakker, V., Molderink, A., Nykamp, S.,
Hurink, J. & Smit, G. Controlling the heating mode of
heat pumps with the TRIANA three step methodology.
2012 IEEE PES Innovative Smart Grid Technologies
(ISGT), IEEE, 1-7.
Verhelst, C., Logist, F., Van Impe, J. & Helsen, L. 2012.
Study of the optimal control problem formulation for
modulating air-to-water heat pumps connected to a
residential floor heating system. Energy and
Buildings, 45
, 43-53.
VIEGA 2009. Technische handleiding Fonterra vloer- en
wandverwarming, Available: http://www.viega.nl/cps/
rde/xbcr/nl-nl/Technische_handleiding_Fonterra_
vloer_en_wandverwarming.pdf, retrieved: 18-10-
2013.
Witte, H., Van Gelder, A., Klep, P. & Groenholland, B.
2006. A very large distributed ground source heat
pump project for domestic heating:
Schoenmakershoek, Etten-Leur (the Netherlands).
Proceedings Ecostock, the Tenth International
Conference on Thermal Energy Storage. New Jersey,
2006.
APPENDIX
This appendix contains the applied thermal network
model and state equations for the temperature nodes.
The used symbols and subscripts are listed in Table
2.
Table 2: Symbols and subscripts.
Nomenclature
T Temperature
R thermal resistance
E electric energy
q thermal energy
HP heat pump
Subscripts
z zone
f floor
c ceiling
z2 zone on first floor above living room
cs creeping space
wi interior wall of envelope wall
wo exterior wall of envelope wall
rad radiation
cv convection
a ambient or outdoor
Thermal network model equations
(3)
)
zgain,
zf
zf
zw
zwi
win
za
zc
zc
z
z
q
R
TT
R
TT
R
TT
R
TT
dt
dT
C
fgain,
fc
fc
fcs
fcs
zf
fzf
f
q
R
TT
R
TT
R
TT
dt
dT
C
wo-wi
wiwo
zwi
wizwi
wi
R
TT
R
TT
dt
dT
C
fc
cf
cz2
cz2
zc
czc
c
R
TT
R
TT
R
TT
dt
dT
C
wogain,
rad-wo
wosky
cv-wo
woa
wo-wi
wowiwo
wo
q
R
TT
R
TT
R
TT
dt
dT
C
ThermalStorageinaHeatPumpHeatedLivingRoomFloorforUrbanDistrictPowerBalancing-EffectsonThermal
Comfort,EnergyLossandCostsforResidents
49

Figure 4: Thermal network model of low energy house living room.
SMARTGREENS2014-3rdInternationalConferenceonSmartGridsandGreenITSystems
50
