
Computer-aided Diagnosis of Retinopathy of Prematurity via Analysis of
the Vascular Architecture in Retinal Fundus Images of Preterm Infants
Faraz Oloumi
1
, Rangaraj M. Rangayyan
1
and Anna L. Ells
1,2
1
Department of Electrical and Computer Engineering, Schulich School of Engineering,
University of Calgary, Calgary, AB, Canada
2
Division of Ophthalmology, Department of Surgery, Alberta Children’s Hospital, Calgary, AB, Canada
1 RESEARCH PROBLEM
Retinopathy of prematurity (ROP) is a disorder that
affects the development of blood vessels in the retina
of premature infants, and is the leading cause of pre-
ventable childhood blindness (International Commit-
tee for the Classification of Retinopathy of Prema-
turity, 2005). Because advanced ROP can progress
rapidly in the first 8 to 12 weeks of life, prompt iden-
tification of high-risk features of the disease is crit-
ical to the management of the affected infants. The
posterior signs that are indicative of the presence of
ROP are the straightening of the major temporal ar-
cade (MTA), a decrease in the angle of insertion of
the MTA, and increased dilation and tortuosity of the
arteriole and venular vessels (International Commit-
tee for the Classification of Retinopathy of Prema-
turity, 2005; Cryotherapy for Retinopathy of Prema-
turity Cooperative Group, 2001; Wilson et al., 2006;
Wong et al., 2011; Wilson et al., 2008).
The presence of plus disease can be indicative of
the severity of active ROP. Plus disease is diagnosed
by the presence of a certain amount of increase in
venular dilation and arteriole tortuosity in at least two
quadrants of the eye (International Committee for the
Classification of Retinopathy of Prematurity, 2005).
The presence of sufficient dilation and tortuosity of
the posterior vessels for the diagnosis of plus disease
is determined by visual comparison to a gold standard
retinal fundus photograph (International Committee
for the Classification of Retinopathy of Prematurity,
2005; Watzke et al., 1990; Wilson et al., 2008). A se-
vere form of ROP, called aggressive posterior ROP,
shows increase in the dilation and tortuosity of the
blood vessels in all four quadrants at early stages of its
development (International Committee for the Classi-
fication of Retinopathy of Prematurity, 2005).
The angle of insertion of the MTA has been
loosely defined as the angle between the superior and
inferior temporal arcades (STA and ITA) as they di-
verge from the optic nerve head (ONH) and extend
towards the periphery of the retina (Wilson et al.,
2006; Cryotherapy for Retinopathy of Prematurity
Cooperative Group, 2001). Despite the clinical im-
portance of abnormal changes in the architecture of
the MTA, only the angle of insertion of the MTA has
been quantified manually in only two studies dealing
with ROP (Wilson et al., 2006; Wong et al., 2011).
Treatment of ROP is primarily driven by the iden-
tification of the above-mentioned features via clini-
cal examination or photographic documentation. The
current clinical method for diagnosis of plus disease
is subjective. As shown by Chiang et al. (Chiang
et al., 2007), among 22 recognized ROP experts who
performed diagnosis of plus disease on 34 images of
preterm infants based on a three-level classification
(plus, preplus, and neither), the experts agreed on the
diagnosis of only 12% of the images (four out of 34).
It is likely that no optimal visual reference standard
exists for the diagnosis of plus disease, as shown by
disagreement even among recognized experts(Chiang
et al., 2007; Wallace et al., 2008). Such studies show
the need for computer-aided methods to quantify the
changes in retinal blood vessels in the presence of
plus disease. Computer-aided diagnosis (CAD) and
quantitative analysis of the vascular architecture of
the retina could assist in monitoring the evolution and
stages of ROP, their effects on the visual system, and
the response to treatment.
2 OUTLINE OF OBJECTIVES
The aim of the proposed thesis is the derivation of
various diagnostic features and measures to perform
CAD of ROP in retinal fundus images of preterm in-
fants. Diagnostic parameters characterizing the vas-
cular architecture, in terms of quantification of the
openness of the MTA, as well as measurements of the
thickness and tortuosity of the blood vessels, will be
derived and analyzed to follow quantitatively the ef-
fects of pathology on retinal vessels, as well as the
58
Oloumi F., Rangayyan R. and Ells A..
Computer-aided Diagnosis of Retinopathy of Prematurity via Analysis of the Vascular Architecture in Retinal Fundus Images of Preterm Infants.
Copyright
c
2014 SCITEPRESS (Science and Technology Publications, Lda.)

effects of treatment in ROP cases. The methods will
be tested with an established longitudinal database
{Telemedicine for ROP In Calgary (TROPIC) (Hilde-
brand et al., 2009)}, available at the Alberta Chil-
dren’s Hospital. The results will be evaluated quan-
titatively by comparing against delineation of the cor-
responding features by an expert ophthalmologist (Dr.
A. L. Ells). Quantitative models correlating the ob-
tained parameters with the effects of pathology and
treatment will be derived and verified.
3 STAGE OF THE RESEARCH
The present research study has passed the preliminary
stages of planning and review and is at the stage of im-
plementation of the proposed methodology with some
initial results already obtained. The current state-of-
the-art methodology, or lack thereof, has been estab-
lished and reviewed and based on this, new and novel
methodology is proposed, as explained in Section 5.
4 STATE OF THE ART
The proposed thesis and its underlying research work
consists of quantification of the openness of the MTA,
as well as thickness and tortuosity of the vessels. The
current state-of-art methods relating to the computa-
tion of each parameter are reviewed in the following
sections.
4.1 Measurement of the Angle of
Insertion of the MTA
Wilson et al. (Wilson et al., 2006) measured the an-
gle of insertion of the MTA as follows: the center of
the ONH and the fovea are manually marked by two
independent observers. A line is drawn through the
manually marked centers of the ONH and the fovea;
this is the retinal raphe. The image is rotated so that
the retinal raphe is horizontal. A line perpendicular to
the retinal raphe is drawn from the fovea until it in-
tersects the ITA and the STA. From the intersections,
two lines are drawn to the center of the ONH. The to-
tal arcade angle (TAA) is defined as the sum of the in-
ferior and the superior arcade angles (IAA and SAA).
A significant level of acuteness in the IAA of the left
eye was associated between stage 0 and 1, stage 1 and
2, and stage 1 and 3 of ROP (higher numbers indicate
higher severity of ROP).
In a follow-up study by Wong et al. (Wong et al.,
2011), semiautomated measurements were made of
four angles of the temporal and the nasal venules and
arterioles. The procedures required manual editing of
automatically detected vessels. The vertex of all an-
gles was set at the center of the ONH, and the other
two points were obtained automatically as the inter-
section of a circle of radius 60 pixels with the pre-
viously marked major arteriole and venule branches
on both the temporal and the nasal sides. The angles
of the temporal venules and arterioles were found to
have statistically significant differences between nor-
mal cases and stage 3 ROP. However, when all stages
of ROP were combined, only the angle of the tempo-
ral arterioles indicated statistically significant differ-
ence as compared to the normal cases.
Ells and MacKeen (Ells and MacKeen, 2008) il-
lustrated that the changes that occur in the MTA in the
presence of ROP are dynamic as they alter the poste-
rior architecture of the MTA. Based on this, we be-
lieve that the arcade angle measures proposed by Wil-
son et al. (Wilson et al., 2006) and Wong et al. (Wong
et al., 2011) may not accurately reflect such changes
that occur over the entire posterior architecture of the
MTA, as they only define the openness of the MTA
based on three points and the methods are similar to
fitting a triangle to the MTA. Furthermore, only the
location of the vertex of the arcade angle has been
consistently defined as the center of the ONH; the lo-
cations of the other two points have been defined in
different manners. Moreover, the value of the arcade
angle is sensitive to the location of the center of the
ONH provided by the user; a difference of 10 pixels
in the location of the marked center of the ONH can
result in a difference of 10
◦
in the measured arcade
angle.
4.2 Measurement of Vessel Thickness
and Tortuosity
Using a binary vessel map, Heneghan et
al. (Heneghan et al., 2002) computed the vessel
width by extending a line segment, in different
directions, from a pixel that belongs to the vessel
on both sides in opposite directions until nonvessel
pixels were encountered. The width of the vessel
was taken as the smallest distance over all angles.
Heneghan et al. also obtained the tortuosity of the
vessels by first dividing a vessel into smaller linear
segments and then dividing the total length of a vessel
by the length of its chord.
Wilson et al. (Wilson et al., 2008) measured the
vessel width using two different methods. As one
measure, the standard deviation of the Gaussian pro-
file that was used to detect the blood vessels was used.
As a second measure, the correlated measure of to-
Computer-aidedDiagnosisofRetinopathyofPrematurityviaAnalysisoftheVascularArchitectureinRetinalFundus
ImagesofPretermInfants
59

tal isotropic contrast at the vessel center-line along
the entire length of the vessel was used. Wilson et
al. (Wilson et al., 2008) also measured the tortuos-
ity of a blood vessel by dividing a vessel segment
into smaller segments using the bisector of each seg-
ment and the length of their chords until a minimum
chord length was reached. The tortuosity of the vessel
was computed by considering the change in the chord
length after division of each segment into two parts.
Fiorin and Ruggeri (Fiorin and Ruggeri, 2011)
proposed semiautomated methods for measurement
of vessel thickness and tortuosity in narrow-field reti-
nal fundus images of preterm infants using a web-
based graphical user interface (GUI). The center-line
of the vessel to be analyzed was selected manually
and the edges of the vessel were extracted using the
Canny filter. The vessel width and tortuosity were
then computed using the center-line and by associat-
ing pairs of points on opposite edges so that a line
through the two points would be perpendicular to the
vessel center-line.
By finding the branching and the end points of a
vessel skeleton map, Gelman et al. (Gelman et al.,
2005) divided a vessel into smaller segments. The
tortuosity was measured as the sum of the length of
all such segments divided by the length of the chord
of the entire vessel. The width of the vessel was mea-
sured as its total divided by its length.
Poletti et al. (Poletti et al., 2012) used vari-
ous forms of vessel-level tortuosity such as angle-
based tortuosity, caliber-weighted angle-based tortu-
osity, and twisted-based tortuosity to derive eight dif-
ferent measures of tortuosity. A linear weighted com-
bination of the eight different measures was then ob-
tained to represent an image-level tortuosity measure
for each image.
4.3 Detection of the MTA for the
Localization of other Anatomical
Features
Because the MTA originates from the ONH and fol-
lows a curved, almost parabolic, path towards the
macula, it can be used to detect or estimate the posi-
tion of the ONH. Furthermore, relative to the location
of the ONH, the macular region can also be estimated
or detected (Foracchia et al., 2004; Li and Chutatape,
2004; Tobin et al., 2007; Fleming et al., 2007; Ying
and Liu, 2010).
Using an estimate of the ONH location and a bi-
narized image of the vasculature, Tobin et al. (Tobin
et al., 2007) proposed to apply a parabolic model to
the statistical distribution of a set of points given by a
morphologically skeletonized vascular image to find
an estimate of the retinal raphe. A parabola of the
form ay
2
= |x| was modified to accommodate for the
shifted vertex at the most likely ONH location and
the angle of rotation of the retinal raphe, β. The re-
sulting model and the skeletonized image were used
with a least-squares method to estimate the parame-
ters a and β. Even though Tobin et al. estimated the
openness of the parabolic model, it was only used to
draw a parabola on the image.
Fleming et al. (Fleming et al., 2007) proposed a
method to extract the MTA by means of vessel en-
hancement and semielliptical curve fitting using the
generalized Hough transform (GHT). First, the ves-
sels were enhanced to get a magnitude image and a
phase image of the vascular architecture. Assuming
that, having an edge map and knowing the orientation
of the arcade, a reference point can only be at one
of a few locations, the GHT was applied to a skele-
tonized image of the vasculature. The Hough space
dimension was set to be five, with variables for incli-
nation, horizontal axis length, left or right opening,
and the location of the center of the ellipse. Anatom-
ical restrictions were applied to the variables to limit
the number of semiellipses generated by the method.
The global maximum in the Hough space was selected
as the closest fit to the MTA.
Ying and Liu (Ying and Liu, 2010) obtained a vas-
cular topology map using an energy function defined
as the normalized product of the local blood vessel
width and density. A quantile threshold was used on
the vascular topology map to extract the pixels in a
high-energy band. A circle-fitting method was ap-
plied to the extracted pixels to model the MTA as a
circle, which was then used to localize the macula.
By using the supremum of openings operator on
an enhanced grayscale image of blood vessels, Welfer
et al. (Welfer et al., 2010) extracted the STA and
the ITA to locate the center of the optic nerve head
(ONH). A set of 24 linear structuring elements of
length 80 pixels was used to extract the MTA. The re-
sulting image was binarized, skeletonized, and pruned
to obtain a binary image that represented the STA and
the ITA.
Even though the structure of the MTA has been
used to estimate the ONH and the macula in previ-
ously reported works, only Tobin et al. modeled the
arcade for parametrization of its openness; however,
they used the openness parameter only to draw the
parabolic model on the image.
VISIGRAPP2014-DoctoralConsortium
60
5 METHODOLOGY
5.1 Previously Conducted Work
This section provides a description of the preliminary
work that has been conducted to date and tested based
on the proposed thesis objectives. These include, but
are not limited to, algorithms for the detection of reti-
nal vessels, algorithms for the detection and model-
ing of the MTA, and design of a GUI to facilitate the
for implementation and application of the proposed
methods in a clinical setting.
5.1.1 Detection of Blood Vessels
Real Gabor filters, which are optimal for the detection
of piecewise linear and oriented features, are used for
the detection of the blood vessels (Rangayyan et al.,
2008). The preprocessing steps for vessel detection
include:
1. Normalizing each color component in the original
image.
2. Computing the luminance component.
3. Thresholding the luminance component to obtain
the effective area.
4. Extending the luminance component beyond the
effective area to avoid the detection of its edges.
The details of Gabor filtering, as well as the results
of single-scale and multiscale analysis obtained with
retinal fundus images from the Digital Retinal Images
for Vessel Extraction (Staal et al., 2004) (DRIVE)
database are provided by Rangayyan et al. (Ran-
gayyan et al., 2008). The accuracy of the results was
determined in comparison with the ground-truth im-
ages of the vessels provided in the DRIVE database
and quantified in terms of the area under the receiver
operating characteristic (ROC) curve.
5.1.2 Modeling of the MTA
By using a large thickness value when detecting blood
vessels using the Gabor filters, it is possible to em-
phasize the presence of the MTA, which is the thick-
est branch of the blood vessels in the retina (Oloumi
et al., 2012c). The steps involved in single- and dual-
parabolic modeling of the MTA, STA, and ITA are:
1. Obtaining the skeletons of the MTA, the ITA, and
the STA:
(a) Obtaining the Gabor magnitude response to
represent the MTA (Rangayyan et al., 2008).
(b) Separating the Gabor magnitude response im-
age into its superior and inferior parts to repre-
sent the STA and the ITA, respectively.
(c) Binarizing the Gabor magnitude response im-
ages of the MTA, the ITA, and the STA.
(d) Skeletonizing the binary images.
(e) Applying the morphological process of area
open to filter the skeletons.
2. Detecting parabolas and semiparabolas using the
GHT (Oloumi et al., 2012c):
(a) Rotating each skeleton image by 180
◦
, if the
MTA opens to the left (i.e., the image is of the
right eye).
(b) Cropping each skeleton image horizontally.
(c) Applying the GHT to the preprocessed skeleton
images of the MTA, the STA, and the ITA.
(d) Rotating the Hough spaces by 180
◦
, if the MTA
opens to the left, and obtaining the parameters
of the best-fitting parabolas.
Please refer to (Oloumi et al., 2012c) for details of
the modeling methods, as well as the results of eval-
uation of the obtained parabolic models as compared
to hand-drawn traces of the MTA.
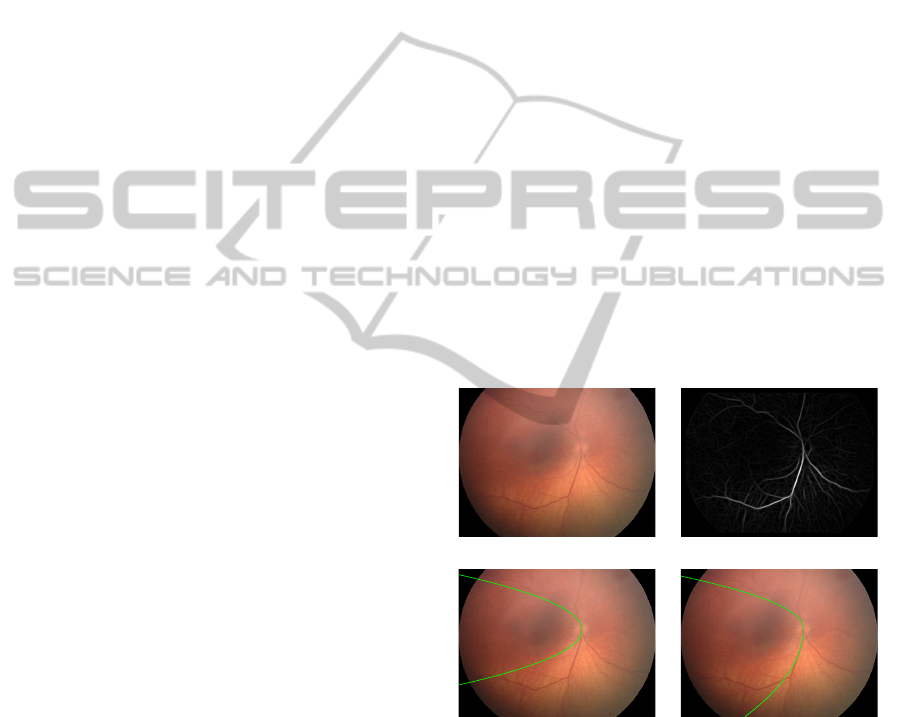
Figure 1 shows the results of detection of the MTA
using Gabor filters, as well as the results of single-
and dual-parabolic modeling of the MTA, STA, and
ITA using the GHT.
(a) (b)
50
100
150
200
250
300
350
400
450
(c)
50
100
150
200
250
300
350
400
450
(d)
Figure 1: (a) Image 1701 of the TROPIC database. (b) Re-
sults of Gabor filtering with a bank of 90 filters spaced
evenly over the range [−π/2,π/2]. (c) Single-parabolic
model with a
MTA
= −20. (d) Dual-parabolic model with
a
STA
= −18 and a
ITA
= −108.
5.1.3 A Graphical User Interface
By providing user guidance over the variables used in
the detection and modeling procedures, it may be pos-
sible to reduce the modeling error and improve the ac-
curacy of the related measures (Oloumi et al., 2012b).
A GUI is being developed and tested in consultation
Computer-aidedDiagnosisofRetinopathyofPrematurityviaAnalysisoftheVascularArchitectureinRetinalFundus
ImagesofPretermInfants
61

with a pediatric ophthalmologist and retinal specialist
(Dr. A. L. Ells), and adheres to the main principles
of GUI development, such as human factors, knowl-
edge of the user’s requirements and expectations, ease
of use, intuitiveness, error handling capabilities, and
proper documentation (Oloumi et al., 2012b; Oloumi
et al., 2012a). The GUI contains a separate mod-
ule for the three main steps of detection, binarization,
and modeling of the MTA. The GUI also contains a
module for measurement of the angle of insertion of
the MTA, using the methods of Wilson et al. (Wilson
et al., 2006) and Wong et al. (Wong et al., 2011).
5.1.4 Selection of Cases from the TROPIC
Database
The TROPIC database contains images of 44 patients,
with the possibility of multiple visits for each patient.
The database contains images of both eyes of each pa-
tient. The TROPIC database does not contain images
of Stages 4 and 5 ROP. Currently, 110 images (30 im-
ages for each of Stages 0,1, and 2 and 20 images of
Stage 3) have been selected from the database. At
most, two images of the same patient were included
for the same stage of ROP: one image from each eye.
Images of the same eye from the same patient were
included only if the ROP stages were different at the
time of imaging. A total of 20 cases were also diag-
nosed with plus disease, which were categorized as
Stages 2 and 3 of ROP. See (Oloumi et al., 2012d) for
more information on the TROPIC database.
5.2 Future Work
5.2.1 Automated Detection of the Blood Vessels
The parameters of the previously developed meth-
ods for the detection of blood vessels have been opti-
mized for use with the DRIVE database, which con-
tains retinal fundus images of adults. The images of
the TROPIC database are taken from preterm infants
and have different characteristics in terms of spatial
resolution, angle of field of view (FOV), thickness of
the blood vessels, presence of choroidal vessels, and
retinal pigmentation. It is necessary to optimize the
parameters of the blood vessel detection methods for
use with the TROPIC database.
The parameters used for thresholding of the
grayscale images, needed for generation of the mask,
will need to be optimized for the TROPIC database.
A fixed thresholding value may be determined empir-
ically; however, such a value may not work well for
the images of the TROPIC database, because the im-
ages of preterm infants vary widely in terms of inten-
sity and pigmentation. The average of pixel intensity
values for a set of pixels at the center of the FOV and
a set of border pixels (outside of the FOV) may be
calculated for each image and a threshold level may
be determined based on the two obtained averages.
Gabor filters are sensitive to oriented features, and
since the boundary of the ONH (optic cup) repre-
sents an oval shape, which provides contrast (edges)
between the darker retinal surface and the brighter
area inside the ONH, it is also detected as a pattern
with oriented components. This fact is the cause for
the largest number of false-positive pixels in the re-
sults of single-scale and multiscale analysis, as well
as the binarization step. Methods that consider the
approximate location of the center of the ONH and
the oval boundary of optic disk, and use the Gabor
angle output to track the vessels that originate from
the ONH, will be employed to reduce the number of
false-positive pixels around the ONH.
5.2.2 Automated Detection of the ONH
The method of Rangayyan et al. (Rangayyan et al.,
2010) will be used to analyze the orientation field im-
age (Gabor angle output) using phase portrait analy-
sis (Rao and Jain, 1992) to detect the point of conver-
gence of vessels, which will serve to detect the cen-
ter of the ONH. The results will be evaluated using
the test set and the previously marked centers of the
ONH by obtaining the Euclidean distance between the
two centers of the ONH (manually and automatically
marked).
5.2.3 Automated Modeling of the MTA
In order to detect and emphasize the presence of the
MTA, a large value for the thickness parameter (τ)
of the Gabor filters will be used (determined empir-
ically). The resulting Gabor magnitude output will
be thresholded at a specific value to obtain a binary
image that contains mainly the MTA. A fixed value
for the threshold level may be determined empirically
for all images, or an automated thresholding method,
such as Otsu’s method (Otsu, 1979), may be used for
this purpose. Small segments still remaining after the
binarization step will be removed using the morpho-
logical operation of area open. The resulting binary
image will be reduced to one-pixel-thick lines using
the morphological process of skeletonization (Arcelli
and di Baja, 1996). The skeleton image will then be
used with the GHT for the detection of parabolas and
semiparabolas (Oloumi et al., 2012c) to model the
MTA, STA, and ITA.
VISIGRAPP2014-DoctoralConsortium
62

5.2.4 Measurement of Vessel Thickness
The single-scale Gabor magnitude output image or a
discriminant image obtained using multiscale analysis
will be thresholded to obtain a binary image, which
should contain most of the blood vessels. The skele-
ton image of the binarized vessels will then be ob-
tained. Next, the branching and end-points of the
skeleton will be determined using morphological op-
erations. By using the branching points and the end-
points, the skeleton will be broken down into seg-
ments. For each segment, a sliding window will be
defined and centered on each pixel on the skeleton
in an iterative manner. A straight line will then be
fitted to the portion of the line segment in the slid-
ing window and then the normal to the fitted line will
be determined. The corresponding skeleton pixel at
the center of the window will be identified in the bi-
nary image of the vessels. Moving in both directions
from the center-line pixel along the normal, pixels
that belong to the vessels (white pixels) will be re-
moved from the binary image (not the skeleton) until
the boundary of the vessel is reached. The count of
the number of pixels on the normal within the vessel
boundary will be used with the spatial resolution of
the images to calculate a thickness measure for that
specific pixel. The process will be repeated for every
pixel on the skeleton to obtain an overall measure of
thickness. Preprocessing steps such as pruning and
cleaning will be needed in order to decrease the effect
of false-positive pixels on the thickness measure.
It should be noted that the thresholding level used
to binarize the grayscale image could have an effect
on the measured thickness of the vessels; however, as
long as the thresholding level is consistent over the
images of all stages, the relative changes in the thick-
ness measure should remain the same for all images.
A valid thresholding level may be determined by an-
alyzing the histogram of the Gabor magnitude output
or the discriminant image values (grayscale intensity)
of the pixels that belong to the skeleton. Such a his-
togram will determine the range of intensity values
of the pixels that belong to the center of each vessel;
a suitable threshold value may be determined based
on this range of values. Another method for the de-
termination of a suitable thresholding value will be
based on the ROC curve obtained for the grayscale
image (single or multiscale result) versus the ground-
truth image. The point on the ROC curve which is
the closest to the point (0,1) will provide the optimal
threshold level.
5.2.5 Measurement of Vessel Tortuosity
Most of the methods in the literature that are used for
the measurement of vessel tortuosity, as explained in
Section 4.2, divide the detected vasculature into sev-
eral segments, and for each segment, define the tortu-
osity as a measure that relates the total length of the
line segment to the chord of the segment (a straight
line connecting the tip of the segment to its tail).
Such methods require the detection or derivation of
edge information with regard to the blood vessels. In
the present work, the Gabor filters used for the de-
tection of the blood vessels provide a phase (angle)
image, which indicates the dominant orientation for
each pixel in the image. The Gabor phase angle in-
formation will be analyzed using a sliding window
to determine the relationship between each pixel and
its neighboring pixels; information such as the rate of
change of the angle will be used to derive a tortuosity
measure.
Assuming that a tortuous vessel, as compared to a
straight vessel, has a higher complexity from the per-
spective of fractal analysis, the box-counting method
for measurement of the fractal dimension (FD) (Peit-
gen et al., 2004) is expected show an increase in the
FD of a case with plus disease (tortuous vessels), as
compared to a case without plus disease (straight ves-
sels). Such a measure may not directly quantify the
level of tortuosity; however, the distinction between
the FD of normal cases as compared to abnormal ones
could be sufficient to discriminate between cases with
and without plus disease.
5.2.6 Quantification of the MTA
The dual-parabolic modeling approach can be biased
if the ITA or the STA have nonlinear rates of diver-
gence. A parabola has a linear divergence rate con-
trolled by the parameter a. The approximate shape of
the overall architecture of the MTA may appear to be
parabolic or semielliptical; however, upon close in-
spection, it is clear that the STA and the ITA are often
asymmetric. More accurate modeling of each arcade
may be possible by applying higher-order models. A
high-ordercurve-fitting method may provide more ac-
curate results in terms of modeling and parametriza-
tion of the STA and ITA. A high-order curve-fitting
method such as the least-squares method (Kay, 1993)
will be used to fit a second-order or higher-order
model to the MTA, STA, and ITA.
Another possible method for quantification of the
openness of the MTA is by obtaining the principal
axis (Rangayyan, 2005) of the skeleton of the MTA
and then obtaining various moments with respect to
the Gabor angle information of the skeleton pixels and
value of the principal axis.
Computer-aidedDiagnosisofRetinopathyofPrematurityviaAnalysisoftheVascularArchitectureinRetinalFundus
ImagesofPretermInfants
63

5.2.7 Pattern Classification
The results of the modeling of the MTA as well as the
thickness and tortuosity measures will be combined
using linear and nonlinear pattern classification meth-
ods, such as quadratic discriminant analysis, multi-
layer neural networks, radial basis functions, and sup-
port vector machines (Duda et al., 2001), to obtain a
single set of discriminatory values for the purpose of
discrimination between various stages of ROP, includ-
ing screening for ROP (no ROP versus ROP), staging
of ROP, and diagnosis of plus disease. A training set
of images will be used to train the classifiers, which
will then be tested using an independent test set of
images.
5.2.8 Testing and Diagnostic Evaluation
ROC analysis provides a measure of the decision
performance of a feature by introducing two in-
dices (Metz, 1978): sensitivity and specificity. The
diagnostic accuracy of all the methods and features
described and obtained in the proposed thesis work
will be determined based on ROC analysis and the
related A
z
values. This includes determining the ac-
curacy of the blood vessel detection algorithm, the
discriminatory capabilities of the derived measures of
thickness, tortuosity, and the parameters of the mod-
els of the MTA, STA, and ITA, as well as the discrim-
inatory values obtained from the pattern classification
techniques, as explained in Section 5.2.7.
Considering the fact that the sample size of the
database of the selected images is relatively small, the
method of leave-one-out will be used to train and test
the classifiers. A bootstrap method will be used to es-
tablish the reliability of the obtained A
z
values based
on changes in the configuration and training protocols
of the classifiers, as well as to determine the presence
of possible inconsistent data (Efron and Tibshirani,
1994; ?). The confidence and prediction intervals ob-
tained using the bootstrap method could be used to
optimize the configuration of the classifiers.
In order to determine the significance of the differ-
ences between the values of the obtained features (i.e.,
thickness measure, tortuosity measure, and openness
parameter), as well as the differences between the val-
ues obtained for various stages of ROP for each fea-
ture (i.e., ROP versus no ROP and Stages 0+ 1 versus
Stages 2+ 3), the p-value will be obtained via the t-
test (Goodman, 1999).
6 PRELIMINARY RESULTS
Using the implemented GUI (see Section 5.1.3), the
parabolic and dual-parabolic models of the MTA,
STA, and ITA, as well as the arcade angle measures
according to the method of Wong et al. (Wong et al.,
2011) were obtained for a small set of images se-
lected from the TROPIC database. The results indi-
cate an area under the ROC curve of A
z
= 0.75 using
the results of single- and dual-parabolic modeling in
the discrimination of Stage 0 ROP from Stage 3 ROP;
A
z
= 0.71 was obtained in screening for ROP (Stage
0 versus Stages 1,2, and 3). The arcade angle pro-
vided similar results (A
z
= 0.74). The p-values for
the screening purpose indicate a statistically signif-
icant difference between the values of the parabolic
models, as well as the arcade angles, for Stage 0 ver-
sus Stages 1, 2, and 3, and Stage 0 versus Stages 2 and
3. See (Oloumi et al., 2012d) for details of the ob-
tained results in terms of A
z
and p-values. This anal-
ysis will be completed by using all available cases in
the TROPIC database as part of the proposed thesis
work.
The changes that affect the architecture of the
MTA in the presence of ROP also appear as side ef-
fects of proliferative diabetic retinopathy (PDR). Us-
ing 22 images from the STructured Analysis of the
REtina (STARE) database, where 11 of the images
were diagnosed with PDR, the results obtained using
the openness parameters of single- and dual-parabolic
models as well as the arcade angle measurements in-
dicate areas under the ROC curves of A
z
= 0.94, 0.87,
and 0.84, respectively. See (Oloumi et al., 2013)
for details of the obtained results in terms of A
z
and
p-values. Although the results are encouraging, a
larger number of cases of PDR are needed for further
analysis; however, the number of publicly available
databases of retinal images that provide diagnostic in-
formation is limited.
7 EXPECTED OUTCOME
As described in Section 4.2, it has been shown that
the changes in vessel thickness and tortuosity in the
presence of plus disease can be detected and used by
CAD systems for the diagnosis of plus disease and
hence, active ROP. It is expected that the proposed
novel methods for the quantification of features of the
MTA and retinal vasculature (see Sections 5.2.4 and
5.2.5) will provide better results. By combining the
results of quantification of the openness of the MTA
with the thickness and tortuosity measures using pat-
tern classification methods, we expect to obtain better
VISIGRAPP2014-DoctoralConsortium
64

results in the diagnosis of ROP and plus disease.
REFERENCES
Arcelli, C. and di Baja, G. S. (1996). Skeletons of pla-
nar patterns. In TY, K. and A, R., editors, Topo-
logical Algorithms for Digital Image Processing, vol-
ume 19 of Machine Intelligence and Pattern Recogni-
tion, pages 99–143. North-Holland, Amsterdam, The
Netherlands.
Chiang, M. F., Jiang, L., Gelman, R., Du, Y. E., and Flynn,
J. T. (2007). Interexpert agreement of plus disease
diagnosis in retinopathy of prematurity. Archives of
Ophthalmology, 125(7):875–880.
Cryotherapy for Retinopathy of Prematurity Cooperative
Group (2001). Multicenter trial of cryotherapy for
retinopathy of prematurity: Ophthalmological out-
comes at 10 years. Archives of Ophthalmology,
119:1110–1118.
Duda, R. O., Hart, P. E., and Stork, D. G. (2001). Pattern
Classification. Wiley, New York, NY, 2nd edition.
Efron, B. and Tibshirani, R. J. (1994). An Introduction to
the Bootstrap - Monographs on Statistics & Applied
Probability. Chapman and Hall/CRC, 1 edition.
Ells, A. L. and MacKeen, L. D. (2008). Dynamic documen-
tation of the evolution of retinopathy of prematurity
in video format. Journal of American Association for
Pediatric Ophthalmology and Strabismus, 12(4):349–
351.
Fiorin, D. and Ruggeri, A. (2011). Computerized analysis
of narrow-field ROP images for the assessment of ves-
sel caliber and tortuosity. In Engineering in Medicine
and Biology Society, 33rd Annual International Con-
ference of the IEEE, pages 2622–2625, Boston, MA.
Fleming, A. D., Goatman, K. A., Philip, S., Olson, J. A.,
and Sharp, P. (2007). Automatic detection of reti-
nal anatomy to assist diabetic retinopathy screening.
Physics in Medicine and Biology, 52:331–345.
Foracchia, M., Grisan, E., and Ruggeri, A. (2004). Detec-
tion of optic disc in retinal images by means of a geo-
metrical model of vessel structure. IEEE Transactions
on Medical Imaging, 23(10):1189–1195.
Gelman, R., Martinez-Perez, M. E., Vanderveen, D. K.,
Moskowitz, A., and Fulton, A. B. (2005). Diagno-
sis of plus disease in retinopathy of prematurity using
retinal image multiscale analysis. Investigative Oph-
thalmology & Visual Science, 46(12):4734–4738.
Goodman, S. N. (1999). Toward evidence-based medical
statistics. 1: The p value fallacy. Annals of Internal
Medicine, 130(12):995–1004.
Heneghan, C., Flynn, J. T., O’Keefe, M., and Cahill, M.
(2002). Characterization of changes in blood ves-
sels width and tortuosity in retinopathy of prematu-
rity using image analysis. Medical Image Analysis,
6(1):407–429.
Hildebrand, P. L., Ells, A. L., and Ingram, A. D. (2009). The
impact of telemedicine integration on resource use in
the evaluation ROP ... analysis of the telemedicine for
ROP in Calgary (TROPIC) database. Investigative
Ophthalmology and Visual Sciences, 50:E–Abstract
3151.
International Committee for the Classification of Retinopa-
thy of Prematurity (2005). The international clas-
sification of retinopathy of prematurity revisited.
Archives of Ophthalmology, 123:991–999.
Kay, S. M. (1993). Least squares. In Fundamentals of Sta-
tistical Signal Processing, Volume I: Estimation The-
ory, pages 219–286. Prentice Hall PTR.
Li, H. and Chutatape, O. (2004). Automated feature ex-
traction in color retinal images by a model based ap-
proach. IEEE Transactions on Biomedical Engineer-
ing, 51(2):246–254.
Liu, K. Y., Smith, M. R., Fear, E. C., and Rangayyan, R. M.
(2012). Evaluation and amelioration of computer-
aided diagnosis with artificial neural networks utiliz-
ing small-sized sample sets. Biomedical Signal Pro-
cessing and Control, Online:8. In press.
Metz, C. E. (1978). Basic principles of ROC analysis. Sem-
inars in Nuclear Medicine, VIII(4):283–298.
Oloumi, F., Rangayyan, R. M., and Ells, A. L. (2012a). A
graphical user interface for measurement of temporal
arcade angles in fundus images of the retina. In Cana-
dian Conference on Electrical and Computer Engi-
neering (CCECE), Proc. IEEE Canada 25th Annual,
pages 4 on CD–ROM, Montreal, QC, Canada.
Oloumi, F., Rangayyan, R. M., and Ells, A. L. (2012b). A
graphical user interface for measurement of the open-
ness of the retinal temporal arcade. In Medical Mea-
surements and Applications (MeMeA), Proc. IEEE In-
ternational Symposium on, pages 238–241, Budapest,
Hungary.
Oloumi, F., Rangayyan, R. M., and Ells, A. L. (2012c).
Parabolic modeling of the major temporal arcade in
retinal fundus images. IEEE Transactions on In-
strumentation and Measurement (TIM), 61(7):1825–
1838.
Oloumi, F., Rangayyan, R. M., and Ells, A. L. (2012d).
Quantitative analysis of the openness of the major
temporal arcade in retinal fundus images of retinopa-
thy of prematurity. In The First International Confer-
ence on Emerging Research in Electronics, Computer
Science and Technology, Leture Notes in Electrical
Engineering, pages 829–842, Mandya, Karnataka, In-
dia. Springer, LNEE.
Oloumi, F., Rangayyan, R. M., and Ells, A. L. (2013).
Quantitative analysis of the major temporal arcade in
retinal fundus images of preterm infants for detection
of plus disease. In The 15th International Association
of Science and Technology for Development (IASTED)
Conference on Signal and Image Processing, Banff,
Alberta, Canada.
Otsu, N. (1979). A threshold selection method from gray-
level histograms. IEEE Transactions on Systems, Man
and Cybernetics, SMC-9:62–66.
Peitgen, H. O., Jurgens, H., and Saupe, D. (2004). Chaos
and Fractals: New Frontiers of Science. Springer-
Verlag, New York, NY.
Poletti, E., Grisan, E., and Ruggeri, A. (2012). Image-
level tortuosity estimation in wide-field retinal images
from infants with retinopathy of prematurity. In Engi-
neering in Medicine and Biology Society, 34th Annual
Computer-aidedDiagnosisofRetinopathyofPrematurityviaAnalysisoftheVascularArchitectureinRetinalFundus
ImagesofPretermInfants
65

International Conference of the IEEE, pages 4958–
4961, San Diego, CA.
Rangayyan, R. M. (2005). Biomedical Image Analysis.
CRC, Boca Raton, FL.
Rangayyan, R. M., Ayres, F. J., Oloumi, F., Oloumi, F., and
Eshghzadeh-Zanjani, P. (April-June 2008). Detection
of blood vessels in the retina with multiscale Gabor
filters. Journal of Electronic Imaging, 17:023018:1–
7.
Rangayyan, R. M., Zhu, X., Ayres, F. J., and Ells, A. L.
(2010). Detection of the optic nerve head in fundus
images of the retina with Gabor filters and phase por-
trait analysis. Journal of Digital Imaging, 23(4):438–
453.
Rao, A. R. and Jain, R. C. (1992). Computerized flow
field analysis: Oriented texture fields. IEEE Trans-
actions on Pattern Analysis and Machine Intelligence,
14(7):693–709.
Staal, J., Abr`amoff, M. D., Niemeijer, M., Viergever, M. A.,
and van Ginneken, B. (2004). Ridge-based vessel seg-
mentation in color images of the retina. IEEE Trans-
actions on Medical Imaging, 23(4):501–509.
Tobin, K. W., Chaum, E., Govindasamy, V., and Karnowski,
T. P. (2007). Detection of anatomic structures in hu-
man retinal imagery. IEEE Transactions on Medical
Imaging, 26(12):1729–1739.
Wallace, D. K., Quinn, G. E., Freedman, S. F., and Chiang,
M. F. (2008). Agreement among pediatric ophthal-
mologists in diagnosing plus and pre-plus disease in
retinopathy of prematurity. Journal of American Asso-
ciation for Pediatric Ophthalmology and Strabismus,
12(4):352–356.
Watzke, R. C., Robertson, J. E., Palmer, E. A., Wallace,
P. R., Evans, M. S., and Soldevilla, J. E. D. (1990).
Photographic grading in the retinopathy of prematu-
rity cryotherapy trial. Archives of Ophthalmology,
108(7):950–955.
Welfer, D., Scharcanski, J., Kitamura, C. M., Pizzol, M.
M. D., Ludwig, L. W. B., and Marinho, D. R. (2010).
Segmentation of the optic disk in color eye fundus im-
ages using an adaptive morphological approach. Com-
puters in Biology and Medicine, 40(2):124–137.
Wilson, C. M., Cocker, K. D., Moseley, M. J., Paterson, C.,
Clay, S. T., Schulenburg, W. E., Mills, M. D., Ells,
A. L., Parker, K. H., Quinn, G. E., Fielder, A. R., and
Ng, J. (2008). Computerized analysis of retinal vessel
width and tortuosity in premature infants. Investiga-
tive Ophthalmology and Visual Science, 49(1):3577–
3585.
Wilson, C. M., Theodorou, M., Cocker, K. D., and Fielder,
A. R. (2006). The temporal retinal vessel angle and in-
fants born preterm. British Journal of Ophthalmology,
90:702–704.
Wong, K., andA. L. Ells, J. N., Fielder, A. R., and Wilson,
C. M. (2011). The temporal and nasal retinal arteriolar
and venular angles in preterm infants. British Journal
of Ophthalmology, 95(12):1723–1727.
Ying, H. and Liu, J. C. (2010). Automated localization of
macula-fovea area on retina images using blood ves-
sel network topology. In Acoustics Speech and Signal
Processing, IEEE International Conference on, pages
650–653.
VISIGRAPP2014-DoctoralConsortium
66
