
Machine Learning Techniques for Topic Spotting
Nadia Shakir
1
, Erum Iftikhar
2
and Imran Sarwar Bajwa
2
1
Department of Computer Science, Quaid-i-Azam University, Islamabad, Pakistan
2
Department of Computer Science & IT, The Islamia University of Bahawalpur, Bahawalpur, Pakistan
Keywords: Machine Learning, Topic Spotting, Decision Tree, Neural Networks, K-Nearest Neighbours, Naive Bayes.
Abstract: Automatically choosing topics for text documents that describe the document contents, is a useful technique
for text categorization. For example queries sent on the web can use this technique to identify the query
topic and accordingly forward query to small group of people. Similarly online blogs can be categorized
according to the topics they are related to. In this paper we applied machine learning techniques to the
problem of topic spotting. We used supervised learning techniques which are highly dependent on training
data and the particular training algorithm used. Our approach differs from automatic text clustering which
uses unsupervised learning for clustering the text. Secondly the topics are known in advance and come from
an exhaustive list of words. The machine learning techniques we applied are 1) neural network., 2) Naïve
Bayes Classifier, 3) Instance based learning using k-nearest neighbours and 4) Decision Tree method. We
used Reuters-21578 text categorization dataset for our experiments.
1 INTRODUCTION
Given a text document, can it be classified as being
related to one or more given topics? Automatic topic
assignment to text documents or, topic spotting, has
applications in information retrieval systems and
enterprise portals (Hotho et al., 2003; Wiener et al.,
1995). Two approaches namely supervised learning
and unsupervised learning can be applied to problem
of topic spotting (Hotho et al., 2003). Machine
learning techniques can be based on supervised or
unsupervised learning. However, these types of
learning vary only in used structure of the model. A
model implies the effect of one set of observations,
(such as inputs) on another set of observations, (such
as outputs) in the supervised learning approach. As
a result, chain starts with the inputs and end at the
outputs by introducing arbitrating variables amid the
inputs and outputs.
In this paper, four supervised learning techniques
are applied to address the problem of topic spotting.
These techniques are artificial neural networks,
naïve Bayes classifier, instance based learning using
k-nearest neighbour technique and decision tree. We
used a simplified version of Reuters-21578 data set
to empirically evaluate these techniques. High
information gain words have already been extracted
and are used as attributes for each topic class out of
10 topic classes in simplified Reuters-21578 data set.
We merged documents in all the classes into a single
file and then divided the data set into four equal
parts after arranging the text documents randomly.
We applied k-fold cross validation technique for all
the four approaches described above.
The researchers started addressing problem of
automatic text categorization from 1961 (Huang et
al., 2009). Documents in the text classification
problem are normally represented by vector of
numeric values extracted from the document (Hotho
et al., 2003). A. Genkin et. al. (Genkin et al., 2007)
uses Baysian logistic regression approach for the
problem of text categorization whose results are
comparable with that of support vector machine
technique. Most of the text clustering algorithms are
based on vector space model (Huang et al., 2008).
Some researchers use the term bag of words (BOW)
for vector space model (Hotho et al., 2003). BOW or
vector space model suffers from the difficulty that it
considers only term frequencies and ignores
semantic relationships between the terms (Huang et
al., 2008; Wiener et al., 1995).
Dimensionality reduction is also important for
the problem of document classification because high
dimensional documents require more computations
as compared to low dimensional documents (Huang
et al., 2008). Document dimensionality normally
450
Shakir N., Iftikhar E. and Bajwa I..
Machine Learning Techniques for Topic Spotting.
DOI: 10.5220/0004881604500455
In Proceedings of the 16th International Conference on Enterprise Information Systems (ICEIS-2014), pages 450-455
ISBN: 978-989-758-027-7
Copyright
c
2014 SCITEPRESS (Science and Technology Publications, Lda.)
ranges from 10
3
to 10
6
(Huang et al., 2008). E.
Wiener et. al. (Wiener et al., 1995) used neural
network approach for topic spotting. They used
latent semantic indexing to reduce dimensionality in
the documents. We used a data set in which
dimension of the documents have already been
reduced by extracting most information gain words
for each topic.
Among the four techniques we used, neural
network approach is computationally high when
training is performed. Whereas instance based
learning technique using k-nearest neighbour
technique is computationally high when an instance
document needs to be classified. K-nearest
neighbour technique computes distance of the
instance to be classified from every document in the
training examples.
The rest of the paper is organized as follows.
Section II describes the data set, data set pre-
processing and validation techniques. In section III
to section VI, we present results for neural networks
approach, naïve Bayes classifier approach, instance
based learning using k-nearest neighbour approach
and decision tree approach respectively. The
comparison of all the four approaches is presented in
section VII and finally in section VIII conclusion
and a discussion of future work are presented.
2 DATASET
We used a simplified version of Reuters-21578
(Reuters-215 data) data set for our experiments. The
actual data set consists of 21578 text documents.
These documents are contained in 22 SGML files.
Each of the first 21 files (reut2-000.sgm through
reut2-020.sgm) contains 1000 documents and the
last file (reut2-021.sgm) contains 578 documents,
summing to total of 21578 documents. In addition
the, the data set contains an SGML DTD file which
describes the data and six other files used to index
the data. The list of topics consists of 135 topics.
The simplified version of Reuters-21578 data set
consists of 7769 training documents and 3018 test
documents. Only 10 topics out of 135 topics
containing the most documents are retained in this
data. For each topic 500 words with highest
information gain are extracted and are used as
attributes to describe documents.
Both training and testing data consists of 10 files,
one for each topic, and each training file and testing
file consists of 7769 and 3018 documents
respectively. The 500 words with most information
gain are used as attributes. Each document is
specified as a vector of 501 bits where last bit
represents whether the document belongs to the
given topic or not according as last bit is 1 or 0.
Each bit represents presence and absence of the
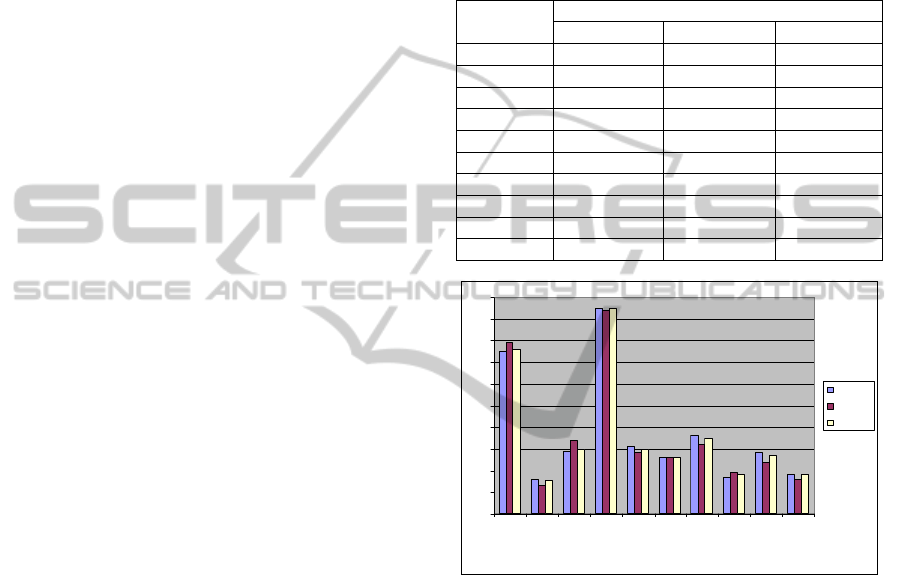
corresponding attribute in the document. Table 1
shows the entropy in the data with respect to each of
the 10 topics. Fig. 1 shows entropies graphically.
Table 1: Entropy in each class.
Topic
Entropy
Training Testing Overall
acq 0.75 0.79 0.76
corn 0.16 0.13 0.15
crude 0.29 0.34 0.30
earn 0.95 0.94 0.95
grain 0.31 0.28 0.30
interest 0.26 0.26 0.26
money-fx 0.36 0.32 0.35
ship 0.17 0.19 0.18
trade 0.28 0.24 0.27
wheat 0.18 0.16 0.18
Figure 1: Entropy in each class.
A. Data Pre-processing and Validation Method
The attributes for each class are the most
information gain words occurring in the document.
These attributes, though overlap, but are not
necessarily the same across all the topic classes. To
create a single batch file for all the training and
testing data to apply k-fold validation, we got union
of the attributes of all the 10 classes. The total
number of attributes became 2682 after removing
repeated attributes. The first 2672 are the actual
words and last 10 attributes denote the class. All the
attributes are Boolean valued. 0 and 1 means
presence and absence of the corresponding attribute
in the document respectively. Similarly 0 and 1 for
target attribute denotes whether the document
belongs to the corresponding class or not
respectively. We read each document from each of
0
0.1
0.2
0.3
0.4
0.5
0.6
0.7
0.8
0.9
1
acq
c
o
r
n
cru
de
e
a
r
n
gr
ain
i
nt
erest
money-fx
s
h
ip
tr
ad
e
w
h
e
at
Traing
Tes t ing
Overall
MachineLearningTechniquesforTopicSpotting
451

the 10 files and merge these 10 vector
representations of a single document into single
vector of 2682 bits compliant with the new 2682
attributes. We removed last 7 files from the batch
file and the final data contained in a single file
consists of 10780 documents.
For instance based k-neighbour method, neural
network and naïve Bayes, we used the same data set
of 10780 documents. For decision tree method, we
extracted 1000 documents from the batch data which
have most positive target values.
For the four approaches described above we used
4-fold cross validation technique to measure the
performance of each approach. First we arranged the
10780 examples randomly and divided into four
parts with each part consisting of 25% (=2695)
examples. For k
th
fold (k=1, 2, 3, 4), we used k
th
2695 examples as test examples and remaining 8085
examples as training examples. For each fold we
calculated percentage of correct, false positive and
false negative predictions. We predicted true error
rate for each technique by calculating two sided 95%
confidence interval.
3 NEURAL NETWORK
APPROACH
MATLAB 7.0 is used to measure performance of the
neural network. We used 2 layers feed forward back
propagation neural network for topic spotting.
Number of input neurons of the network is the
number of attributes (excluding target attributes) and
number of output neuron is the number of classes in
the data, one neuron for each class. Number of
hidden layer neurons is 16. Gradient descent
algorithm is used to train the network. Performance
measure used in training is sum of squared errors.
Termination condition is the maximum number of
epochs or performance goal whichever is met first.
Transfer functions in each layer are set to log
sigmoid. Parameters of the neural network are
summarized in the Table 2.
Table 3 shows performance statistics of neural
networks for the problem of topic spotting. K
denotes the value of fold. On the average the correct
decisions are 97.54% on testing data and 97.88% on
all data (training + testing). Fig. 2 shows average
predictions on testing data and all data.
Table 2: Neural Network Parameters.
Neural Network Parameters
Neural Network Type
Multi-layer Feed Forward
Back propagation
Number of input
neurons
2672
Number of output
neurons
10
Number of hidden
layers
1
Number of hidden layer
neurons
16
Training Algorithm
Gradient Descent
Performance Measure
Sum of Squared Errors
Max. Number of Epochs
10000
Goal
1500 (SSE)
Goal Achieved
Yes
Goal Achieved After
2000 epochs (average)
B. Confidence Interval for True Error
Neural network has 2.45% error rate on the test data.
The sampling distribution for the error is
approximately normally distributed with mean
and standard deviation
.
0245.0
2695
n
n
)1(
0030.0
Two sided 95% confidence interval based on normal
distribution for true error for neural network
approach is given by.
)0304.0,0186.0(
Or
%)04.3%,86.1(
(1)
With 95% confidence it can be asserted that the
true error rate for neural network approach is
bounded by (1).
Table 3: Neural Network Statistics.
K
Testing Data All Data
Correct F. P. F. N. Correct F. P. F. N.
1
97.92 0.26 1.82 97.83 0.28 1.88
2
98.02 0.28 1.70 97.88 0.32 1.79
3
97.90 0.37 1.72 97.78 0.42 1.78
4
98.13 0.24 1.63 98.02 0.28 1.70
Avg.
97.54 0.44 2.01 97.88 0.32 1.79
S. D.
0.11 0.0.10 0.07 0.10 0.07 0.07
ICEIS2014-16thInternationalConferenceonEnterpriseInformationSystems
452
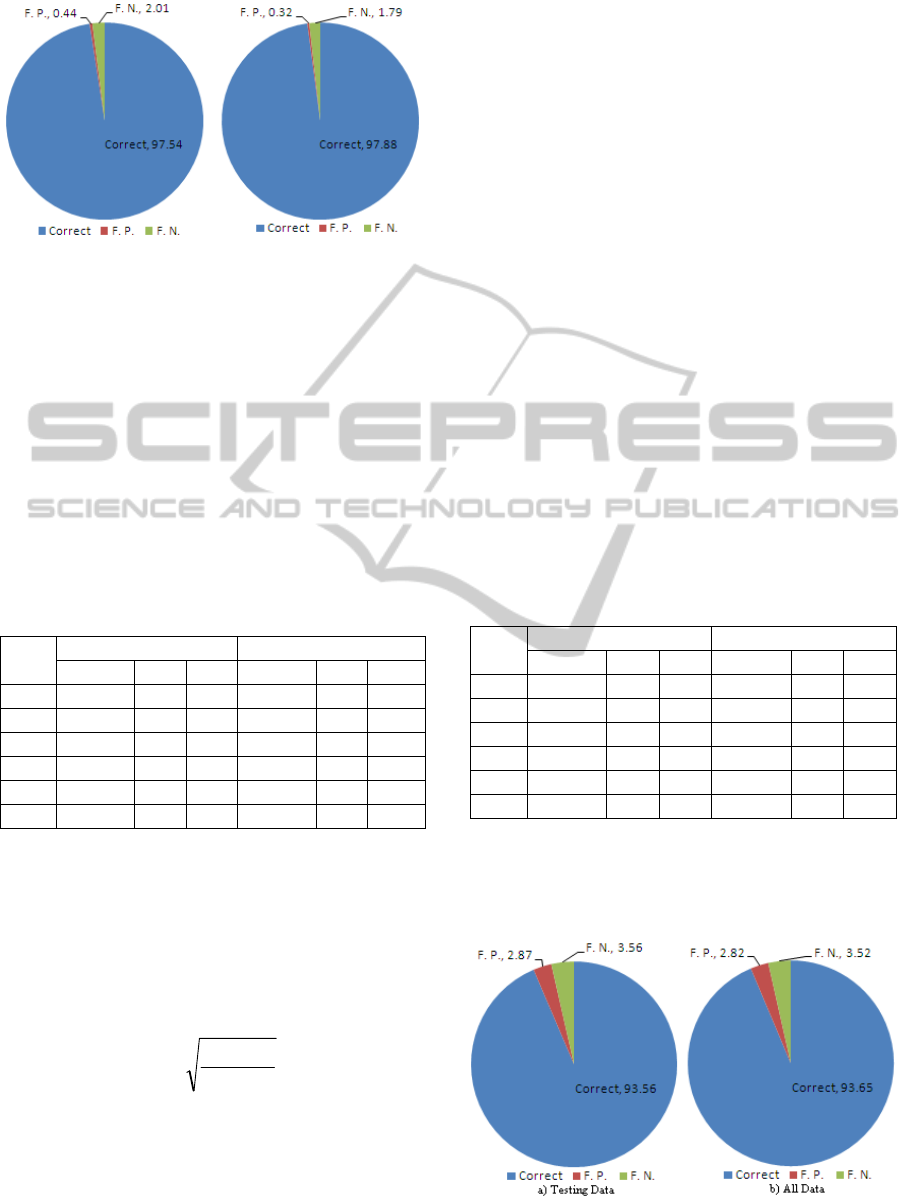
Figure 2: Average predictions for testing data and all data
for neural networks.
4 NAÏVE BAYES CLASSIFIER
We used visual C++ 6.0 to get statistics for naïve
Bayes classifier technique. Table 4 shows
performance statistics. Average correct predictions
on testing data are 93.56% and on all data are
93.65%. These statistics shows that neural network
technique outperforms naïve Bayes classifier
technique. Fig. 3 shows average predictions on
testing data and all data.
Table 4: Naïve Bayes Classifier Statistics.
K
Testing Data All Data
Correct F. P. F. N. Correct F. P. F. N.
1
93.43 3.02 3.54 93.64 2.84 3.52
2
93.29 3.15 3.55 93.64 2.84 3.52
3
93.71 2.66 3.63 93.70 2.80 3.51
4
93.82 2.66 3.53 93.65 2.80 3.53
Avg.
93.56 2.87 3.56 93.65 2.82 3.52
S. D.
0.24 0.25 0.04 0.31 0.02 0.008
C. Confidence Interval for True Error
Naïve Bayes classifier has 6.43% error rate on the
test data. The sampling distribution for the error is
approximately normally distributed with mean
and standard deviation
.
0643.0
2695n
n
)1(
0047.0
Two sided 95% confidence interval based on normal
distribution for true error for naïve Bayes approach
is given by.
)0736.0,0550.0(
Or
%)36.7%,50.5(
(2)
With 95% confidence it can be asserted that the true
error rate for naïve Bayes classifier approach is
bounded by (2).
5 K-NEAREST NEIGHBOUR
TECHNIQUE
We used visual C++ 6.0 to get statistics for naïve
Bayes classifier technique. For each document d to
be classified we calculate its distance from all
documents in training set and get 5 documents with
minimum distance, called 5-nearest neighbours. For
each topic, if majority of the 5-neighbours are
related to the topic, the document d is also decided
to be related to the topic and if majority of the 5-
neighbours is not related to the topic, document d is
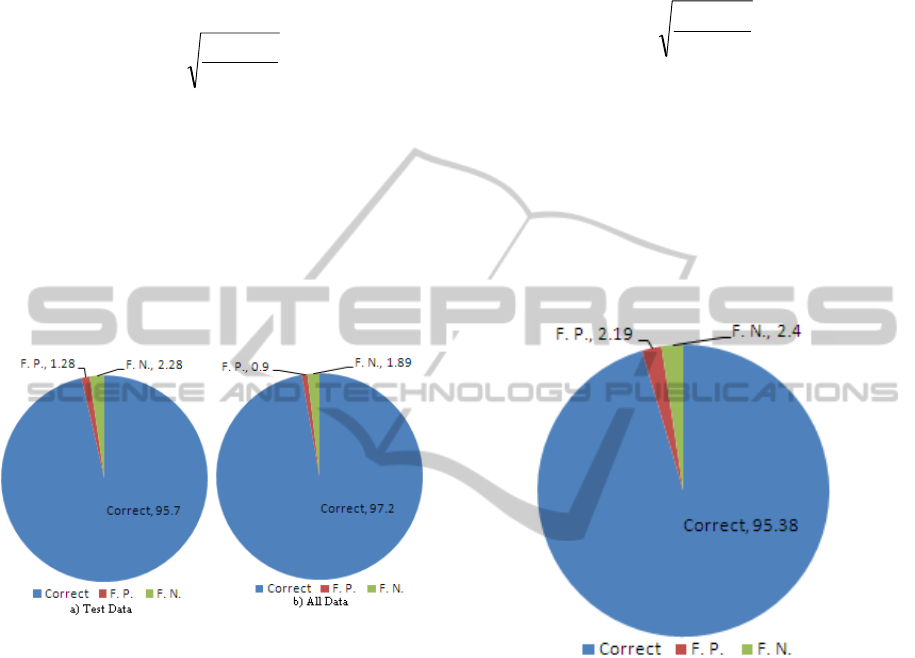
also decided to be unrelated to the topic. Average
correct predictions on testing data are 95.70% and
on all data are 97.20%.K-nearest neighbour
performance lies between naïve Bayes classifier
performance and neural network performance. Fig. 4
shows average predictions on testing data and all
data.
Table 5: K-Nearest Neighbour Technique Statistics.
K
Testing Data All Data
Correct F. P. F. N. Correct F. P. F. N.
1
96.36 1.40 2.25 97.17 1.01 1.81
2
96.46 1.32 2.22 97.23 0.86 1.90
3
96.42 1.21 2.37 97.17 0.87 1.95
4
96.58 1.17 2.27 97.25 0.85 1.89
Avg.
96.45 1.28 2.28 97.20 0.90 1.89
S. D.
1.56 0.10 0.06 0.04 0.75 0.05
D. Confidence Interval for True Error
K-nearest neighbour approach has 3.56% error rate
on the test data.
Figure 3: Average predictions for testing data and all data
for Naïve Bayes Classifier.
MachineLearningTechniquesforTopicSpotting
453
The sampling distribution for the error is
approximately normally distributed with mean
and standard deviation
.
0356.0
2695n
n
)1(
0036.0
Two sided 95% confidence interval based on normal
distribution for true error for k-nearest neighbour
approach is given by.
)0426.0,0286.0(
Or
%)26.4%,86.2(
(3)
With 95% confidence it can be asserted that the true
error rate for k-nearest neighbour approach is
bounded by (3).
Figure 4: Average predictions for testing data and all data
for k-nearest neighbour approach.
6 DECISION TREE APPROACH
We used weka to get statistics for decision tree
technique. We took 1000 examples with most
positive examples from 10780 examples to compute
performance statistics. Using k-fold validation
technique with value of k equal to 4 the average
correct, false positive and false negative predictions
came out to be 95.38%, 2.19% and 2.40%
respectively. These statistics are comparable with
that of k-nearest neighbour approach. Fig. 5 shows
statistics graphically.
A. Confidence Interval for True Error
Decision tree approach has 4.59% error rate on the
test data. The sampling distribution for the error is
approximately normally distributed with mean
and standard deviation
.
0459.0
250
n
n
)1(
0132.0
Two sided 95% confidence interval based on normal
distribution for true error for decision tree approach
is given by.
)0718.0,0200.0(
Or
%)18.7%,00.2(
(4)
With 95% confidence it can be asserted that the true
error rate for decision tree approach is bounded by
(4).
Figure 5: Average predictions for decision tree approach.
7 COMPARISON OF USED
APPROACHES
Upper bounds on the true error with 95% confidence
for all the four approach presented in this paper are
given in Table 6. These bounds show that neural
network outperformed all other techniques. K-
nearest neighbour technique outperformed naïve
Bayes classifier and decision tree approaches.
Decision tree and naïve Bayes classifier approaches’
performance remained very close but the interval
width for decision tree approach is larger than that of
naïve Bayes approach due to smaller sample size for
decision tree approach.
ICEIS2014-16thInternationalConferenceonEnterpriseInformationSystems
454

8 CONCLUSION
With a minor difference, all the four techniques,
neural networks, k-nearest neighbour, decision tree
and naïve Bayes classifier, performed well for the
problem of topic spotting. The highest information
gain words have already been extracted for each
class in the data set. These words with high
information gain also played role in achieving such
performance for the four techniques. One related but
more challenging problem is to predict any unseen
topic for a given document.
In the future, we can apply the four techniques
on the raw data without extracting high information
gain attributes to see how much contribution high
information gain attributes have done to the
performance of the classification problem of topic
spotting.
Table 6: Two Sided 95% CONFIDENCE Upper Bound on
the True Error.
Neural
Network
Naive
Bayes
K-nearest
Neighbour
Decision
Tree
Upper
Bound
3.04% 7.36% 4.26% 7.18%
Interval
Length
1.18% 1.86% 1.40% 5.18%
REFERENCES
A. Huang, E. Frank, and I. H. Witten. “Clustering
document using a Wikipedia-based concept
representation,” In Proc. 13th PAKDD, 2009.
A. Huang, D. Milne, E. Frank. and I.H. Witten.
“Clustering documents with active learning using
Wikipedia,” In Proc. of the 8th IEEE International
Conference on Data Mining (ICDM 2008), Pisa, Italy.
A. Genkin, D. D. Lewis and D. Madigan. “Large-Scale
Bayesian Logistic Regression for Text Categorization,”
American Statistical Association and the American
Society for Quality. TECHNOMETRICS, vol. 49, no.
3, Aug. 2007.
A. Hotho, S. Staab, and G. Stumme. “Explaining text
clustering results using semantic structures,” PKDD,
7th European Conference, Dubrovnik, Croatia,
September 22-26, 2003, LNCS. Springer, 2003.
A. Hotho, S. Staab and G. Stumme. “Wordnet improves
text document clustering,” In Proceedings of the
Semantic Web Workshop at SIGIR’03 .
Jian Hu, Lujun Fang, Yang Cao, Hua-Jun Zeng, Hua Li,
Qiang Yang, Zheng Chen. “Enhancing text clustering
by leveraging Wikipedia semantics,” In Proc. of the
31th Annual International ACM SIGIR Conference on
Research and Development in Information Retrieval
SIGIR-08, 2008.
E. Wiener, J. O. Pedersen and A. S. Weigend (1995) A
neural network approach to topic spotting. In:
Proceedings of the Fourth Annual Symposium on
Document Analysis and Information Retrieval
(SDAIR’95).
T. M. Mitchel. Machine Learning. McGraw-Hill, 1997.
Reuters-215 data. Available: http://www.daviddlewis.com/
resources/testcollections/reuters21578.
Bajwa, I. S., Naeem, M. A., & Riaz-Ul-Amin, M. A. C.
(2006, February). Speech Language Processing
Interface for Object-Oriented Application Design
using a Rule-based Framework. In 4th International
Conference on Computer Applications.
Reuters-21578 text categorization collection (after
preprocessing by Gytis Karciauskas): Available:
http://staff.utia.cas.cz/vomlel/reuters-data.html.
MachineLearningTechniquesforTopicSpotting
455
