
Tunable Fabry-Pérot Filter for Optical Glucose Monitoring
Xin Zhao
1,2
and Schmidt J. Dominik
2
1
College of Physical Science and Technology, Sichuan University, 29 Wangjiang Road, Chengdu, Sichuan, P.R. China,
2
Department of Electrical Engineering, International Technological University,
355W San Fernando St, San Jose, CA, U.S.A.
Keywords: Micro-electro-mechanical Systems, Long-Wave Infrared, Tunable Fabry-Pérot Filter, Glucose Sensor.
Abstract: This paper presents a Tunable MEMS Fabry-Pérot (FP) filter for the application of optical glucose sensor in
Long-Wave Infrared (LWIR) range. The structure design, simulation, fabrication process and testing system
are reported. The spectral wavelength tuning range from 10.9 μm to 12.19 μm was designed for the
transmission peak which is related to the glucose concentration. A tuning distance between top and bottom
reflector of 2.25µm has been achieved, while maintaining a relatively low tuning voltage of 20V. The
Tunable FP filter is the core part of glucose sensor and has other applications in Bio-sensor, hyperspectral
imaging and tunable lasers, etc.
1 INTRODUCTION
Blood Glucose monitoring technologies have been
used in the treatment of diabetes for three decades.
The invasive methods are based on microneedle,
impedance spectroscopy, microdialysis and
subcutaneous sensor, etc. The developing non-
invasive sensors use infrared absorption, optical
coherence tomography, Raman scattering, and
polarimetry as measurement technologies.
Recently, infrared spectroscopy has shown the
potential for an analytical method in non-invasive
glucose sensing based on the optical characteristic of
the glucose concentration. On the other hand, with
the development of micromachining technologies,
Micro-electro-mechanical Systems (MEMS)
emerges as the choice for the fabrication of Infrared
(IR) instrument. Compared with conventional IR
analysis systems, the MEMS IR sensors offer lower
cost, lower power consumption and more portability
due to their small size.
As the key part of optical non-invasive glucose
sensor, the tunable MEMS FP filter was originally
developed by several different groups. Noro’s group
reported the 3-5 μm Mid-wave Infrared (MWIR)
filter for the gas sensing. Stupar’s group presented
the first LWIR tunable filter range from 8 μm to 11
μm. The dual-band FP filter with two reflectors was
reported by Neumann’s group. The spectral ranges
are from 4 μm to 5 μm and from 8 μm to 10.5 μm.
In this paper, a tunable MEMS FP filter for the
LWIR range is presented. The proposed bulk
micromaching technology is used to form the
reflector carriers. The tunable FP filter could be
combined with a detector to test the central
wavelength shift of transmission peak which can
read out the change of glucose concentration in the
human body.
2 DESIGN OF TUNABLE FP
FILTER
2.1 MEMS Design
Figure 1(a) shows the structure of the tunable FP
filter, which consists of two 2.1× 2.1 mm² reflectors,
two 3.6 × 3.6 mm² reflector carriers, and four
springs. The bottom reflector carrier is fixed and the
other suspended by springs. The reflectors are
surrounded by a metal electrode which uses an
electrostatic force between the two reflector carriers
to change the distance between the reflectors as
shown in Fig. 1(b). The L shaped springs are applied
on the structure design to optimize the the flatness
across the central area of the top reflector.
171
Zhao X. and J. Dominik S..
Tunable Fabry-Pérot Filter for Optical Glucose Monitoring.
DOI: 10.5220/0004871101710175
In Proceedings of the International Conference on Biomedical Electronics and Devices (BIODEVICES-2014), pages 171-175
ISBN: 978-989-758-013-0
Copyright
c
2014 SCITEPRESS (Science and Technology Publications, Lda.)
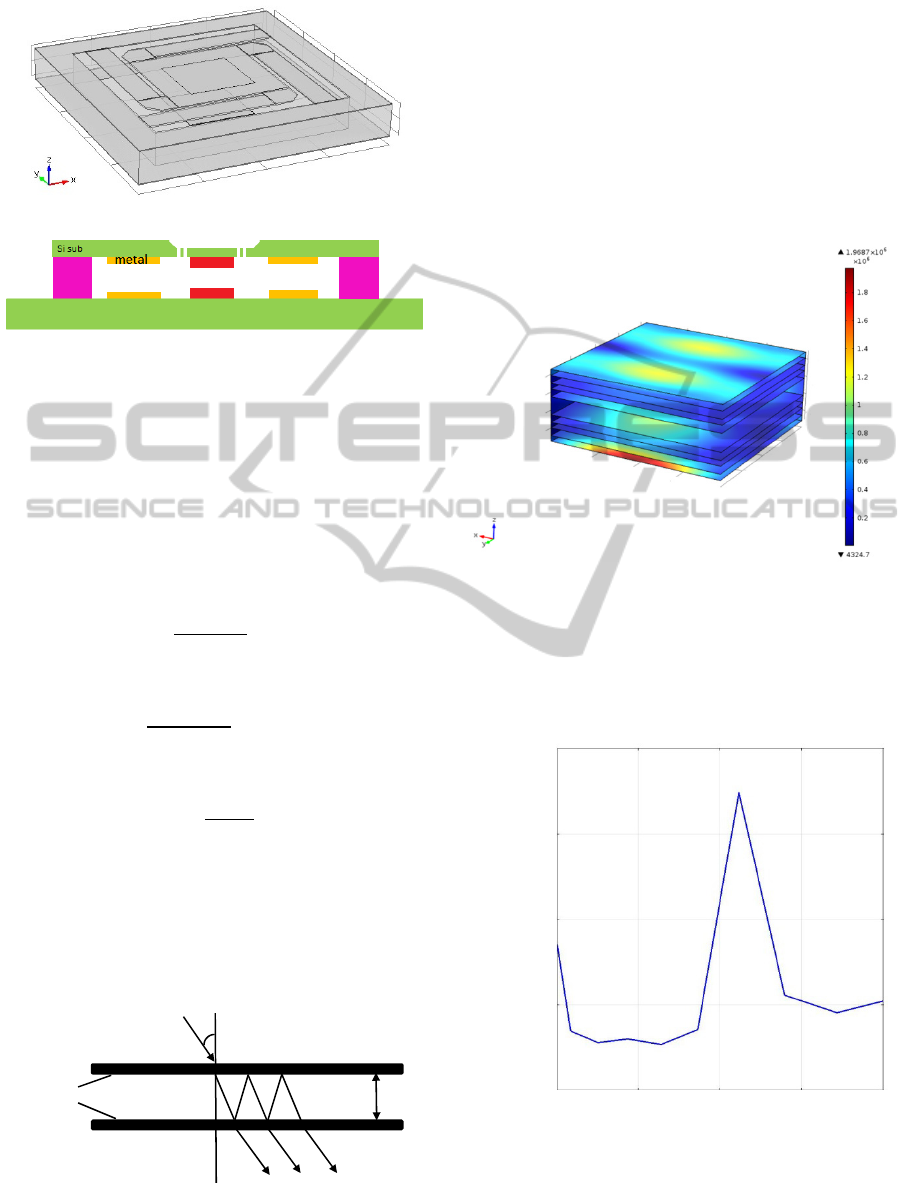
(a)
(b)
Figure 1(a): Schematic of the tunable FP filter, (b) cross-
section of the tunable FP filter.
2.2 Optical System
The electromagnetic waves enter the optical cavity
through the top reflector and are reflected by both
the top and bottom reflector many times. The output
transmittance spectrum T(λ) of the FP filter is
described by the Airy-Function
T
λ
T
1
4R
1R
sin
δ
(1)
with the optical phase
2πndcos
θ
λ
ϕ
(2)
and the peak transmittance
1
1
(3)
Where λ is the wavelength of the electromagnetic, R
is the reflectance, n is the refractive index of the
material between the reflectors, d is the distance
between the top and bottom reflector, θ is the angle
of incidence, ϕ is phase shift on reflection, and A is
the absorption as shown in Fig.2.
Figure 2: Schematic of Fabry-Pérot filter.
The reflectors are distributed Bragg reflector
(DBR) mirrors which contain Ge/Al2O3/Ge layers.
The thickness of the Ge layers and Al
2O3 layer are
850 nm and 629 nm, respectively. The electrical
field distribution of DBR is related to the peak value
of the transmission. The simulation result of the 3D
electrical field distribution of the DBR is shown in
Fig. 3. The optical properties simulation is
performed by software COMSOL by using finite
element methods.
Figure 3: The 3D electrical field distribution.
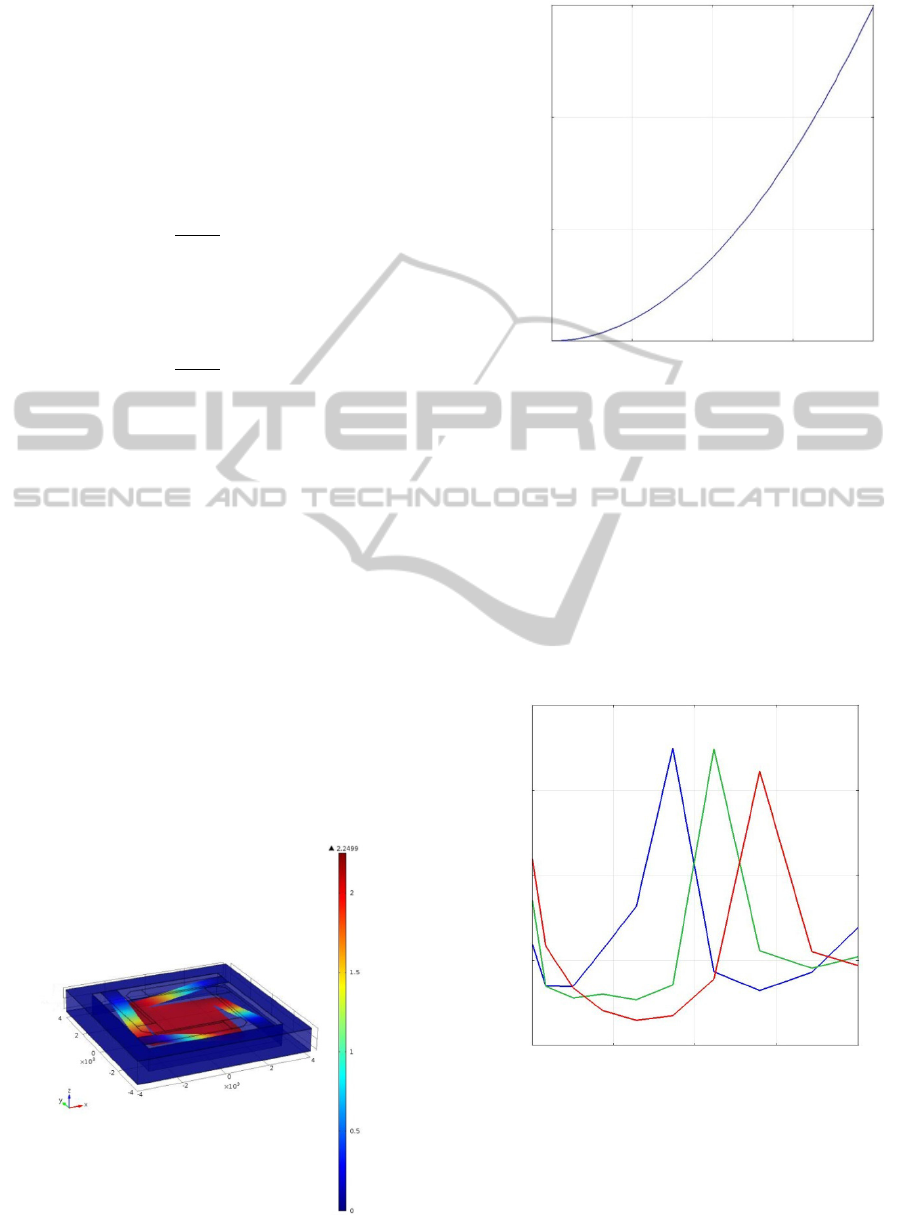
The central wavelength (CWL) of the output
transmission peak is related to the distance between
the top and bottom reflector. As shown in Fig. 4,
The CWL is 11.56 μm, when the distance between
the top and bottom reflector is 6.17 μm.
Figure 4: The simulated transmission of the tunable FP
filter.
T
θ
R d
108.75
11.25
12.5 13.75
0.25
0.75
1
Wavelength (μ
m
)
The transmission of tunable FP Filter
0
0.5
BIODEVICES2014-InternationalConferenceonBiomedicalElectronicsandDevices
172
2.3 Electromechanical System
The metal layers in top and bottom reflector carriers
consist of capacitor structure. The electrostatic force
of the capacitor results in the change of the distance
between the top and bottom reflector when the
voltage is applied on the planes of capacitor.
The electrical force F of the capacitor structure can
be expressed by
2
(4)
Where C is the capacitance, V is the voltage between
the two planes. The bottom of the plane is fixed,
therefore, the pressure P on the top plane is
2
(5)
Where S is the area of the capacitor plane. The
electromechanical simulation is performed by the
software COMSOL. The C is 11.1763 pf, when the
voltage is 20 V, S is 8.55 mm
and d is 6.8 µm. The
displacement of the top reflector is 2.25 µm as
shown in the Fig. 5, when the voltage on the top
plane is 20 V. Because the bottom reflector is fixed,
the displacement of the top reflector is equal to the
change of distance between the top and bottom
reflector.
When the voltage changes from 0 V to 20 V, the
distance between the top and bottom reflector plates
increases from 0 µm to 2.25 µm as shown in the Fig.
6. Due to the pull-in effect, the tuning distance
between the two reflectors should be less than 2.27
µm which is one third of the initial distance 6.8 µm.
In order to get the stable tuning range of the
transmission, the input voltage should be less than
20V.
Figure 5: The displacement of the top reflector.
Figure 6: The change of distance between the top and
bottom reflector due to the applied voltage.
The change of distance between the top and bottom
reflector results in the transmission peak shift, when
the voltage is different as shown in Fig. 7. When the
voltages are 0 V, 14 V and 20V, the central
wavelength of the transmission peaks are 12.19 µm,
11.56 µm, and 10.9 µm, respectively. As shown in
the Fig. 8, when the voltage changes from 0V to 20
V, the transmission peak shift increases from 0 µm
to 1.29 µm.
Figure 7: The transmission peak of the tunable FP filter.
5
0
10
15 20
0.75
1.5
2.25
The voltage applied on the capacitor (V)
The change of distance between the
reflectors
(
µ
m
)
0
10 8.75 11.25
12.5 13.75
0.25
0.75
1
Wavelength (μm)
The transmission of tunable FP Filter
0
0.5
0V
14V
20V
TunableFabry-PérotFilterforOpticalGlucoseMonitoring
173
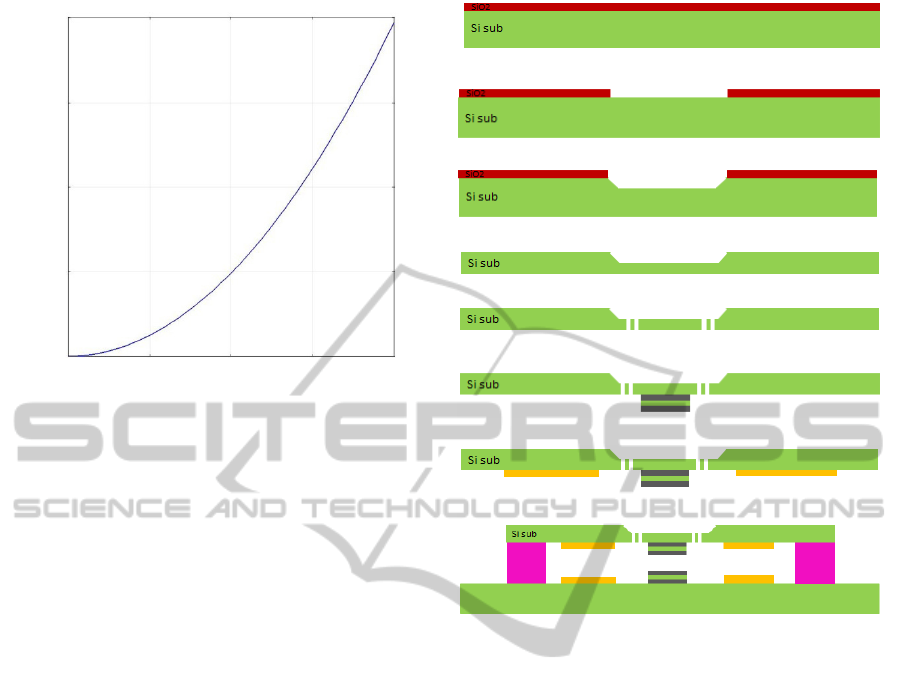
Figure 8: The transmission peak shift due to the applied
voltage on the capacitor.
2.4 Fabrication
The proposed fabrication of the MEMS Fabry-Pérot
filter is based on a bulk micromachining approach.
Two structured wafers are bonded together by an
intermediate SU8-layer to form the top and bottom
reflector. The optical area in the center of the chip is
surrounded by control electrodes.
The silicon wafer is 4 inch in diameter and 525
µm thick. In order to achieve good transmittivity, the
wafer is polished to reduce the thickness to 300 µm.
The fabrication starts with deposition of silicon
dioxide which is used as the block layer of wet
etching of silicon as shown in Fig. 9(a).
The silicon dioxide layer is under etching by
buffered oxide etch (BOE) to form the window for
silicon etching as shown in Fig. 9(b).
The silicon is
selectively etched by Tetramethylammoniµm
hydroxide (TMAH) from backside as shown in Fig.
9(c).
In the next step, the other silicon dioxide is
etched by BOE as shown in Fig. 9(d), and the
springs of the top movable reflector carrier is formed
by etching the silicon material as shown in Fig. 9(e).
The proposed DBR structure of the reflector is
formed by depositing Ge/Al
2O3/Ge layers as shown
in Fig. 9(f). The thickness of the Ge layers of is 850
nm and the thickness of the Al2O3 layer is 629 nm.
Germanium Evaporation is realized by Innotec
ES26C E-Gun Evaporator.
Al2O3 deposition is
fabricated by the plasma-enabled atomic layer
deposition (ALD) system.
(a)
(b)
(c)
(d)
(e)
(f)
(g)
(h)
Figure 9(a)-(h): The fabrication process flow of the
tunable FP filter.
The top electrode is formed by using physical
vapour deposition Sputter System to sputter Au in
the front side of substrate as shown in Fig. 9(g). The
thickness of the Au layer is 0.5 µm.
The fabrication of the bottom reflector carrier is
similar to the top reflector carrier except for the
etching process to form the backside open and
springs. Both the wafers with the movable top and
the bottom fixed reflector carriers respectively are
connected with a SU-8 interface layer as shown in
Fig. 9(h).
The proposed layout of the tunable FP filter is
shown in Fig. 10. Ledit software is used to draw the
layout. The width of the reflector is 2.1mm. The
width of the spring is 0.75 mm and the movable area
of the top carrier is 3.6 × 3.6 mm. The area of the
metal pad is 1.2 × 1.2 mm.
5 0
10
15 20
0.65
0.975
1.3
The voltage applied on the capacitor (V)
The transmission peak shift (µm)
0.325
0
BIODEVICES2014-InternationalConferenceonBiomedicalElectronicsandDevices
174
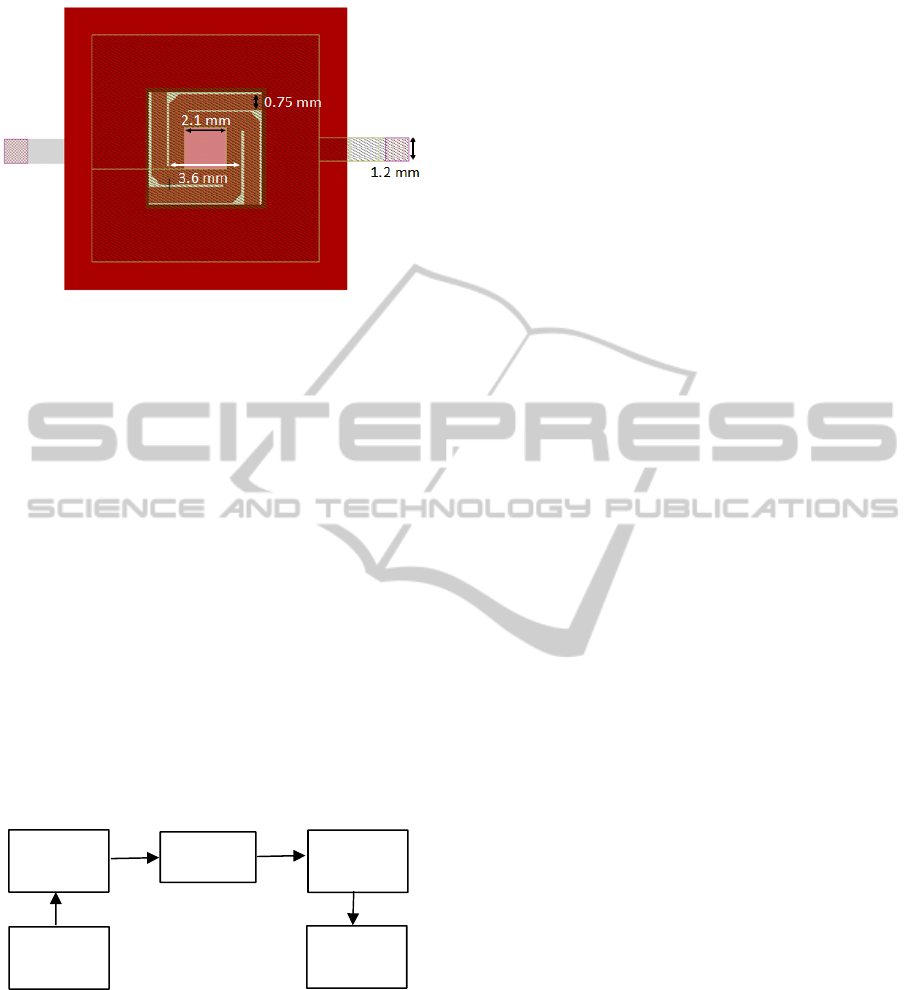
Figure 10: The layout of the tunable FP filter.
2.5 Testing System
In order to control the voltage between the top and
bottom capacitor planes, a Korad voltage supply
KA6003P can be used as reference. The voltage
supply is a programmable single-channel, constant-
voltage power supply with low noise, high reliability
and high accuracy.
The glucose sensor system consists of a voltage
supply, tunable FP filter, detector, testing circuit,
and PC as shown in Fig. 11. The reference detector
is a thermopile detector MLX90614 from Melexis.
The MLX90614 is an Infrared thermometer for non-
contact temperature measurements. Both the IR
sensitive thermopile detector chip and the signal
conditioning ASIC are integrated in the same TO-39
can.
Evaluation board EVB90614 from Melexis is
used as the testing circuit which includes an easy
interface between the MLX90614 infrared
thermometer in TO-can and a PC.
Figure 11: The schematic of glucose sensor system.
3 CONCLUSIONS
In summary, a tunable MEMS Fabry-Pérot filter for
the Long-Wave Infrared range is proposed and
simulated. By applying a voltage ranging from 0 V
to 20 V, the tuning range of output transmission
peak shift from 10.9 µm to 12.19 µm is obtained.
The tunable FP filter is the key part of glucose
sensor and has other applications in hyperspectral
imaging, spectrometers, telecommunication and
light sources, etc.
REFERENCES
Smart WH, Subramanian K., 2000. The use of silicon
microfabrication technology in painless blood glucose
monitoring. Diabetes Technol Ther.
Pfützner A, Caduff A, Larbig M, Schrepfer T, Forst T.,
2004. Impact of posture and fixation technique on
impedance spectroscopy used for continuous and non-
invasive glucose monitoring. Diabetes Technol Ther .
Rossetti P, Porecellati F, Fanelli CG, Bolli GB., 2006.
Evaluation of the accuracy of a microdialysis-based
glucose sensor during insulin-induced hypoglycaemia,
its recovery, and post-hypoglycaemic hyperglycaemia
in humans. Diabetes Technol Ther.
Cass AEG, Francis DG, Hill HAO, Aston WJ, Higgins IJ,
Plotkin EV., 1984. Ferrocene-mediated enzyme
electrode for the amperometric determination of
glucose. Anal Chem.
Shen YC, Davies AG, Linfield EH, Taday PF, Arnone
DD., 2003 The use of Fournier-transform infrared
spectroscopy for the quantitative determination of
glucose concentration in whole blood. Phys Med Biol.
Esenaliev RO, Larin KV, Larina IV., 2001 Non-invasive
monitoring of glucose concentration with optical
coherence tomography. Optics Letter.
Dieringer JA, McFarland AD, Shah NC, Stuart DA,
Whitney AV,Yonzon CR., 2006. Surface-enhanced
Raman spectroscopy: new materials, concepts,
characterization tools, and applications. Faraday
Discuss.
Cameron BD, Baba JS, Coté GL., 2001. Measurement of
the glucose transport time delay between the blood and
aqueous humour of the eye for the eventual
development of a non-invasive glucose sensor.
Diabetes Technol Ther .
Malchoff CD, Shoukri K, Landau JI, Buchert JM., 2002.
A novel non-invasive blood glucose monitor. Diabetes
Care.
Noro, M., Suzuki, K., Kishi, N., Hara, H.,Watanabe, T.,
Iwaoko, H., 2003. CO2/H2O gas sensor using tunable
Fabry-Pérot filter with wide wavelength range. Proc.
IEEE MEMS 2003 Conf.
Stupar, P. A., Borwick, R. L., DeNatale, J. F., Kobrin, P.
H., Gunning, W. J., 2009. MEMS tunable Fabry-Pérot
filters with thick, two sided optical coatings. Proc.
IEEE Transducers 2009 Conf.
N. Neumann, M. Ebermann, E. Gittler, M. Meinig, S.
Kurth, and K. Hiller., 2010. Uncooled IR sensors with
tunable MEMS Fabry-Pérot filters for the long-wave
infrared range. In Sensors, 2010 IEEE.
Macleod, H.A., 2001. Thin-Film optical filters, IoP,
Bristol and Philadelphia.
Tunable
FP filter
detector
Testing
circuit
Voltage
supply
PC
TunableFabry-PérotFilterforOpticalGlucoseMonitoring
175
