
New Nonlinearities Interpolation Approach Applied to Surface EMG
Signal
Abdul Khaleq A. Al-naqeeb
1
, Ayad A. Ibrahim
2
and Qussay S. Tawfeeq
2
1
College of Medical and Health Technology, Baghdad, Iraq
2
Department of Electrical Eng. University of Technology, Baghdad, Iraq
Keywords: Electromyography (EMG), Interpolation, Nonlinearities Interpolation, Fatigue, Power Spectral Density,
Robust Filtering Method.
Abstract: One of the main problems that arise in many scientific engineering applications is the estimation of the
missing data in a sequence of a series. A new technique is proposed in this work to handle such a problem.
An implementation of a feedback for missing process in the surface of electromyography signal has been
carried out by developing a robust forecasting formula on the basis of nonlinearities interpolation technique
(NIT). Extracted electromyography signal from a Biceps Brachii muscle of one subject aged 35 years has
been studied when muscle on tension under normal and fatigue conditions. A pair of gold-coated stainless
steel bipolar electrodes have been used for the detection of the electromyography. The damaged signals are
derived from the actual signals, with the amount of damage of about 80%. With a processing time of 50
msec, results show a conformity of the interpolated signals to those of the real electromyography signals,
with a high degree of accuracy among the values of interpolated and of the real signals.
1 INTRODUCTION
With electrodes mounted on the skin surface of the
muscle, an electric signal is detected when a muscle
contracts, known as the surface EMG. This noise
like signal is an interference pattern which is the
temporal and the spatial sum of action potentials
from all motor units in the region of the detecting
electrodes (Harba & Ibrahim, 1986). Raw EMG can
range between +/- 5000 microvolts and typically the
frequency contents ranges between 6 and 500 Hz,
having most frequency power between ~ 20 and 150
Hz (Konrad, 2005).
The digital interpolating technique has been used
by Zheng Y. and Jan V. der Spiegel to predict the
analog signal before it is converted by using analog
to digital converter. Algorithms are derived from
the spline theory. Such converters are expected to
have reduced complexity in their analog circuitry
and can be easily implemented using digital filter
(Yang & Spiegel, 2005).
The estimates of missing data in a sequence of
series is considered as one of the main problems that
arise in many scientific and engineering problems.
In most applications, these sequences converge very
slowly, and this makes their direct use to
approximate limits an expensive proposition.
However, there are important applications in which
they may even diverge. In such cases, the direct use
of the infinite sequences to approximate their so
called "antilimits" would be impossible. "Antilimits"
can be interpreted in approximate ways depending
on the nature of the infinite sequence. One of these
ways is the interpolation, which has been recognized
by Richardson and Aiken (Sidi, 2003).
The aim of this work is to predict missing
samples. The available and missed samples are
impartial in planning, monitoring, and system
evaluation. In order to estimate the missed samples,
special normality assumption is imposed along with
constraining the interpolation process within the data
range.
In this work a Kolmogrov-Smirnov Z statistics is
applied to measure the goodness of fit (distribution
test) to the real and interpolated signals.
A mean square error (MSE) is also applied.
2 THE PROPOSED TECHNIQUE
Suppose an observed sample
consist of two
components which are,
representing by the core
171
A. Al-naqeeb A., A. Ibrahim A. and S. Tawfeeq Q..
New Nonlinearities Interpolation Approach Applied to Surface EMG Signal.
DOI: 10.5220/0004787401710177
In Proceedings of the International Conference on Bio-inspired Systems and Signal Processing (BIOSIGNALS-2014), pages 171-177
ISBN: 978-989-758-011-6
Copyright
c
2014 SCITEPRESS (Science and Technology Publications, Lda.)

process in addition to irregular outliers,
then;
(1)
Applying the robust filtering technique for the
contaminated data that were used by (Al-Naqeep,
1997) accompanied by a sequential least square
method for autoregressive coefficients, the
forecasted data are obtained as:
∑
∅
.
(2)
Where; {
} represents the regret core process,
∅
represents autoregressive coefficient, and (P)
represents the order of the autoregressive equation in
time series based on (Akaike, 1969).
A weighted estimation is required here (Davis &
Jones, 1968), which is;
⁄
(3)
Where;
W is an even function, more ever,
0
1,
∞
0,
represent the positive square error.
can be determined by adding the average
observed weight and the forecasted one, where,
1
4
or;
5
and,
6
Where; is an active function and;
∅
7
c is an efficiency constant (Thomson, 1977).
The proposed method maintains the observed
data when errors are scared and the forecasted data
for large error.
The whole process is nonlinearities, and to
prevent complications in the EMG signal, an
affected function needs to be selected. The selection
is to guarantee no effects of large error in the
spectrum contents of the EMG signal.
The missed signal values are obtained using a
nonlinearities interpolation formula. This formula
supposes outlier values, Known as an upper outlier.
In order to obtain a symmetric distribution, the
distribution shall be in accordance with a standard
accumulative density function w (u) for extreme
value distribution. The density function is;
|
|
(8)
Where;
q: Represents a constant value that is defined
through the cumulative of the standard normal
distribution function Φ
N(0,1)
.
u: Represents the random variable of Gumbel
distribution function of type one.
Then, in some way, the linear interpolation
formula is (Hintze & Kaysville, 2007);
.
..
(9)
Where; ′
O and M are defined the two extreme points
that the ordered of the interpolation's ranks
induced to the backward and forward
observations
x
and x
repectively.
A constant weighted logarithmic relation is used
to process of extreme values for forecast ones. The
weighting is done in order to obtain the highest
efficiency possible. This is done empirically, and a
weighting factor (k) of, k=3, was found to be more
suitable for the best signal reconstruction. The
weighted, nonlinearities logarithmic relation used in
this work related to the equation (1) is;
.
..
(10)
To obtain reliable and new estimates of the
parameters
∅
and then the estimates of the
sequenceσ
, the sequence
x
will be used instead
of y
in the autoregressive accordance model.
Sequences ∅
are used consequently, to obtain the
new estimation in order to get the final
x
. This
means that the value of
in the previous session
is equal to or less than that variable in the previous
session. The filtering operation will be completed
and the forecasting processes of the missing values
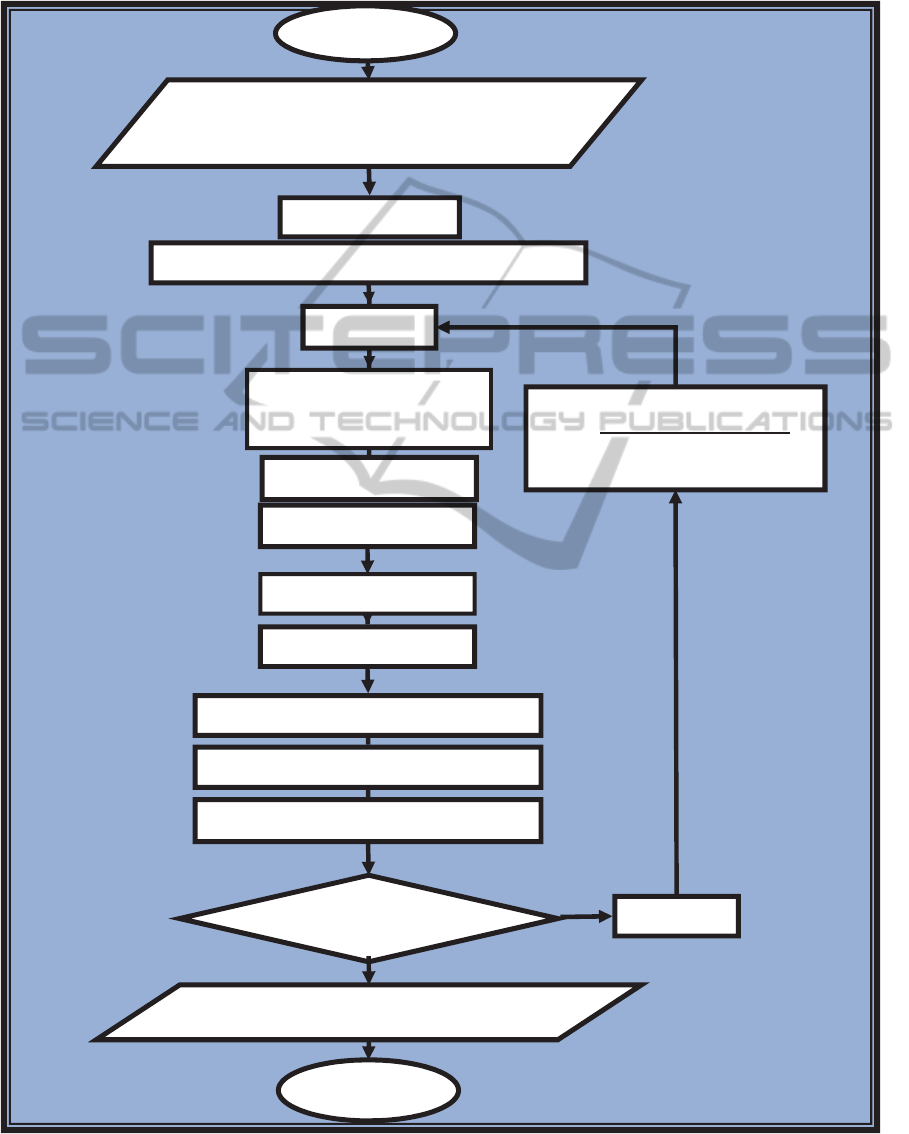
of the signal are obtained. Figure 1 shows a
flowchart of the proposed method algorithm.
3 DATA ACQUISITION SYSTEM
The Biceps Brachii of one subject aged 35 years was
studied when muscle on tension. A weight of 5 Kg
was held in the palm of the subject with arm
outstretched and supported on the elbow, for five
minutes to ensure that the muscle is in the fatigue
state. A pair of bipolar electrodes was used for the
detection of the EMG. The electrodes are dry
surface, gold-coated stainless steel the electrode
BIOSIGNALS2014-InternationalConferenceonBio-inspiredSystemsandSignalProcessing
172
separation being 20 mm. The pre-amplifiers are
similar to those in (Miller & Reed, 1977). They have
a high common mode rejection ratio (CMRR >80
dB) at the main power frequency, and high
differential gain (≈ 60 dB). The EMG is passed to a
laptop via an 8-Bit A/D converter with a sampling
Figure 1: Shows a flowchart of the proposed formula.
Start
Read input si
g
nal samples & store in
arra
y
(
AIC
)
Criterion
Pilot estimate
Order selection b
y
(
AIC
)
Criterion
I=0
.
..
Autoregressive Model
Sequentially L.S.EST
.
White Noise ε
(
I
)
Prewritin
g
(
RESIDUALS
)
Ins
p
ection b
y
Filter Watched Selection
Correct with Prewritin
g
Correct with Care Pro
g
ress
Print The Final Estimates
Stop
Yes
No
I= I +1
NewNonlinearitiesInterpolationApproachAppliedtoSurfaceEMGSignal
173
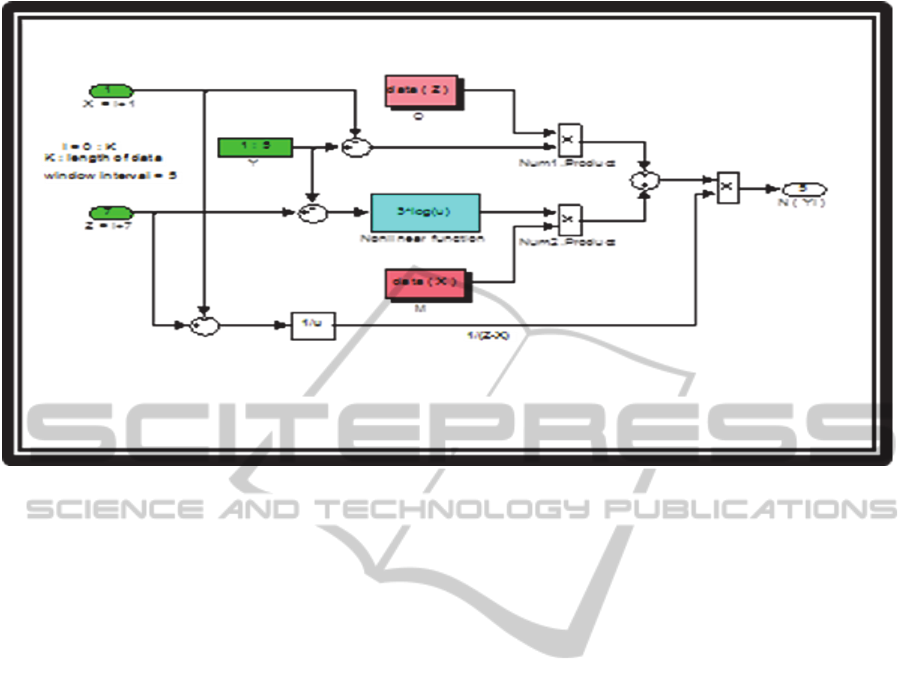
Figure 2: Proposed nonlinearities interpolation formula structure.
frequency of 8 KHz. The digital output is a positive
integer numbers lying between 0 and 255. The use
of the laptop is preferred instead of PC for the
complete isolation between the subject and the main
power lines, and also to reduce interference and for
the same reasons, the power of the amplifier is
supplied by batteries (Adriano, Andrade, Slawomir,
Nasuto, Kyderd, 2007). A series of (twenty fifth)
data files, each with a time interval of 1 sec. are
stored in the computer . A selective time windows of
the recorded signals from the Biceps Brachii of the
subject have been chosen (R5, R1, R15, R20, R25) in
this work. The damaged signals have been derived
from the real's signals, with the amount of damage
of about 80%.
Figure 2 shows a Simulink representation of
proposed nonlinear interpolation for 5 missing
ascended data (i.e. with total interval process equal
to 7 data samples), where X and Z are the outer loop
counters and Y is the inner counter. The process of
interpolation needs the actual values of the ascended
damage vector with each band of evaluation. The
output values of the interpolated missing data had
been done using nonlinear logarithmic function
weighted with a constant equal to 3 derived from
many trials and error which fulfill minimum error
between actual and interpolated signals.
4 EVALUATION OF THE
PROPOSED TECHNIQUE
In order to build a robust system, a Kolmogorov-
Smirnov - Z statistics test is applied to measure the
goodness of fit (i.e. Fitness of the distribution shape
test) to the real and interpolated signals. This test for
normality is based on the maximum difference
between the observed distribution and expected
cumulative-normal distribution. The results in table1
show high evidence to reject the statistical
hypothesis of normal distribution function
assumption for all of the studied real and linearity
interpolated to form of EMG signals. That invited to
searching for a suitable nonlinear interpolated
formula that capable for estimation and reparation of
missing part that might be occurred for the signal
due to different reasons.
MSE has been reported through applying the
Analysis Of Variance (ANOVA) for regressive
analysis between the real signal as an independent
interpolated signal as a dependent variable.
Table 2 shows that MSE for the Nonlinear
Interpolated to real EMG is less than MSE of the
Linear Interpolated to real EMG.
Figures 3 illustrates a normalized amplitudes of
damaged, real with nonlinear interpolated EMG
signals with total processing time period of50 msec.,
under normal muscle condition with R5 and X5
window case. Where processing time of 50 msec. is
BIOSIGNALS2014-InternationalConferenceonBio-inspiredSystemsandSignalProcessing
174
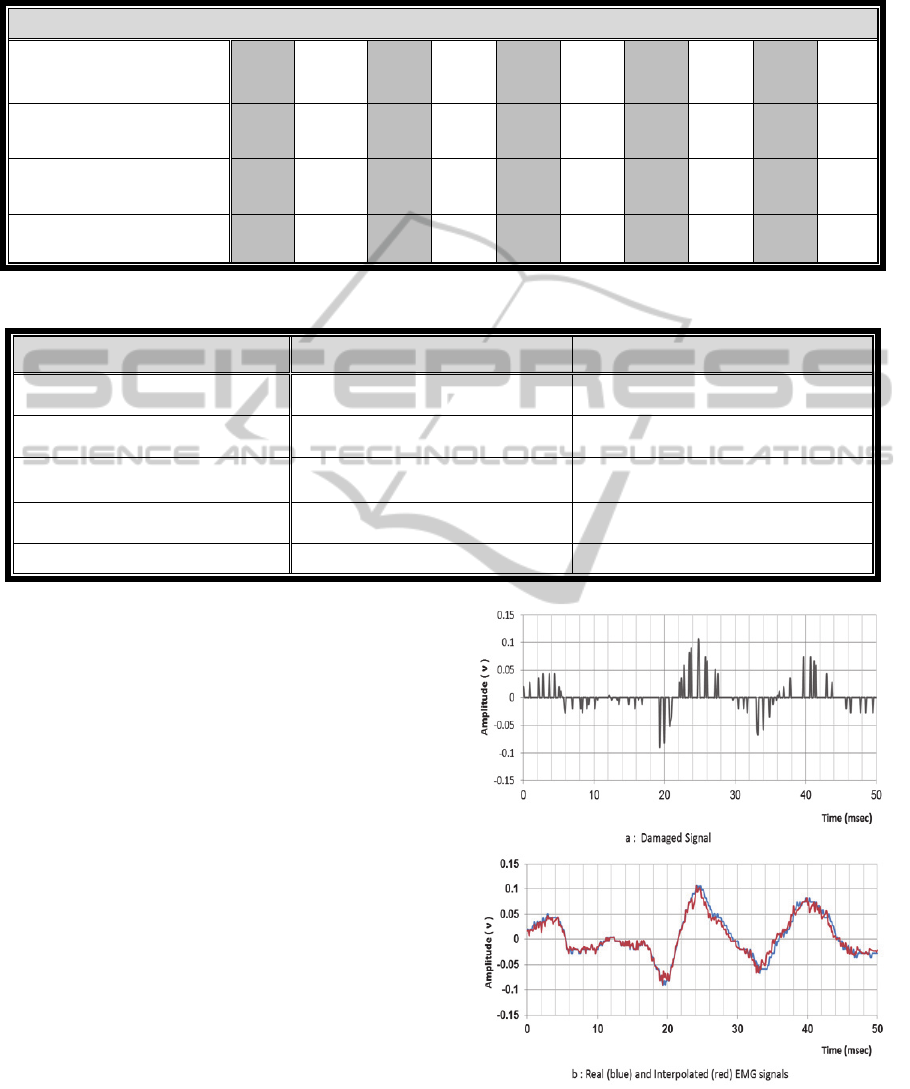
Table 1: Normal distribution function Goodness of fit testing hypothesis for real and interpolated EMG signals for selected
time windows.
One-Sample Kolmogrov-Sminove Test
Signal Windows R5 X5 R10 X10 R15 X15 R20 X20 R25 X25
No. of samples 397 397 397 397 397 397 397 397 397 397
Kolmogorov-
Smirnov Z
2.728 2.273 2.104 1.916 3.774 3.5 2.066 1.696 1.906 1.447
Asymp. Sig. (2-tailed) 0.000 0.000 0.000 0.001 0.000 0.000 0.000 0.006 0.001 0.030
Table 2: (MSE) of regression analysis of variance for linear and nonlinear Interpolated EMG signals.
Window interval Nonlinear interpolated to real EMG Linearly interpolated to real EMG
Window-5 0.04777 e-3 0.06382 e-3
Window-10 0.00932 e-3 0.01624 e-3
Window-15 0.04784 e-3 0.07734 e-3
Window-20 0.19470 e-3 0.22840 e-3
Window-25 0.15380 e-3 0.29480 e-3
suitable for EMG signal processing and applications
(Harba & Lynn, 1981). It is clear that, there is a
dramatic tracking of the interpolating signal with
the real one for the whole period, but the robustness
of tracking changed due to the fluctuation level with
different parts of the test period. However, it can be
divided into two main regions due to fluctuating
levels; first one between 0-18 msec. and the second
one between 18-45 msec. approximately. First
period shows a low fluctuating level which leads to
make high tracking robustness processing, while in
the second period 18-45 msec., the fluctuation level
increases gradually. In the other word, if the rate of
change is being very large, the interpolation will
lose some of tracking robustness due to small drift
presentation which increases the error between the
two signals.
Regardless the value and the number of the
missing samples and due to the error values, the test
period can be divided into two regions as well.
However, while the rate of change is low, minimum
error can be sensed. In contrast, as the rate of
change is high caused by increasing of the
fluctuation level, the interpolation will lose some of
tracking robustness due to small drift presentation
which increases the error between the two signals.
Figure 3: a): damaged signal; b): real and nonlinear
interpolated EMG signals) during time period of 50 msec.
under normal condition with R5 window case.
NewNonlinearitiesInterpolationApproachAppliedtoSurfaceEMGSignal
175
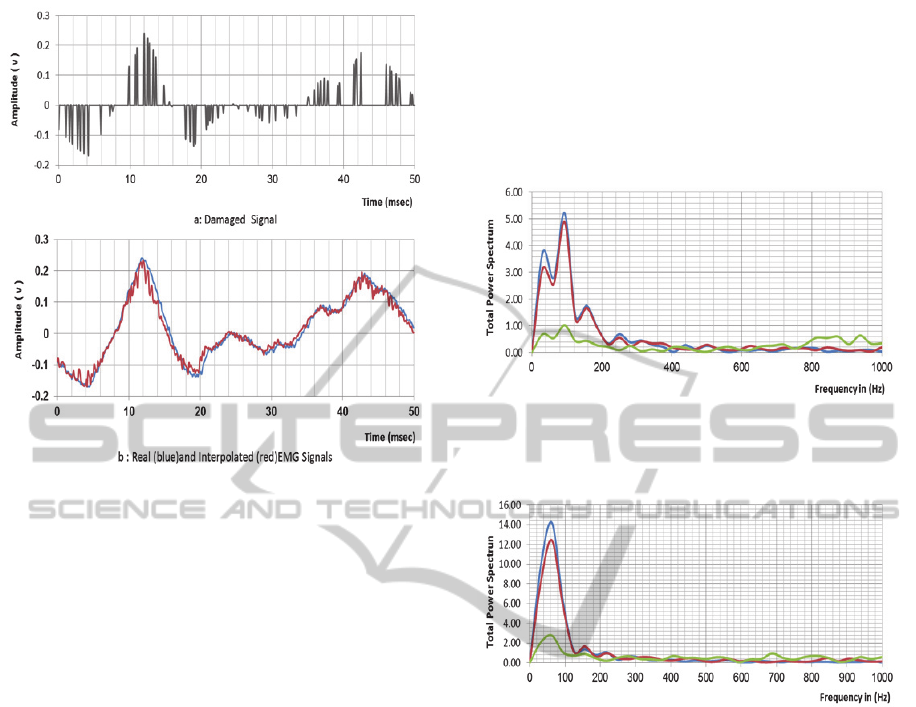
Figure 4: a): damaged signal; b): real and nonlinear
interpolated EMG signals; during time period of 50 msec.
under fatigue condition with R25 window case.
Similarly, figure 4 illustrates similar normalized
axes with different sets of data measurement test
number under fatigue muscle condition with R25
and X25 window case during 50 msec. time period.
Although the real EMG signal is changed with test
number, the sharp rate of change (severe
fluctuation) in the data still has the major effect on
the proposed interpolation method. As shown in the
period from 5 msec. to 22 msec., there is an error.
In other word, low robustness for interpolation. In
contrast, between 22 msec. and 40 msec. The
proposed nonlinear interpolation recovers it's high
tracking robustness process, when the envelop of
the real signal being low fluctuated and error is
reduced.
During time period 40 msec. to 50 msec. The
drift occurs again due to the increasing rate of
change and this leads to decreased interpolation
robustness slightly to produce increasing in error.
Figures 5 and 6 show the power spectral
densities of real, nonlinear interpolated and
damaged EMG signals subjected to normal and
fatigue states respectively using Fast Fourier
Transform (FFT) calculation. It is clear that the
nonlinear interpolated signals have recovered most
energy spectrum of the real signals compared to the
spectrum of the damaged signals, also the shift of
the EMG power spectrum towards lower
frequencies give as an index for a fatigue (Deluca,
1997; Gozalez-Izal, Malanda, Navarro-Amezqueta,
Gorostiaga, Mallor, Ibanez, Izquierdo, 2010).
Therefore, the fatigue of muscles can be detected
efficiently by using power spectrum of the
nonlinear interpolated signals to give fatigue
alarming case. While due to the confused spectrum
of the damaged signals, we cannot get useful
information as an index for fatigue.
Figure 5: The spectral densities of the real (blue)
interpolated (red), and damaged (green), signals under
normal condition with R5 window case.
Figure 6: The spectral densities of the real (blue)
interpolated (red), and damaged (green), signals under
normal condition with R25 window case.
5 CONCLUSIONS
A new nonlinearities (logarithm function)
interpolation technique has been implemented on
the EMG signal as a result of a highly evidence to
reject the statistical hypothesis of normal
distribution function assumption for all of the
studied real and linearized interpolated to form of
EMG signals.
Eventually, the time responses mentioned in
Figure 3 and 4 described two main issues; tracking
robustness of interpolation and the amount of
sudden rate of change in the real measured EMG
signal. Despite of small drifts and regardless of the
value and the number of the missing samples, it can
be concluded that the proposed interpolation
method is very efficient and can be applied for other
type's bio-medical signals.
BIOSIGNALS2014-InternationalConferenceonBio-inspiredSystemsandSignalProcessing
176

The results of the proposed formula of nonlinear
interpolation, that deals with non-normal shape of
signal distribution function, which belongs to the
non-convergence property, is approaching from the
results of the conventional method in the case of
non-contaminated distributions, and that results are
better than the results of the conventional method in
the case of dealing with contaminated distributions
(I: e known Robust formula).
We can conclude that the nonlinear interpolation
signal may resemble the real signal in terms of
shape, spectrum and the capability to recover
energy of the real signal.
In addition to that, the suggested formula
represents highest grades of accuracy between real
and interpolated signals whatever a difference
between the conventional state (with and without
stress).
One of the most important recommendations is
to explore the essence of the lost part of the studied
signal through residual values. Furthermore, it is
recommended that the proposed technique can be
applied to physical body’s properties such as
(MUAC, trunk length related to abdomen center).
Due to data compression technique, the
proposed algorithm has the same orientation, where
the number of data has been compressed to about
20% from the actual size of data (which is called
the damaged signal). Therefore, it can be extracted
again using the proposed algorithm.
Despite the fact that the application was for one
subject only, but, the results are very promising to
be applied to many for getting better reliable
algorithm.
REFERENCES
Adriano, O., Andrade, J., Slawomir ,Nasuto , Kyderd, P.,
2007. "Extraction of motor unit action potentials from
electromyographic signals through generative
topographic mapping". Journal of the Franklin
Institute 344.pp154-179.
Akaike, H., 1969. "Fitting autoregressive models for
predictions". Ann. Inst. Statist. Math. Vol. 21.Pp 243-
247.
AL-Naqeeb, A. A., 1997. "Robust Estimation of power
spectra with application". Ph.D. Dissertation
University of Baghdad. Iraq.
Davis, H. T., Jones R. H., 1968. "Estimation of the
Innovations Variance of Stationary time Series".
JASA, Vol. 63. Pp 141-149.
De Luca, C. J., 1997. "The use of surface
electromyography in biomechanics". Journal of
applied biomechanics, 13, pp. 135-163.
Gozalez-Izal , M., Malanda, A., Navarro-Amezqueta, I.,
Gorostiaga, E.M., Mallor, F., Ibanez, J., Izquierdo,
M., 2010."EMG spectral indices and muscle power
fatigue during dynamic contractions". Journal of
Electromyography and Kinesiology, 20, pp 233-240.
Harba, M. I, A., Ibrahim, A. A., 1986. "EMG processor
based on the amplitude probability-distribution". J.
Biomed. Eng. Vol. 8. 105-114.
Harba, M. I, A., Lynn, P. A., 1981. "Optimizing the
acquisition and processing of surface EMG signals".
J. Biomed. Eng. Vol. 3. 100-106.
Hintze, J. L., Kaysville, 2007 Statistical application,
NCSS, Utah 84037.
Konrad, P., 2005. "The ABC of EMG- A Practical
Introduction to KinesiologicalElectromyography".
Naproxen INC. USA, Version 1.0.
Miller, J. S. G., Reed, G. A. L., 1977. "Miniature skin-
mounted Preamplifiers for measurement of surface
electromyographic Potentials". Med. Biol. Eng.
Comput. Vol. 15.pp. 710-711.
Moore, R., Lopes, J., 1999. Paper templates. In
TEMPLATE’06, 1st International Conference on
Template Production. SCITEPRESS.
Sidi, A., 2003. "Practical extrapolation methods theory
and applications". Cambridge University Press.
Smith, J., 1998. The book, The publishing company.
London, 2
nd
edition.
Thomson, D. J., 1977. "Spectrum estimation techniques
for characterization and development of WT4
Waveguide –I", Bell system The. J. 56, pp. 1769-
1815.
Yang, Z., der Spiegel, J. V., 2005."Extrapolation analog-
to-digital converter". The 48th IEEE Midwest
Symposium on Circuits and Systems. MWSCAS
2005), pages 847-850.
NewNonlinearitiesInterpolationApproachAppliedtoSurfaceEMGSignal
177
