Human Body Orientation Estimation using a Committee based Approach
Manuela Ichim
1
, Robby T. Tan
2
, Nico van der Aa
3
and Remco Veltkamp
2
1
University Politehnica of Bucharest, Bucharest, Romania
2
Utrecht University, Utrecht, The Netherlands
3
Noldus Information Technology, Wageningen, The Neterlands
Keywords:
Human Body Orientation, Neural Network, Support Vector Machine, Gaussian Mixture Models, PCA,
Supervised Learning.
Abstract:
Human body orientation estimation is useful for analyzing the activities of a single person or a group of people.
Estimating body orientation can be subdivided in two tasks: human tracking and orientation estimation. In
this paper, the second task of orientation estimation is accomplished by using HoG descriptors and other cues
such as the velocity direction, the presence of face, and temporal smoothness. Three different classifiers:
Gaussian Mixture Model, Neural Network and Support Vector Machine, are combined with the information
from those cues to form a committee. The performance of the method is evaluated and the contribution to the
final prediction of each classifier is assessed. Overall, the performance of the proposed approach outperforms
the state-of-the-art method, both in terms of estimation accuracy, as well as computation time.
1 INTRODUCTION
The estimation of human body orientation is a task
with potential use in many areas of modeling hu-
man activity and interaction. Determining how people
move in an environment is a key step in understand-
ing their actions. Among other applications, video
surveillance systems can benefit from the task.
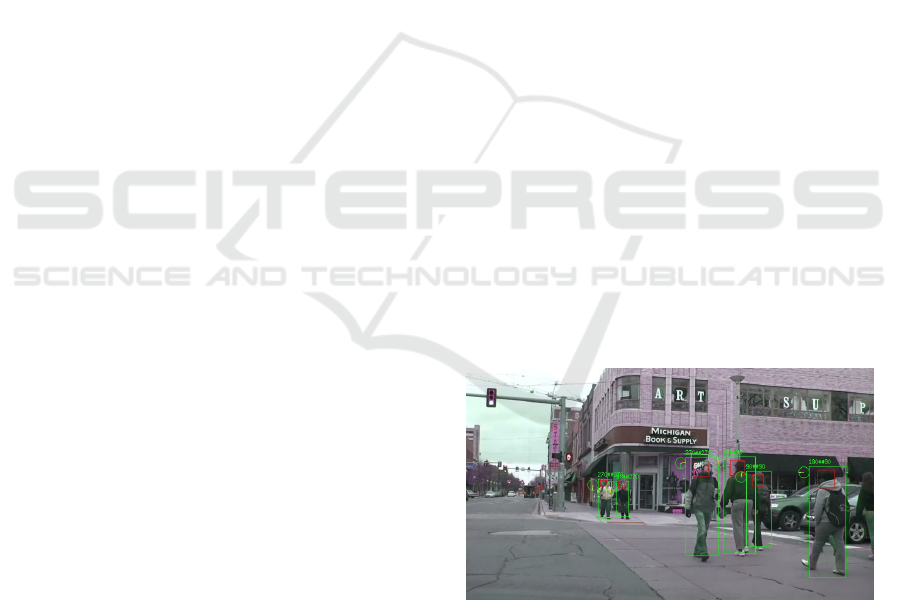
The goal of this paper is to estimate the body ori-
entation of multiple human targets from a video se-
quence captured by a single view moving camera,
as shown in Figure 1. Accomplishing this goal re-
quires a few stages including human body detection
and tracking. Additional computation, such as deter-
mining real-world 3D position coordinates of the tar-
gets and velocity orientation, can improve the results.
Estimating human body orientation can be formu-
lated as a classification task with multiple classes of
body rotation angles, where in this paper they are 8
distinct classes. The appearance of human targets is
modeled by a dense grid of HoG descriptors (Dalal
and Triggs, 2005), which are robust to scaling and
light conditions, thus increasing the consistency of
appearances within a given class. Additional cues are
also used, such as the velocity orientation of the tar-
gets, the presence of face, temporal smoothing, etc.
A few methods have been introduced in the lit-
erature. Chen et al. (Chen and Odobez, 2012) as-
Figure 1: Output of our method. The green boxes are the
detected humans. The red boxes are the detected heads. The
first numbers are our estimated orientations, and the second
numbers are the references.
sume that bounding boxes for the bodies and heads of
the targets are given and information regarding their
velocity direction and velocity magnitude are known.
The final result of the algorithm consists of orienta-
tion estimations for head and body. They use the ker-
nel based formulation to solve the problem. Tosato et
al.(Tosato et al., 2012) address the problem of human
orientation estimation by introducing a novel descrip-
tor, Weighted ARay of COvariances (WARCO). This
descriptor is based on the covariance of the features,
which has been previously used for pedestrian detec-
tion. WARCO enables the classification of human tar-
gets possible despite some noisy pixels.
Lu et al. (Lu and Little, 2006) consider a template-
515
Ichim M., T. Tan R., van der Aa N. and Veltkamp R..
Human Body Orientation Estimation using a Committee based Approach.
DOI: 10.5220/0004673805150522
In Proceedings of the 9th International Conference on Computer Vision Theory and Applications (VISAPP-2014), pages 515-522
ISBN: 978-989-758-009-3
Copyright
c
2014 SCITEPRESS (Science and Technology Publications, Lda.)
based framework for tracking and recognizing ath-
letes’ actions using only visual information. The con-
sidered targets are encoded with a PCA-HoG descrip-
tor, obtained by applying Principal Component Anal-
ysis (PCA) to the Histogram of Oriented Gradients
(HoG) descriptor. This ensures a robust representa-
tion under variations in illumination and scale, while
keeping computational costs low.
In this paper, we offer four main contributions:
First, we introduce a method that incorporates a set of
different classifiers and cues, allowing us to be more
flexible in choosing the classification methods, and
to have the best results obtained from the combined
response from several classifiers (committee). Sec-
ond, the way velocity information is taken into con-
sideration. In the existing method (Chen and Odobez,
2012), the classes corresponding to the velocity an-
gle class and adjacent ones are favored over the oth-
ers, provided the magnitude of the velocity was above
a certain threshold. Because of the greater flexibil-
ity of our method, we can model the velocity as a
pseudo-classifier using a Gaussian distribution cen-
tered around the class indicated by the velocity di-
rection. Third, the use of face detection. An impor-
tant cue which allows human individuals to recognize
and estimate the orientation of other human targets is
the presence of the face. Face detection can be made
relatively fast and is reliable, provided a minimal set
of image quality are met. Fourth, the utilization of
temporal information. The state of the art method
(Chen and Odobez, 2012) considers the features of
the targets independently from one frame to the other.
However, since the video frames represent succes-
sive moments in time, and since human targets cannot
abruptly change their orientation in a short amount of
time (as between two consecutive frames), it is also
reasonable to include temporal information in the es-
timation process.
2 PROBLEM DESCRIPTION
The input data of the system is a video sequence from
a single view moving camera, depicting one or more
human targets moving freely into, within and away
from the scene. The goal is to estimate the orientation
angle around the vertical axis of the body for each hu-
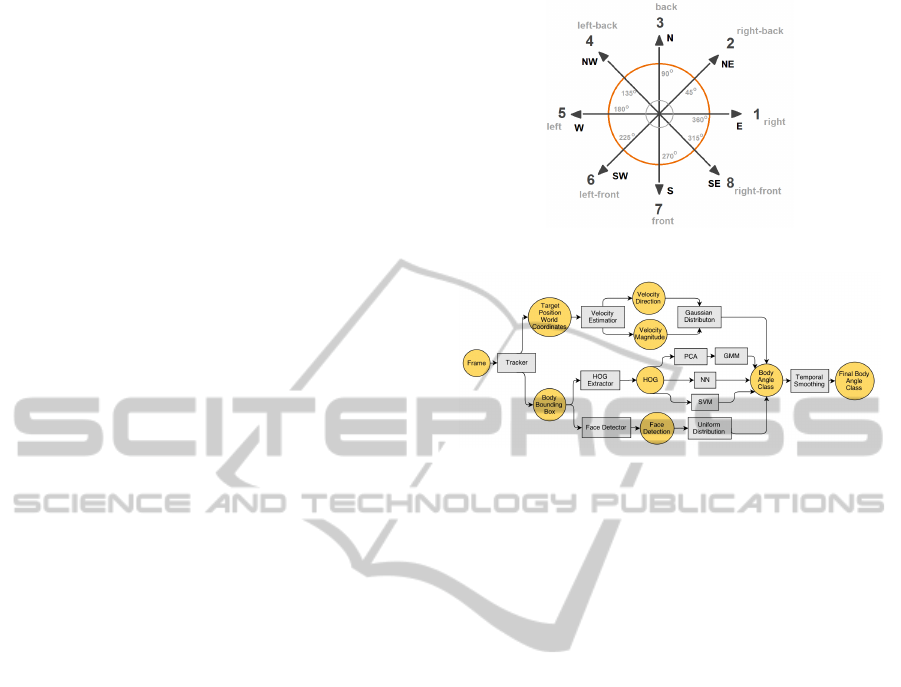
man target at each frame of the video. The output val-
ues of the angle are discretized into 8 distinct classes:
{0, 45, 90, 135, 180, 225, 270, 315} degrees or, al-
ternatively, {E, NE, N, NW, W, SW, S, SE}, where S
or 270 degree represents the front direction, and N or
90 degree represents the back direction, as shown in
Figure 2.
Figure 2: The 8 classes of the body orientations.
Figure 3: Pipeline of our body orientation estimation.
3 COMMITTEE BASED
CLASSIFICATION METHOD
3.1 Pipeline
The pipeline for estimating the body orientation us-
ing our proposed method is summarized in the dia-
gram in Figure 3. The input is video frames where
human tracking is performed using the method de-
scribed in (Choi et al., 2012), which is preferred over
other tracking methods as the input is allowed to be
originated from a single moving camera. Besides, the
method is able to provide the estimates of the posi-
tions of human targets in the real world coordinate
system. This information is particularly useful to de-
termine the velocity direction and magnitude of the
targets, which is an important cue at a later stage.
Aside from the coordinates of the targets, the
method also returns bounding boxes of the targets.
From these bounding boxes HoG descriptors (Dalal
and Triggs, 2005) are extracted. These are then sup-
plied to several pre-trained classifiers (PCA+GMM,
Neural Network and Support Vector Machine), which
produce probability estimates for each of the 8 angle
classes.
Face is an important cue, since it restricts the plau-
sible angle values. To include this information, face
detection is performed on the bounding boxes. To
maintain the consistency of the probabilistic frame-
work, a uniform distribution based on the presence or
absence of a face is generated.
VISAPP2014-InternationalConferenceonComputerVisionTheoryandApplications
516

Another information is velocity direction and
magnitude. This information can be integrated in the
framework by fitting a standard Gaussian distribu-
tion centered around the velocity direction of an an-
gle class, in such a way that a relatively high velocity
yields a high probability for the frontal direction, and
low for the other directions; while, a relatively low
velocity yields the same probability for all directions.
The response from all the above classifiers and ad-
ditional cues are combined and the estimated angle is
considered to be the one with the highest probabil-
ity. However, the final result is filtered using a sliding
window. This additional step is performed to ensure
the temporal smoothness of the change in orientation
and to minimize the effect of misclassifications.
3.2 Probabilistic Framework
The core idea of HoG based classification using mul-
tiple classifiers is based on a probabilistic framework,
where the task of estimating the orientation of a par-
ticular target at a given moment in time (frame) can
be expressed as:
α
∗
= argmax
α
P(α|x) (1)
where α represents the desired angle class, having 8
possible values. x = (x
b
,x
h
,v
d
,v
m
, f
d
) variable en-
compasses the information known about the target,
namely its HoG features for the body (x
b
∈ R
2268
), ve-
locity direction v
d
∈ {1,2, ...,8}, velocity magnitude
v
m
∈ R and face detection f
d
∈ {0, 1,2,3} (0 meaning
no face detection, 1 meaning left facing face detec-
tion, 2 meaning frontal face detection and 3 meaning
right facing face detection).
Maximizing Eq.(1) is proportional to maximize
the likelihood P(x|α), which is determined by the
combined response of the classifiers and cues men-
tioned in the pipeline, and can be expressed as:
P(x|α) ∝ exp
n
l
GMM
(x|α) + l
NN
(x|α) + l
SV M
(x|α)
+ l
velocity
(x|α) + l
f ace
(x|α)
o
(2)
where l
GMM
(x|α), l
NN
(x|α), l
SV M
(x|α), l
velocity
(x|α)
and l
f ace
(x|α) denote the log-likelihood given by the
Gaussian Mixture Model classifier, Neural Network
classifier, Support Vector Machine classifier, velocity
cue and face detection cue, respectively. Details on
the definitions of each of these likelihoods are given
in the following subsections.
Our decision of using a combination of classifiers,
rather than a single one is based on the argumenta-
tion given in (Bishop, 2007) which points out that the
overal error of the committee can only improve the
average error of each individual classifier. Due to the
variability in response of each classifier, the overall
error is expected to be better.
3.3 Gaussian Mixture Model
For each of the 8 classes, a Gaussian mixture model
is computed based on the data points in the training
dataset belonging to that class. Thus, the likelihood
associated with the Gaussian Mixture Model (GMM)
classifier is:
l
GMM
(x|α) = logP
GMM
(x|α)
= log
C
∑
j=1
π
(α)
j
N (x
b
|µ
(α)
j
,Σ
(α)
j
) (3)
where C represents the number of components in a
Gaussian Mixture, N denotes the Gaussian distribu-
tion, π
(α)
j
is a weighting factor and µ
(α)
j
and Σ
(α)
j
repre-
sent the mean and covariance of each Gaussian distri-
bution. Note that the subscript indicates the Gaussian
within the Gaussian Mixture of a class, while the su-
perscript indicates the angle class. Fitting each Gaus-
sian Mixture onto the training data points of a given
class is accomplished using the standard Expectation-
Maximization (EM) algorithm (Bishop, 2007).
3.4 PCA
One of the limitations of the GMM is that the maxi-
mum likelihood estimation tends to produce singular
or near-singular covariance matrices if the data occu-
pies high-dimensional though actually lies on a lower
dimensional manifold (which is usually the case in
practice (Wang, 2011)). This happens as a Gaussian
distribution, part of the mixture, is driven towards
modeling a single data point. Another limitation of
the GMM is that fitting over high-dimensional data is
a slow process, since the EM training algorithm is it-
erative and at each iteration covariance matrices are
computed for each Gaussian distribution in the mix-
ture.
To mitigate the above mentioned limitations, we
reduce the dimensionality of the HoG descriptors be-
fore using the GMM model for classification. One
effective method is Principal Component Analysis.
PCA can be defined as the orthogonal projection of
the data onto a lower dimensional linear space, such
that the variance of the projected data is maximized
(Hotelling, 1933). Because the variance of the data is
maximized, the separation between the points belong-
ing to different classes is preserved as much as possi-
ble. Additionally, the PCA can discard the redundant
HumanBodyOrientationEstimationusingaCommitteebasedApproach
517
and noisy information, thus improve the classification
process.
3.5 Neural Network
The second HoG based classifier to be included in the
committee is a Neural Network (NN). This method
handles the high dimensionality of the data in a more
natural way compared to PCA. The feed forward neu-
ral network can be regarded as an approach to fix the
number of basis functions (represented here by the
individual neurons), but to allow them to be adap-
tive (represented by the connection weights between
the neurons, which can be regarded as parameters
adapted during training). Furthermore, the extraction
of relevant features in the data and the classification
process are merged together. The disadvantage of this
flexibility in automatically adapting the parameters
of the weights to the training data is that the objec-
tive function is no longer a convex function (Bishop,
2007). This translates in a more lengthy training pro-
cess, but the model is fast to process the testing data.
Since the high dimensionality of the data does not
represent an obstacle in implementing the Neural Net-
work classifier, as it was the case for the GMM, all the
HoG features are used. Thus, the considered structure
of the network has 2268 input nodes for the body clas-
sifier.
3.6 SVM
The last HoG based classifiers is Support Vector Ma-
chine. The motivation for this choice is the good per-
formance obtained in various classification tasks, par-
ticularly in object recognition, where features such as
the HoG descriptors are used.
Although at its core the SVM is a 2-class, vari-
ous techniques and algorithms have been developed
for multi-class classification and probability estimates
for each of the classes. For our method, we use the
variant described in (Wu et al., 2004), which allows
multi-class classification with soft assignments (prob-
ability estimates), as it can be integrated seamlessly in
the probabilistic framework previously described.
3.7 Velocity
The velocity direction often represents a cue for the
body orientation. However, two factors affect the pre-
cision of this cue: the inaccuracy of the estimation of
3D position for the targets and the dependency on the
speed of the target. The first disadvantage represents
a limitation of the tracker. The second observation
−3 −2 −1 0 1 2 3
−3
−2
−1
0
1
2
3
Body orientation training data, reduced to 2 dimensions using PCA
class 1
class 2
class 3
class 4
class 5
class 6
class 7
class 8
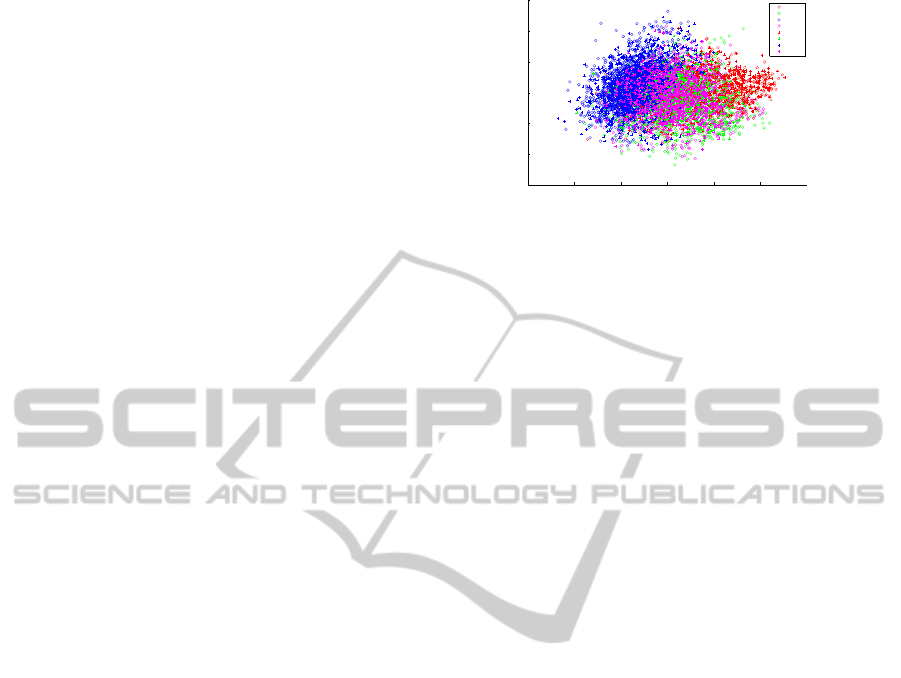
Figure 4: HoG descriptors reduced to 2 dimensions using
PCA, where circles and plus signs indicate the opposite di-
rections.
relies on the assumption that a target with a high ve-
locity has a lower chance of changing its orientation
than one with a low velocity.
To make better use of both velocity direction and
speed, as well as to incorporate this information seam-
lessly into the previously described framework, we
build a pseudo-classifier by defining a Gaussian prob-
ability distribution centered around the angle class
corresponding to the velocity direction and with a
variance inversely proportional to the speed of the tar-
get. For a target moving with high speed, the prob-
ability of the target facing the movement direction
is relatively high, while a near-stationary target will
have a near equal probability for all angle classes, as
the Gaussian with a high variance will be close to an
uniform distribution across all angles.
l
velocity
(x|α) = logP
velocity
(x|α) = logN (α|v
d
,1/v
m
)
(4)
where v
d
and v
m
represent the velocity direction and
magnitude, respectively. N denotes the normal dis-
tribution.
3.8 Face Detection
One inherent limitation of the classifiers based on
HoG descriptors is that, given the relatively low res-
olution of individual targets, the HoG descriptor can
only represent the rough outline of the human body.
This causes a problem, since usually the appearance
of the human body outline is similar for diametrically
opposed angles, as suggested in Figure 4. In such
cases, a strong cue differentiating the two orientations
is the presence of a face.
Face detection can be performed relatively fast,
using for example a cascade Local Binary Pattern
classifier (Liao et al., 2007). Furthermore, this classi-
fier is able to provide information regarding the type
of face detection, i.e. frontal, left-lateral or right-
lateral, further aiding the orientation estimation pro-
cess.
VISAPP2014-InternationalConferenceonComputerVisionTheoryandApplications
518
Given the probabilistic framework described so
far, a reasonable approach to model this information
is by using an uniform probability distribution over
the values of the angle corresponding to the body ori-
entations in which the presence of a face is plausible.
Thus, the associated likelihood becomes:
l
f ace
(x|α) = logP
f ace
(x|α) (5)
P
f ace
(x|α) =
1/5 if f
d
6= 0 and α ∈ {1,5, 6,7,8}
0 if f
d
6= 0 and α ∈ {2,3, 4}
1/8 if f
d
= 0
(6)
Note that, the numerical values of the above equa-
tion correspond to the values of the uniform distribu-
tion. Thus, the first two lines correspond to the situa-
tion in which a face is detected ( f
d
6= 0) and the prob-
ability is uniformly distributed over the 5 angles in
which the face can be visible (first line), and all other
angles have a zero probability (second line). Lastly, if
no face is detected ( f
d
= 0), the probability is evenly
distributed among all angles (as the lack of a face de-
tection does not necessarily imply the absence of a
face in the image).
3.9 Temporal Smoothness
Another cue for the orientation estimation is based
on the observation that human targets do not usu-
ally change their orientation suddenly from frame
to frame, especially considering the fact that frames
succeed themselves at least at 1/24 seconds in most
video sequences. This can be regarded as a temporal
smoothness of the orientation angle.
Thus, to restrict the abrupt changes in estimated
orientation angles, we implement a sliding window
approach in which the final estimated angle is deter-
mined by a majority vote from the angle estimations
of the current frame and the past 5 frames (window
size was determined empirically). If there is a tie be-
tween the angle class estimated for the current frame
and another value, the former will be taken.
4 EXPERIMENTAL RESULTS
The proposed method for orientation estimation has
several hyperparameters which influence the quality
of the classification. These hyperparameters are the
number of dimensions to which the PCA reduces the
HoG descriptors for the GMM, the number of compo-
nents in each GMM, the number of neurons in the hid-
den layer of the Neural Network and the kernel type
used for the SVM.
0
5
10
15
20
25
30
35
40
0
2
4
6
8
10
0.1
0.2
0.3
0.4
0.5
0.6
0.7
0.8
Number of components
Classification error of GMM for various parameter configurations
Number of dimensions
Classification error
0.2
0.3
0.4
0.5
0.6
0.7
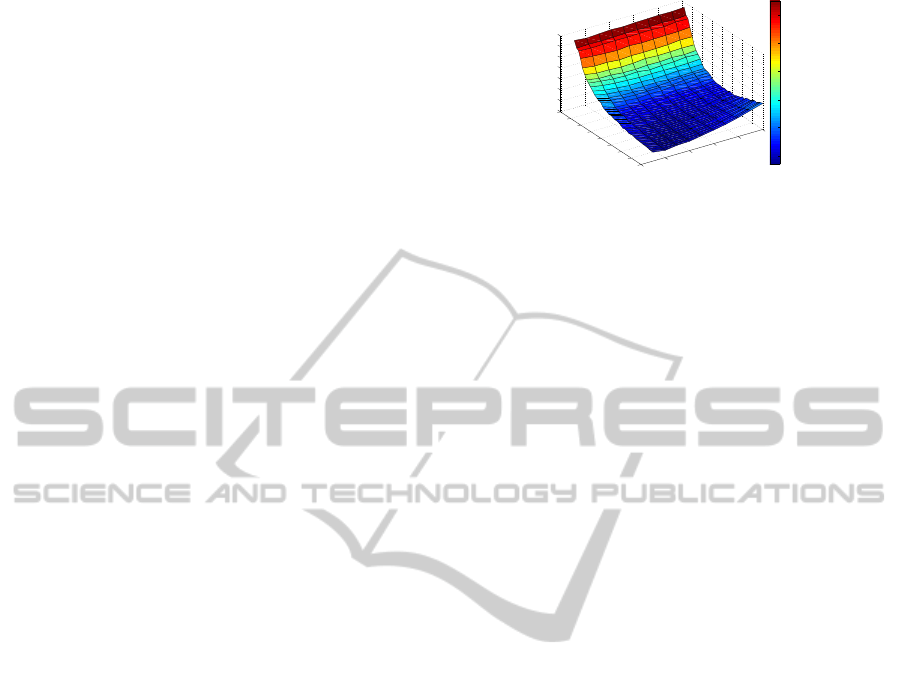
Figure 5: Classification error of the GMM classifier for var-
ious parameter configurations (the number of dimensions
and the number of components), during validation stage.
To determine suitable values for these hyperpa-
rameters, we employ a k-fold cross-validation proce-
dure using the available training dataset. Thus, for
each parameter configuration of a given classifier, its
classification accuracy was computed as an average
over the values obtained by training the classifier with
a fraction of (k − 1)/k of the dataset and estimat-
ing the accuracy on the remaining 1/k fraction of the
dataset. The results of the cross-validation for each of
the classifiers are given in the following paragraphs.
GMM Validation. For determining the hyperpa-
rameters of the GMM classifier, namely the number
of dimensions to which the PCA reduces the HoG de-
scriptors to and the number of components in each
mixture, we employed 4-fold cross validation.
The results of the cross-validation are presented
in Figure 5. It can be observed that for relatively low
numbers of dimensions, the performance of the clas-
sifier is poor, as some information is lost in the dimen-
sionality reduction process, making robust classifica-
tion difficult. The performance improves significantly
after 20 dimensions and it stabilizes between 30 and
40 dimensions, suggesting that the high-dimensional
HoG features lie in a lower, 40 dimensional, manifold.
The number of components in each mixture has
less impact on the performance, when compared to
the number of dimensions. However, the higher er-
ror obtained for a single component indicates that
the data has a more complex structure than a simple
Gaussian distribution, while a high number suggests
overfitting, as the performance drops. The best values
are obtained for 2-3 components per mixture, these
providing the best approximation of the real structure
of the data.
Neural Network Validation. The Neural Network
classifier has a single parameter, namely the number
of neurons in the hidden layer.
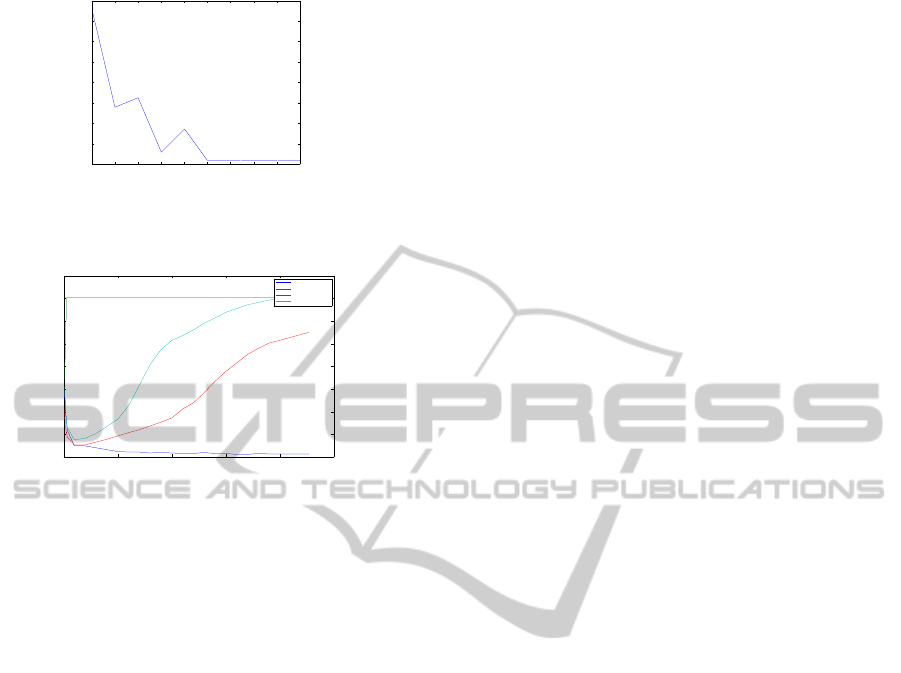
The evolution of the classification error is shown
in Figure 6. The decreasing evolution of the classifi-
cation error stabilized after a value approximately 60
HumanBodyOrientationEstimationusingaCommitteebasedApproach
519
10 20 30 40 50 60 70 80 90 100
0.15
0.16
0.17
0.18
0.19
0.2
0.21
0.22
0.23
Number of neurons in the hidden layer
Classification error
Classification error of the Neural Netork for various sizes of the hidden layer
Figure 6: Classification error of the NN classifier for vari-
ous parameter configurations, during validation stage.
0 500 1000 1500 2000 2500
0.1
0.2
0.3
0.4
0.5
0.6
0.7
0.8
0.9
Dimension count
Classification error
Classification error for the SVM using various kernels and dimensions for the data
linear kernel
polynomial kernel
radial kernel
sigmoid kernel
Figure 7: Classification error of the SVM classifier for var-
ious parameter configurations, during validation stage.
nodes. Although it is impossible to assess the role
of each neuron and thus to provide a solid explana-
tion for the correlation between the number of neu-
rons and performance of the network, one can argue
that this size of the hidden layer is influenced by the
number of relevant features in the data, similarly to
the minimum number of dimensions that yield rea-
sonable good results. Should that be the case, the ac-
tivation of each neuron is more heavily influenced by
one of these implicit relevant features.
SVM Validation. For the SVM classifier, our initial
intention was to also employ dimensionality reduc-
tion on the features, to obtain faster training times.
However, after assessing the performance for various
dimensions, as shown in Figure 7, and considering
manageable training durations, we decided to use all
2268 HoG dimensions for the SVM classifier.
The plot from Figure 7 shows the evolution of the
SVM classification error for various dimensions and
using several kernel functions, where we found that
the best performed kernel is the linear one.
4.1 Dataset Description
During the training of the classifiers we used sev-
eral datasets, to have a greater variety of appearances.
This, in turn, would be beneficial to achieve a bet-
ter generalization of the training data and a good ex-
ploitation of the existing patterns. Some characteris-
tics of the datasets used during training are given in
Table 1.
For testing the proposed method, we used video
sequences from the Collective Activity dataset (Choi
et al., 2011), which depict multiple human targets
moving unrestricted in an urban environment. The
ground truth annotation is available once every 10
frames.
4.2 Results and Discussion
The results of the experiments to evaluate the perfor-
mance of our method are presented in Table 2.
Overall, the performances of the individual clas-
sifiers vary to some extent. These variations ensures
the capability of a combination of classifiers to yield
better results. A certain dependence on the video se-
quence can also be observed, as all the classifiers ob-
tained better results on Seq 42 than Seq 15. Since
these classifiers take into consideration only the vi-
sual appearance of the targets, modeled by the HoG
descriptors, the only explanation for this behaviour is
the fact that the targets from Seq 42 resemble more
closely the targets used for the training of the classi-
fier. This visual resemblance can further be explained
by a closer similarity of the angle of the camera at
which the images were captured, as well as a similar-
ity of the resolution of the images.
The error obtained by combining the response of
multiple classifiers proved to be better than the indi-
vidual responses. Thus, in the case of Seq 42, all the
combined responses yielded better results than the in-
dividual ones. As expected, the combinations includ-
ing the more robust classifiers, such as GMM+NN,
outperform the ones with the lower performing ones,
such as GMM+SVM. In the case of Seq 15, the more
pronounced poor result of the SVM classifier has a
detrimental impact on the combined responses. Thus,
only the GMM+NN combination has a better per-
formance than any of its components, all others be-
ing roughly similar or even worse than the individual
components.
The second goal of these experiments was to as-
sess the impact of the individual cues considered. The
performance of the method when only the velocity is
used, proves to be better than the responses of any of
the individual or combined HoG-based classifiers, for
the considered video sequences Seq 15 and Seq 42,
thus highlighting the importance of this additional
cue. However, one might expect that for more partic-
ular video sequences in which the targets are mostly
stationary, the velocity cue would provide less infor-
mation and thus yield poorer results. The next config-
uration tested was the combination of the response of
VISAPP2014-InternationalConferenceonComputerVisionTheoryandApplications
520

Table 1: Number of data points per class for the datasets used during training.
Dataset Type C1 C2 C3 C4 C5 C6 C7 C8 Total
(M. Andriluka and Schiele.,
2010)
Body 400 749 644 749 400 622 545 622 4731
(Gernimo et al., 2007) Body 129 30 117 78 114 25 141 62 696
MIT Pedestrian Body 0 0 478 0 0 0 446 0 924
VIPeR Body 355 90 218 17 6 31 419 126 1262
Table 2: Mean and standard deviation of the error for various versions of our method on two video sequences from Collective
Activity dataset (Choi et al., 2011).
Method Seq 15 Seq 42
GMM 63.0446/28.1862 65.5102/31.1502
NN 69.7277/30.5169 56.3265/29.4306
SVM 82.2030/33.6133 59.6939/30.1965
GMM+NN 61.7079/ 28.7315 52.6531/28.4356
GMM+SVM 63.0446/28.9955 55.4082/29.1968
NN+SVM 70.6188/31.0409 50.5102/27.5921
GMM+SVM+NN 66.8317/ 30.2219 54.1837/28.8972
GMM+SVM+NN + Velocity 48.3416/24.7429 36.4286/23.2556
GMM+SVM+NN + Face 47.6733/24.8099 59.0816/30.2519
GMM+SVM+NN + Velocity + Face 37.4257/21.1888 42.5510/25.3564
GMM+SVM+NN + Velocity + Face + Temporal 38.9851/22.0431 23.2653/18.9088
the HoG-based classifiers and the velocity cue. A sig-
nificant improvement was observed over the response
of the HoG-based classifiers, for both videos. How-
ever, in the case of Seq 15, where the HoG-based
classifiers yielded poor performance, the overall re-
sult when taking into account the velocity cue was
worse than in the case of using just the velocity. This
was not the case for Seq 42, where the performance
decreased dramatically, the mean error being lower
than either of the constituents’ responses.
Next, the face detection cue was assessed, also
in combination with the response of the HoG-based
classifiers. For Seq 15 the performance improved
in a similar fashion to the velocity cue, suggesting
a similar informational gain. However, in the case
of Seq 42 the performance dropped over one of the
HoG-based classifiers, most probably due to the high
number of false face detections. When combining
the two cues, velocity and face detection, the perfor-
mance increases in the case of Seq 15, where the two
cues taken individually generate similar results, while
in the case of Seq 42, the performance is still lower
than in the case of using just the velocity cue, due to
the poor performance given by the false face detec-
tion.
The last element tested was the effect of the tem-
poral smoothing. When combined with the response
of the HoG-based classifiers, the performance in-
creased, moderately for Seq 15 and more signifi-
cantly for Seq 42. The larger improvement in the
second case can be explained by a higher number of
misclassification, whose influence is reduced. When
combined with only the velocity cue, the performance
drops slightly for the first video, but increases for
the second. This can be explained by a better veloc-
ity estimation in Seq 15, in which case the temporal
smoothing only delays in response. The increase in
the second case is also probably explained by inac-
curate estimations of the velocity. Similar trends are
followed in the last configuration, involving all classi-
fiers and cues, where the temporal smoothness factor
has little influence on the performance from Seq 15,
in which the estimations provided by the classifiers,
the velocity and face detections seem to be more re-
liable. On the other hand, in the case of Seq 42, the
performance increase is significant, as the error drops
to almost half, due to the fact that misclassification,
inexact velocity estimation and false face detections,
are smoothed out.
We have compared our method with the state of
the art method (Chen and Odobez, 2012), and the re-
sults being presented in Table 3. Note that, since the
computation time is proportional to the squared num-
ber of training and testing data points, only a fraction
of the training set was used. For a better compari-
son, the results of our method using the same reduced
training set are also presented.
HumanBodyOrientationEstimationusingaCommitteebasedApproach
521

Table 3: Evaluation of the performance on a video sequence
(Seq 15 from Collective Activity dataset (Choi et al., 2011))
of the original method from (Chen and Odobez, 2012) and
our approach.
Method Error StdDev Average pro-
cessing time
per frame
(ms)
(Chen and
Odobez,
2012)
79.52 30.37 29948
Our approach 56.58 22.73 73
5 CONCLUSIONS
We have proposed a novel method for estimating hu-
man body orientation from a video based on a com-
mittee based approach. One of the benefits of our
method is the faster computation time compared to
the state of the art method (Chen and Odobez, 2012).
Our method also allows for the use of multiple classi-
fiers, their individual responses being combined for a
more robust prediction. Another contribution refers to
the use of additional cues, such as face detections and
temporal smoothness, as well as an improved method
on the use of the velocity cue.
ACKNOWLEDGEMENTS
This research was supported by the FES project
COMMIT/.
REFERENCES
Bishop, C. M. (2007). Pattern recognition and machine
learning (information science and statistics).
Chen, C. and Odobez, J. (2012). We are not contortionists:
coupled adaptive learning for head and body orienta-
tion estimation in surveillance video. In Computer
Vision and Pattern Recognition (CVPR), 2012 IEEE
Conference on, pages 1544–1551. IEEE.
Choi, W., Pantofaru, C., and Savarese, S. (2012). A general
framework for tracking multiple people from a mov-
ing camera. IEEE Trans. on Pattern Analysis and Ma-
chine Intelligence.
Choi, W., Shahid, K., and Savarese, S. (2011). Collective
activity dataset. www.eecs.umich.edu/vision/activity-
dataset.html.
Dalal, N. and Triggs, B. (2005). Histograms of oriented gra-
dients for human detection. In Computer Vision and
Pattern Recognition, 2005. CVPR 2005. IEEE Com-
puter Society Conference on, volume 1, pages 886–
893. IEEE.
Gernimo, D., Sappa, A., Lpez, A., and Ponsa, D. (2007).
Adaptive image sampling and windows classification
for on-board pedestrian detection. International Con-
ference on Computer Vision Systems.
Hotelling, H. (1933). Analysis of a complex of statistical
variables into principal components. Journal of edu-
cational psychology, 24(6):417.
Liao, S., Zhu, X., Lei, Z., Zhang, L., and Li, S. Z. (2007).
Learning multi-scale block local binary patterns for
face recognition. In Advances in Biometrics, pages
828–837. Springer.
Lu, W.-L. and Little, J. J. (2006). Simultaneous tracking
and action recognition using the pca-hog descriptor. In
Computer and Robot Vision, 2006. The 3rd Canadian
Conference on, pages 6–6. IEEE.
M. Andriluka, S. R. and Schiele., B. (2010). Monocular
3d pose estimation and tracking by detection. CVPR,
www.d2.mpi-inf.mpg.de/node/428.
Tosato, D., Spera, M., Cristani, M., and Murino, V. (2012).
Characterizing humans on riemannian manifolds. Pat-
tern Analysis and Machine Intelligence, IEEE Trans-
actions on.
Wang, J. (2011). Geometric structure of high-dimensional
data. In Geometric Structure of High-Dimensional
Data and Dimensionality Reduction, pages 51–77.
Springer.
Wu, T.-F., Lin, C.-J., and Weng, R. C. (2004). Probabil-
ity estimates for multi-class classification by pairwise
coupling. The Journal of Machine Learning Research,
5:975–1005.
VISAPP2014-InternationalConferenceonComputerVisionTheoryandApplications
522
