
Software Feathers
Figurative Visualization of Software Metrics
Fabian Beck
VISUS, University of Stuttgart, Stuttgart, Germany
Keywords:
Software Metrics, Multi-Dimensional Data, Glyph Visualization.
Abstract:
In order to give the code entities of a software system a discernible and recognizable face, this paper presents
Software Feathers, an approach for mapping characteristics of object-oriented code entities to features of ar-
tificially generated feathers. A parameterized drawing algorithm is described that generates pseudo-realistic
feathers as 2D graphics. The parameters of the feathers are connected to characteristic software metrics mea-
suring, among others, the size, complexity, and quality of interfaces and classes. Applying the approach
demonstrates that categories of code entities can be discerned, problems in the code can be detected, and the
evolution of code can be studied. A promising application is embedding the feathers into documentation and
IDEs for improving navigation and unobtrusively educating software developers in software metrics.
1 INTRODUCTION
Besides being represented as source code, the classes
and interfaces of a software system do not have a
natural representation, nothing the developers look at
and instantly say “ah, I remember”. Code entities are
unlike people and people’s faces, unlike places and
representation of these places on maps, unlike tunes
and music: they are lacking features enabling human
viewers to easily recognize them. Source code often
looks uniform and repetitive; it is more predictable
than natural language (Hindle et al., 2012). In order
to improve this issue, the general goal of this paper
is giving source code entities a figurative representa-
tion, something that is recognizable and, in the ideal
case, already tells something about the characteristics
of the represented piece of code—like a person’s face
and look tells something about the individual.
For generating a characteristic figurative repre-
sentation, any shape, metaphor, or object can be
employed—it only needs to have parameters chang-
ing its visual appearance. Then, characteristics of a
data entity can be mapped to the visual parameters
of the glyph, which creates a visualization of the en-
tity. A well-known example are Chernoff faces (Cher-
noff, 1973): they represent a number of properties
in parametrized features of schematic faces like the
size and layout of the eyes, nose, mouth, etc. Though
Chernoff faces are applicable also to software entities,
this work uses a different metaphor that is not already
Figure 1: Visualizing a code entity as a Software Feather.
as overloaded with semantics and context as faces—it
employs feathers. They have the necessary flexibility
for encoding different properties in the size, shape,
and texture producing unique and recognizable visual
representations. Moreover, they have certain aesthet-
ics and, in the eyes of most people, look beautiful.
In the following, I present Software Feathers, an
approach for mapping characteristics of source code
entities to attributes of a feather (Figure 1). The spe-
cific contributions of this paper are
• to describe a simple, parameterized 2D draw-
ing algorithm for the vector-based generation of
feathers (Section 4),
• to design an intuitive mapping from source code
to feathers that embraces main characteristics of
code entities (Section 5), and
• to explore the utility of Software Feathers in dif-
ferent application scenarios (Section 6).
5
Beck F..
Software Feathers - Figurative Visualization of Software Metrics.
DOI: 10.5220/0004650100050016
In Proceedings of the 5th International Conference on Information Visualization Theory and Applications (IVAPP-2014), pages 5-16
ISBN: 978-989-758-005-5
Copyright
c
2014 SCITEPRESS (Science and Technology Publications, Lda.)

2 VISUALIZATION OF
SOFTWARE METRICS
The figurative representation of software entities as
feathers is a form of multivariate data visualiza-
tion (Chan, 2006; Wong and Bergeron, 1997): ob-
jects having multiple attributes are depicted. More
specifically, it is a glyph-based visualization tech-
nique (Borgo et al., 2013; Ward, 2008) related to oth-
ers approaches such as star plots and similar tech-
niques (Draper et al., 2009), which use multiple axes
in a radial coordinate system, stick figures (Pickett and
Grinstein, 1988), which encode multivariate data in
the angle of sticks, or shape coding (Beddow, 1990),
which represents multiple attributes as subcells of a
data matrix. While these approaches map attributes
to abstract visual properties of general shapes, the
feathers approach is even more similar to more fig-
urative techniques like the already referenced Cher-
noff faces (Chernoff, 1973). Also exploiting biolog-
ical metaphors, for instance, Chau (2011) visualizes
properties of web search results as schematic flowers
or Nocke et al. (2005) propose corn cobs for depicting
maize harvest data. However, it seems that feathers,
so far, have not been used for encoding multivariate
data.
Numeric properties of software entities are de-
scribed by software metrics, for instance, object-
oriented metrics (Chidamber and Kemerer, 1994),
measures of code complexity (McCabe, 1976), or
coupling and cohesion metrics (Briand et al., 1998,
1999). Multivariate data visualization has already
been applied to software metrics: in Polymetric
Views, Lanza and Ducasse (2003) propose to map
up to five metrics to the size, color, and position
of rectangular representations of code entities; while
Polymetric Views already integrates inheritance rela-
tionships, Erdemir et al. (2011) extend the approach
to further visual parameters and different types of
links. Software metrics are also applied to visualizing
the evolution of software. For instance, the Evolu-
tion Matrix approach (Lanza, 2001) organizes simple
glyphs representing multiple code entities in a grid
so that time is represented based on small multiples
from left to right. Pinzger et al. (2005) integrates the
time dimension into the single glyphs using star plots.
Chuah and Eick (1998) propose other representations
for visualizing the evolution of multiple software met-
rics in single glyphs, including wheel-like representa-
tions and diagrams having some visual similarity to
bugs.
There also exist figurative, metaphorical visual-
izations of software metrics. Graham et al. (2004)
applied a solar systems metaphor to software systems
where code entities are represented as planets encod-
ing software metrics in the planets’ size and color. A
very popular metaphor among researchers is depict-
ing software systems as cities where stylized build-
ings usually represent the code entities of the sys-
tem (Alam and Dugerdil, 2007; Knight and Munro,
1999; Steinbr
¨
uckner and Lewerentz, 2013; Wettel and
Lanza, 2008). While some approaches work with
quite realistic representations of houses (Alam and
Dugerdil, 2007; Knight and Munro, 1999), abstract
cuboids or cylinders as employed by others may al-
ready be sufficient for encoding various metrics (Wet-
tel and Lanza, 2008; Steinbr
¨
uckner and Lewerentz,
2013). Software cities can also be used for study-
ing the evolution of software systems: the layout of
the city needs to be stabilized when showing one ver-
sion after the other and buildings can be subdivided
for providing information on the evolution of the sys-
tem (Wettel and Lanza, 2008; Steinbr
¨
uckner and Lew-
erentz, 2013).
It is further possible to visualize code entities as a
summary of their contained source code, for instance,
by plotting the pretty printed code in small font into
small stripes (DeLine et al., 2006). While this ap-
proach only applies geometric zooming to the code,
a higher level of aggregation is reached by summa-
rizing each line of code as a line of pixels or even
only a single pixel as demonstrated by Seesoft (Eick
et al., 1992); encoding characteristics of the lines in
the color of the representing pixels creates an im-
age for each code entity. Increasing the level of ab-
straction, small color-coded blocks representing fields
and methods provide a quick preview of code entities
only requiring small amounts of screen space (Biegel
et al., 2012). In Class Blueprints (Ducasse and Lanza,
2005), small rectangles representing fields and meth-
ods are visually arranged by categories and connected
with dependencies; this enables the identification of
categories of code entities.
3 MOTIVATION
Regarding the set of existing approaches to visualize
software metrics, a legitimate question is why there
is a need for yet another technique. To answer this
question—hence, to motivate the approach—I want
first point out some issues that are problematic when
using software metrics in practice.
1. A single metric is only able to show parts of the
picture: A single value representing a software
entity only reflects a single characteristic of the
entity. Multiple metrics need to be combined to
provide a more comprehensive picture.
IVAPP2014-InternationalConferenceonInformationVisualizationTheoryandApplications
6

2. Software metrics hold the danger to be over-
interpreted and misused: Metrics as numeric
measures seem to be objective, but interpreting
the values is difficult and subjective. It is partic-
ularly dangerous to reason only with metrics, for
instance, to judge the productivity of a developer
in number of changed lines.
3. Analyzing software metrics is not an end in itself:
Software metrics are used in different applications
such as detecting low quality code, finding design
weaknesses, or estimating work progress. What
is a good visualization of software metrics largely
depends on the application.
The first observation implies that a visualization of
software metrics should always present multiple met-
rics at the same time; using a glyph-based technique
particularly addresses this issue. Further, taking soft-
ware metrics not too serious and introducing a playful
approach conforms to the second issue—it might pre-
vent from over-interpretation. But most distinguish-
ing feature of the Software Feathers approach is that it
proposes a new application of software metrics, which
has, according to the third observation, new require-
ments for the visualization: figurative visual represen-
tations of software entities are be generated to literally
give the invisible software entities a face.
When integrated into documentation or IDEs,
the figurative representation may support the process
of visually seeking for specific entities; since large
amounts of development time are spent on naviga-
tion and visual searches (Ko et al., 2006), the im-
pact of an improved navigation process should not
be underestimated. Beyond that, Software Feathers
also provide an unobtrusive way of depicting software
metrics in a compact and accessible representation,
which can be used for understanding and analyzing
a software system. Seeing complexity and low code
quality reflected in the feathers, developers might be
motivated to ‘improve’ the feather by optimizing the
code, which introduces an aspect of gamification into
software development (Passos et al., 2011; Singer and
Schneider, 2012).
For creating figurative representation of code en-
tities, using feathers as a metaphor is just one of
many possible solutions; for instance, applicable as
well are other natural objects such as flowers, faces,
and mountains, or artificial objects such as buildings,
cities, and machines. Even, feathers do not share
any obvious attributes with code entities. But still
I believe, that, if not the only, feathers are a good
metaphor to represent software entities for several
reasons: first, feathers have the necessary flexibility
for encoding multiple metrics; second, a certain intu-
ition is connected to different features of the feather
such as size, shape, and condition of a feather; and
last but not least, feathers are beautiful and pleasant
to look at.
Hence, the Software Feathers approach is not just
another visualization of software metrics and does not
directly compete with previous approaches. Software
Feathers rather introduce a new perspective on how
to leverage software metrics for a different purpose in
practice. The primary goal of the approach is to create
recognizable aesthetic visual representations of code
entities. In contrast to other visualization techniques,
readability, clarity, and accuracy are only considered
secondary design goals.
4 PARAMETERIZED DRAWING
OF FEATHERS
The realistic drawing and rendering of feathers has
been already investigated as a problem of computer
graphics: Streit and Heidrich (2002) as well as Franco
and Walter (2001) describe detailed 2D models based
on B
´
ezier curves for generating biologically plausi-
ble feathers, having similar parameters than those dis-
cussed in the following; textures of real feathers are
used for coloring the surfaces. Chen et al. (2002) in-
troduce an advanced approach modeling feathers as
an L-System (i.e., a formal grammar for branching
structures). They accurately simulate the fine-grained
structure of feathers and capture it in a texture func-
tion; also semi-automatically building a coat of feath-
ers is discussed.
While these approaches focus on the realistic ren-
dering of feathers, this work uses feathers just as a
vehicle for encoding information. This requires only
an approach having a few simple parameters that de-
termine the appearance of the feather, but there is
no need for perfect realism. The approach presented
in the following is only based on simple 2D vector
graphics and does not involve any 3D rendering. In-
stead of using scanned textures or texture functions
for rendering, feathers are rendered at full detail, in-
cluding all perceivable structures of feathers.
4.1 Anatomy of a Feather
According to biologists (Podulka et al., 2004; Lucas
and Stettenheim, 1972) and as illustrated in Figure 2,
a feather consists of the thin shaft in the middle and
two flat vanes attached left and right of the shaft. The
first part of the shaft, which does not have any vanes
attached, is called calamus; the remainder with at-
tached vanes is referred to as rachis. The vanes are
not solid, but are composed of many parallel barbs
SoftwareFeathers-FigurativeVisualizationofSoftwareMetrics
7
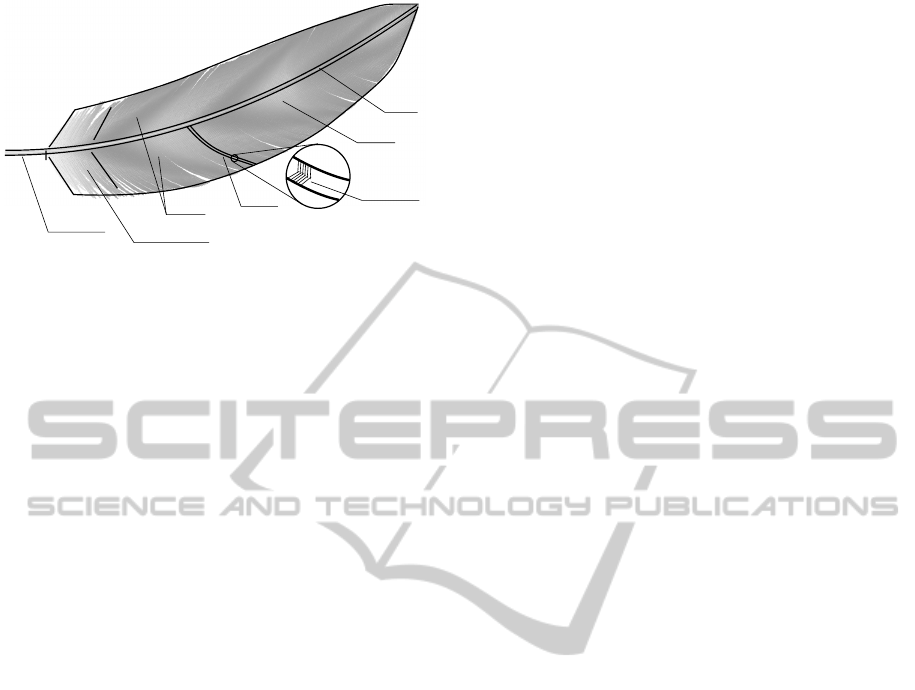
rachis
barbules
barbs
calamus
vanes
afterfeather
shaft
Figure 2: Anatomy of a contour feather.
branching from the rachis. While the downy part
of the vanes near the calamus consists of soft barbs
and constitutes the afterfeather, the remainder of the
vanes is stiffer and the barbs agglutinate: the reason
is that tiny barbules having hooklets (not illustrated)
at their tips branch from the barbs; the barbules of
neighboring barbs partly overlap and stick together.
The feather shown in Figure 2 depicts a typical con-
tour feather, an outermost feather being part of the
visible coat: it is smoother than a flight feather and
the additional afterfeather keeps the bird warm.
4.2 Drawing Algorithm
The drawing algorithm largely follows the biological
model: all described parts are directly rendered ex-
cept for the tiny hooklets, which are anyway invisible
to the human eye. Central component for generating
the feathers are simple polylines with varying strength
and color—the shaft, the barbs, as well as the bar-
bules are drawn as such lines. The bended shaft of the
feather is simplified somewhat in comparison to the
biological model: the curve follows a simple cubic
parabola and and its strength only decreases linearly
from the tip to the end. Analogously, the curvatures
of the barbs are defined by parabolas and their outer
ends become smaller.
The general contour of the feather mainly depends
on the length and orientation of the barbs. The barbs
start with a short initial length at the inner end of the
rachis, quickly increase in length asymptotically ap-
proaching a maximum length, and finally get shorter
again at the outer end of the feather. The barbs do
not branch in a right angle from the rachis, but point
towards the outer end of the feather with a certain de-
fault branching angle. Additionally, the barbs bend in
the same direction, which further increases this effect.
This layout of the barbs creates the typical contour of
a feather. Maximum length of the barbs and their de-
fault angle can be different for the two vanes. Bar-
bules become shorter towards the boundaries of the
feather.
For a realistic impression of a feather, however,
further details need to be considered: One effect in
reality is that the vanes occasionally have gaps where
barbs were separated by some force (e.g., wind).
The drawing algorithm simulates these gaps by vary-
ing the branching angle of the barbs for differently
sized sequences of neighboring barbs—thereby sticky
blocks of barbs are created. Additionally, the branch-
ing angle is slightly varied continuously following a
sinus curve with varying wave length; this models the
tiny waves that the vanes would form in 3D. For gen-
erating the downy afterfeather, branching angles of
barbs and barbules are varied randomly (within cer-
tain boundaries) and independently of the neighbor-
ing barbs and barbules as downy barbs do not stick
together. Moreover, barbules of downy barbs are
longer. Implementing a smooth transition between af-
terfeather and the main feather, a parameter continu-
ously reduces the influence of the random angles and
longer barbules.
Finally, the colors of the polylines need to be spec-
ified. Different species of birds show a wide variety of
patterns ranging from monochrome feathers to multi-
color, complex patterns. The texture applied here has
a medium complexity and consists of two colors. As
already discussed, the colors are not retrieved from
pixel-based textures but are computed algorithmically
based on the role and position of the polyline in the
feather. The barbules create the main color impres-
sion of a feather. The specific color is determined by
a sinus function defined on the position of the bar-
bule (i.e., the relative position of the barb on the shaft
and the relative position of the barbule on the barb)
specifying the mixing proportion of the two colors. In
order to create an ‘eye’ that some birds have in their
feathers (e.g., peafowls), an elliptic area with smooth
borders at the outer end of the feather is filled with a
different two-color texture. To simulate some irreg-
ularities in the feather, the brightness of the barbules
is varied randomly to a small extent. Barbules of the
afterfeather are brighter in general.
4.3 Parameters
The described drawing algorithm has many param-
eters that need to be set: length attributes, line
strengths, branching angles, curvatures, colors, influ-
ence of random factors, frequencies of sinus curves,
etc. Arbitrarily varying these parameters creates a
large variety of feathers, however, not all looking like
natural feathers but becoming degenerated. In order
to allow the generation of diverse, but realistic feath-
IVAPP2014-InternationalConferenceonInformationVisualizationTheoryandApplications
8
ers, only a set of particularly characteristic parameters
are proposed for variation; they can be safely modi-
fied within boundaries without producing degenerated
feathers. As kinds of visual dimensions, these param-
eters form the basis for the later encoding of informa-
tion into the feathers.
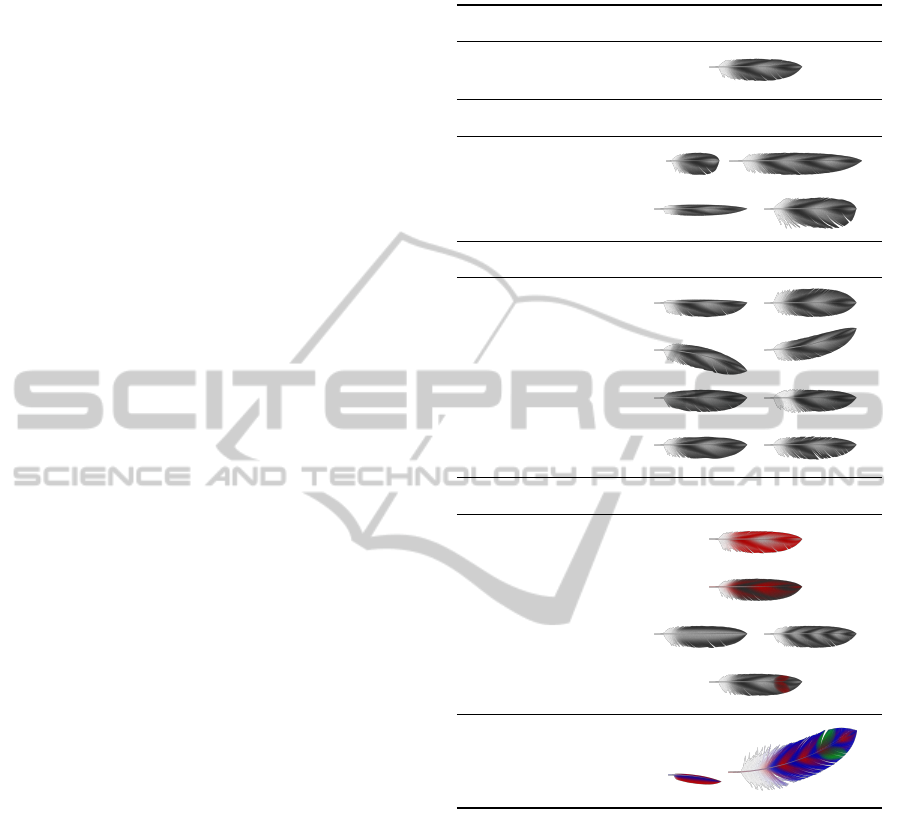
Table 1 illustrates the effect of each parameter in-
dividually. The first image, where all numeric param-
eters are set to a medium value, depicts the starting
point for parameter variation. Most of the numeric pa-
rameters are normalized to the range of [0, 1], which
is mapped to reasonable boundaries of the specific
parameters in the drawing algorithm; the boundaries
were determined by experiment. Each row of the table
shows the respective feather when using the minimum
and maximum value of a parameter. Additionally, the
last two images provide examples for extreme param-
eter settings in order to show that the created feathers
in general do not become degenerated.
Size A pronounced feature of a feather is of course its
size, which can be divided in the length of the shaft
and the length of the barbs. While a long shaft and
short barbs lead to feathers having a thin and pointed
contour, long barbs and a short shaft create a corpu-
lent silhouette.
Shape As a first parameter changing the shape of the
feather, the symmetry of the feather can be adapted:
for an asymmetric feather, the barbs of the left (outer)
vane are shorter than for the right (inner) vane. Fur-
ther, controlling the curvature of the shaft, the com-
plete feather becomes bended; since bends in both di-
rections are possible, this is a parameter with a range
of [−1, 1]. Finally, smaller adaption of the shape are
the size of afterfeather, which controls the downy end
of the feather, and the degree of damage, which spec-
ifies the number and severity of gaps in the vanes.
Texture For the texture, it is possible to set a base
color, which is used for the outer barbules and parts
of the inner barbules, and a highlight color, which is
only used for remaining inner barbules. Not connect-
ing colors to a color-scale, the color parameters are
categorical. However, the frequency of the periodic
pattern can be varied as a numeric parameter. Further,
a secondary texture might be specified, which recur-
sively takes another texture having a base and high-
light color as well as a frequency for coloring a part
of the outer end of the feather. This parameter can be
used for referencing the texture of other feathers.
Other parameters could have been varied as well,
such as the length of the calamus, the thickness of
the shaft, the density and angle of barbs and barbules,
the algorithmic pattern of the texture—just to give a
Table 1: Visual parameters of a generated feather.
parameter type example
default
size
shaft length
number
[0, 1]
barb length
number
[0, 1]
shape
symmetry
number
[0, 1]
curvature
number
[−1, 1]
size of
afterfeather
number
[0, 1]
damage
number
[0, 1]
texture
base color category
highlight
color category
pattern
frequency
number
[0, 1]
secondary
texture reference
extremes
few examples. However, modifying these does not
change the overall appearance of the feather, may de-
stroy parts of its natural look, or is hard to be con-
nected with an intuition. As a consequence, these pa-
rameters do not undergo changes in the following but
are set to reasonable default values also retrieved by
experimenting with the visualization.
4.4 Implementation
The drawing algorithm was implemented in Java us-
ing the processing graphics library with its Java2D
renderer. In contrast to the approach of Streit and
Heidrich (2002), the presented model also draws bar-
bules and does not need to work with pixel-based
textures. As a consequence, very many 2D lines
need to be drawn for each feather: the particular
SoftwareFeathers-FigurativeVisualizationofSoftwareMetrics
9

feathers depicted in Table 1 consist each of 102,468
(small extreme feather) to 1,142,484 lines (large ex-
treme feather). Rendering these on a Intel i5 proces-
sor (not on graphics hardware) in 960x800 resolution
takes less than 550 ms per feather—too slow for an-
imated real-time renderings but fast enough for gen-
erating feathers on demand in an interactive system.
However, porting the implementation to hardware-
accelerated graphics may speed up rendering and al-
low animated feathers.
5 SOFTWARE FEATHERS
So far, a parameterized algorithm for drawing feathers
has been described. Now, mapping characteristics of
code entities to the parameters transforms the drawing
approach into an information visualization technique.
As the targeted level of granularity, classes and in-
terfaces of object-oriented systems are considered to
constitute the set of code entities—they form the main
abstraction of a system and are largely self-contained
units of design. While arbitrary mappings of code
characteristics and feather parameters are possible, in-
tuitive connections, which are tried to be found and
motivated in the following, make the feathers ‘read-
able’. Figure 3 provides a labeled example of a Soft-
ware Feather depicting the class SDIApplication of
JHotDraw 7.6; it is a class for handling single docu-
ment interface (SDI) applications.
5.1 Metrics and Visual Mapping
As a prerequisite for creating feathers reflecting the
nature of classes and interfaces, characteristic features
of these code entities need to be identified. While
countless software metrics have already been pro-
posed, the challenge is selecting a small subset of
these covering different aspects of the entities, which
are literally painting representative pictures. What is
more, the mapping between code properties and visu-
alization needs to be intuitive. For example, it is more
sensible to represent the size of an entity in the size of
a feather than in its damage. Due to the sheer amount
of possibilities for selecting and mapping metrics, the
following design decisions are arbitrary to some ex-
tent, but try to use the provided degrees of freedom
in a reasonable way. It still can be argued that other
metrics and mappings might better serve a specific
purpose and should be applied instead. An important
point, however, is that the mapping should be stable,
that is, it should not be changed during the course of
usage: viewers are enabled to learn reading the feath-
Table 2: Mapping of software metrics to feather parameters.
software metric feather parameter mapping function
identity highlight color random (hash code)
package base color random (hash code)
interface or class symmetry categorical (0.2; 0.8)
#methods shaft length
asymptotic
(a = 1.15)
avg. NCSS per
method barb length
asymptotic
(a = 1.15)
inheritance secondary texture reference
dependency
difference (out - in) curvature asymptotic (a = 1.1)
percentage of hidden
methods size of afterfeather –
max. cyclomatic
complexity texture frequency
asymptotic
(a = 1.05)
avg. #Checkstyle
errors per method damage
asymptotic
(a = 1.15)
ers and code entities become recognizable through
their figurative representation.
The specific mapping proposed in this paper is in-
troduced below and summarized in Table 2. As dis-
cussed, parameters of the feather are only modified
within the boundaries illustrated in Table 1. To pre-
vent outliers from dominating the visual appearance
of the feathers, a non-linear mapping asymptotically
approaching 1 is applied if the metric is not already
normalized. In particular, an exponential function is
used for mapping a non-negative value x to the inter-
val [0, 1]:
f (x) = 1 − a
−x
.
The base a > 1 thereby serves as a parameter for con-
trolling the rate of increase. Experimentally derived
configurations for a are also reported in Table 2 where
applicable.
Identity Although it might appear trivial, the iden-
tity provided by the unique identifier of the code enti-
ties (i.e., the package name together with the name of
the entity) should be considered for creating unique
and recognizable images. Since class and package
names do not have a natural order, they are best en-
coded in categorical parameters such as colors. In
particular, the visually stronger base color is used for
encoding the package name and the highlight color
is representing the class name. Color assignments to
names are random, but based on hash codes of the
names; this warrants that the same entities are always
assigned the same colors, for instance, when rerun-
ning the algorithm. In Figure 3, the dark blue base
IVAPP2014-InternationalConferenceonInformationVisualizationTheoryandApplications
10
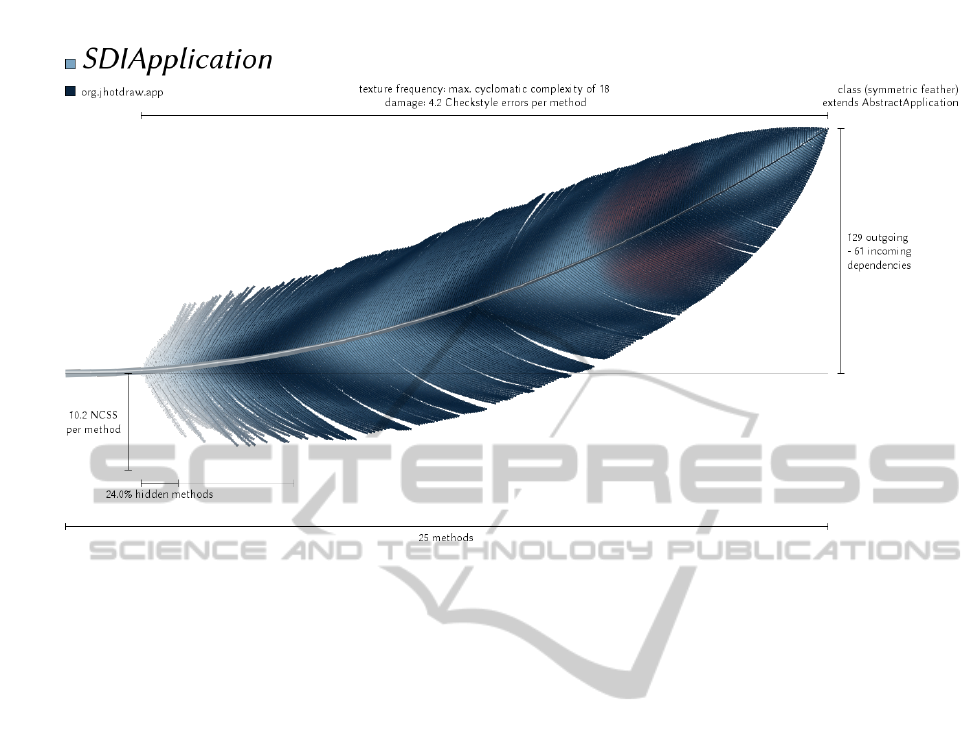
Figure 3: Labeled Software Feather representing the class SDIApplication of JHotDraw 7.6.
color encodes the package org.jhotdraw.app and
the brighter blue highlight color represents the class
SDIApplication.
Type For understanding the purpose of a code entity,
one needs to discern whether it is an interface or class.
This categorical information is mapped to the symme-
try of the feather. Since the symmetry was introduced
as a numeric parameter, the two categories have to
be mapped to numeric values (here, 0.2 and 0.8) for
visualization—the asymmetric configuration thereby
represents an interface while the symmetric one iden-
tifies classes. The intuition behind this selection is
that interfaces can be considered as asymmetric be-
cause they only declare methods without implement-
ing them. As the feather is symmetric, Figure 3 de-
picts a class.
Size The size of an entity provides a first impres-
sion of its content and can be best depicted in the
size of the feather. Instead of counting lines of code,
the number of non-commenting source statements
(NCSS) may provide a more appropriate size esti-
mate. From an object-oriented perspective, also the
number of methods is an interesting measure of size.
While the number of methods is directly mapped to
the length of the shaft of the feather, NCSS is di-
vided by the number of methods and assigned to the
length of the barbs. The normalization of NCSS pre-
vents from encoding the total length of the source
code twice, once in the number of methods and
once in NCSS. With 25 methods and 10.2 NCCS per
method, SDIApplication as depicted in Figure 3 has
a medium size.
Design Diving somewhat deeper into the design of a
code entity, the feather also encodes information on
dependencies and visibility of methods. As a spe-
cial form of dependency, inheritance connections are
prominently encoded by referencing the texture of the
inherited code entity as the secondary texture. Aggre-
gating the other dependency information, the differ-
ence in number of incoming and outgoing dependen-
cies of a code entity is mapped to the curvature of the
feather; the negative or positive results are mapped
to the interval [−1, 1] using an analogous asymptotic
mapping function as before, however, preserving the
sign of the value. This mapping provides an overall
impression of the role of the code entity in the depen-
dency graph of the system. The percentage of hidden
methods (visibility modifiers private or protected)
is encoded in the size of the afterfeather; since this
percentage value is already normalized to the inter-
val [0, 1], applying a mapping function is not nec-
essary. Class SDIApplication in Figure 3 inher-
its class AbstractApplication identified by the red
‘eye’; pointing upwards, the class has much more out-
going than incoming dependencies; the small size of
the afterfeather indicates that only some methods are
declared private or protected.
SoftwareFeathers-FigurativeVisualizationofSoftwareMetrics
11
Quality Finally, some quality attributes of the code
entities should be considered: On the one hand, the
complexity of a code entity is taken into account,
here, measured as the maximum McCabe’s cyclo-
matic complexity (McCabe, 1976) of all contained
methods. It is mapped to the complexity of the tex-
ture, that is the frequency of color changes. On
the other hand, conformity to coding standards is
checked and reported in form of the number of vio-
lations/errors that the Checkstyle
1
tool finds apply-
ing the standard Java conventions. Mapping these
in relation to the size of the entity (here, the num-
ber of methods) to the damage of the feather pro-
vides an impression of potential coding problems in
the code entity. The feather in Figure 3 shows that
class SDIApplication has a quite high maximum
complexity and contains a number of coding issues.
5.2 Implementation
While the underlying Software Feathers approach can
be applied to any object-oriented system, the imple-
mentation focuses on Java systems. Several libraries
are used for retrieving the required code metrics: Ja-
vaNCSS
2
for the NCSS metric and the cyclomatic
complexity, DependencyFinder
3
for the number of in-
coming and outgoing dependencies, and Checkstyle
for the number of coding standard violations. An ad-
ditional code processor retrieves inheritance, the type
(class or interface) of a code entity, and the number of
(hidden) methods.
Since it might be bothering to learn the mapping
from a textual description or a table, a labeling algo-
rithm was implemented and already used for creating
the labels in Figure 3. Labels also provide the precise
numbers of the metrics. The goal for labeling was to
present the required information close to the feather.
While this was possible for some of the labels, other
information such as colors, symmetry, and inheritance
is only provided as a legend at the top because these
attributes globally apply to the complete feather.
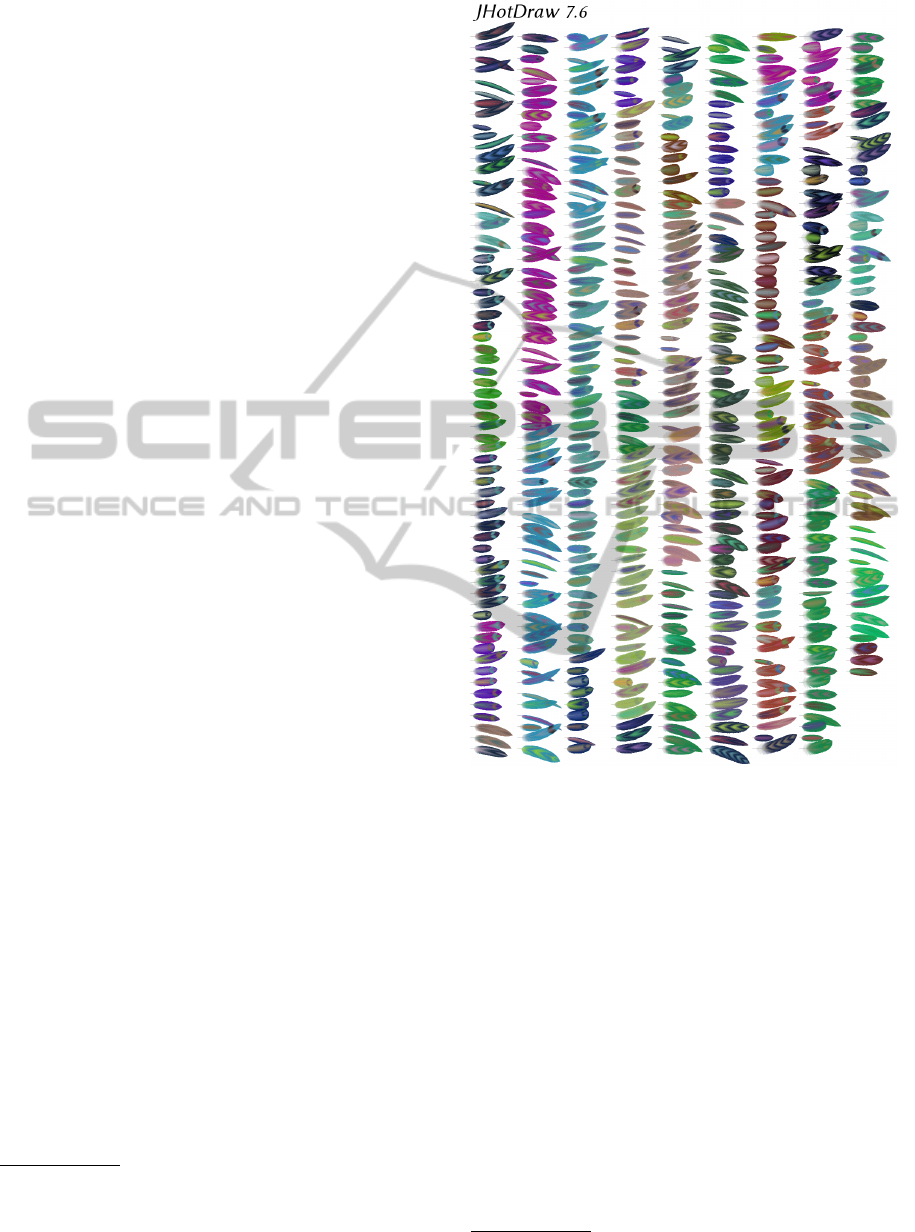
6 APPLICATION
To test the utility of Software Feathers and to discuss
possible application scenarios, the approach is ap-
plied to visualizing JHotDraw
4
, an open-source Java
1
http://checkstyle.sourceforge.net/
2
http://www.kclee.de/clemens/java/javancss/
3
http://depfind.sourceforge.net/
4
http://www.jhotdraw.org/
Figure 4: All code entities of JHotDraw 7.6.
graphics framework. As JHotDraw was also imple-
mented to provide an example of a well-designed
software, it often acts as a kind of benchmark for
software engineering approaches. By depicting the
code entities as Software Feathers, Figure 4 provides
an overview on the complete project in version 7.6,
which includes 578 classes and interfaces (ignoring
inner classes, anonymous classes, code entities with-
out methods, and external library code). The enti-
ties are arranged in columns and ordered lexicograph-
ically by their fully qualified name from top to bottom
and from left to right. Larger, labeled versions of all
feathers are available online
5
.
5
http://softwarefeathers.fbeck.com
IVAPP2014-InternationalConferenceonInformationVisualizationTheoryandApplications
12
6.1 Recognizability of Feathers
Visually comparing the feathers of Figure 4 to each
other, it is possible to discern individual feathers. De-
spite the large amount of listed feathers, it is even
possible to recognize individual ones. Of course, it
neither can be expected that users learn all more than
500 feathers nor that certain similar feathers are not
mistaken one for the other. But considering that soft-
ware engineers usually focus their current work on
smaller subsets of entities, the discernibility of feath-
ers probably is good enough. Moreover, similarity is
intended if the code entities share certain characteris-
tics. For instance, judging by the base color, it is pos-
sible to easily retrieve the neighboring feathers that
belong to the same package. Further similarities can
be retrieved analogously by looking for similar size,
shape, or texture. Ordering feathers by package as
done in Figure 4 shows that often code entities with
similar characteristics are contained in the same pack-
age. Literally, code entities—not birds—of a feather
flock together.
6.2 Categories of Feathers
Investigating the similarities of feathers in greater de-
tail, code entities are classified into different cate-
gories that can be easily discerned by briefly looking
at the feathers. These categories of classes and inter-
faces are somewhat similar as those discussed for the
Class Blueprint approach (Ducasse and Lanza, 2005);
those, however, investigate a much more fine-grained
level of detail.
Central Class Classes control-
ling and implementing essential
parts of the system form the cen-
tral classes of the system. They
usually consist of many func-
tions (long shaft) having a reasonable length (high
length of barbs) and complexity (high texture fre-
quency); since they control the system, they have
more outgoing than incoming dependencies (up-
ward curvature). The depicted example shows the
OSXApplication class, which combines multiple
views as a Mac OS X application.
Important Interface In general,
interfaces can be discerned from
classes easily because of their
asymmetric contour. By defini-
tion, they contain only method
declarations, which results in short barbs and low tex-
ture frequency. Interfaces of particular importance
might be those declaring many methods (long shaft)
used by many other code entities (downward curva-
ture). Abstract classes only implementing a few meth-
ods but declaring many others might also play a simi-
lar role and show similar, but symmetric feathers. The
depicted example shows the View interface, which
defines the central interface of a view in the GUI of
JHotDraw.
Data Class The data that is pro-
cessed by a software is often
stored in member variables of
dedicated data classes. Follow-
ing the the best practices of Java
programming, the visibility of the member variables
are set to private and the data is accessed through
getter and setter methods. As a consequence, data
classes have a low complexity (low texture frequency)
and a reasonable number of short methods (long shaft,
short barbs). Moreover, being used by many other
classes of the system, data classes often have more in-
coming than outgoing dependencies (downward cur-
vature). The depicted example shows the Polygon2D
class which stores the data of a two-dimensional poly-
gon and provides accessors for the data.
Implementation Detail Com-
plex implementation details are
often hidden in classes consist-
ing of a number of complex and
long private methods (high tex-
ture frequency, long barbs, long afterfeather). More-
over, the respective class is likely to be more ac-
cessed by other classes than relying on functional-
ity of others (downward curvature), which discerns it
from a central class. The depicted example shows the
ColorSliderUI class implementing the details of a
color slider component.
Concretization Working with inheri-
tance, a form of generalization is intro-
duced. The inheriting classes or inter-
faces concretize the general one (sec-
ondary texture) often by only overrid-
ing or implementing only a few methods (short
shaft) with limited complexity (low texture fre-
quency) and length (short barbs). These concretiza-
tion classes, hence, can be identified by looking for
small feathers with a plain main texture but a spot
with a secondary texture. The depicted example
shows the CloseFileAction class, which extends
the AbstractSaveUnsavedChangesAction class by
overriding the constructor and implementing a single
method for performing the respective action.
However, in practice, many code entities cannot
unambiguously assigned to a single category but form
SoftwareFeathers-FigurativeVisualizationofSoftwareMetrics
13
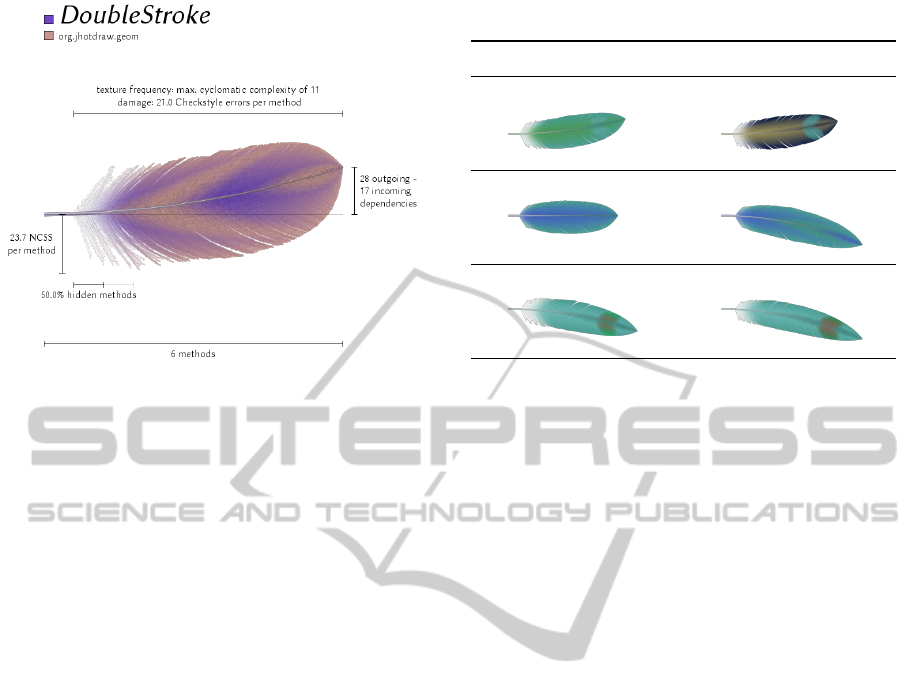
Figure 5: Class DoubleStroke of JHotdraw 7.6 possibly
containing coding problems.
a mixture of multiple categories. Nevertheless, the
visualization is capable of reflecting these combina-
tions as the feather also becomes a mixture of the de-
scribed feathers representing the categories. Further,
the introduced categories may act as a dictionary for
translating feathers into the language of software en-
gineers. Like ornithologists certainly are able to di-
rectly discern a feather of an owl from a feather of an
eagle, users of Software Feathers might quickly learn
to read the main characteristics or category of a code
entity from the respective feather.
6.3 Coding Issues
Besides discerning categories of code entities, Soft-
ware Feathers might also support finding problems in
the code, so called bad smells (Fowler et al., 1999).
Potential issues that can be detected are long methods
(long barbs, high texture frequency) and large classes
(long shaft). Also pure data classes as described
above can be considered as code smells (Fowler et al.,
1999). Further, the damage of the feather visual-
izes the violation of coding standards, which is an-
other unwanted property of the code. The class
DoubleStroke as depicted in Figure 5 provides an
example for a class that might be worth revising: it
has long methods, many Checkstyle errors, and a con-
siderable complexity.
6.4 Evolution of Code Entities
Software Feathers, as compact representations of
code entities, are further applicable to comparing
multiple revisions of the same entities. Table 3 pro-
vides a few examples comparing entities from JHot-
Table 3: Evolution of code entities.
JHotDraw 7.0.6 JHotDraw 7.6
ClearRecentFilesAction ClearRecentFilesMenuAction
ColorIcon
AbstractApplicationAction
Draw version 7.0.6 to version 7.6. Since JHotDraw
7.0 is a complete reimplementation of previous ver-
sions, still many things changed from the early ver-
sion 7.0.6 to the current version 7.6. As a conse-
quence, many files were added or moved during this
time. For instance, class ClearRecentFileAction
became ClearRecentFilesMenuAction—the feath-
ers as depicted in Figure 3, however, show that the
characteristics of the file did not change much in gen-
eral, but that the class was also moved to a different
package (change of base color). Other code entities
such as the ColorIcon class changed some charac-
teristics but not their name or location. Only a few
entities stayed largely unchanged as, for instance, the
AbstractApplicationAction class.
Beyond performing pairwise comparisons, Soft-
ware Feathers can easily be used for representing
more versions of an entity on a timeline or for
showing the evolution of a small sets of entities in
a table like proposed by Evolution Matrix (Lanza,
2001). Continuously interpolating the parameters of
the feathers from one version to the other, it is as well
possible to produce animatedly evolving feathers.
6.5 An Integrated Application Scenario
As demonstrated above, working with Software
Feathers as a standalone approach provides the means
for getting an overview and a rough understanding
of an unfamiliar project. Software developers hav-
ing already a deeper knowledge of a system can profit
from the visualization by finding coding issues and
unexpected properties. Nevertheless, treating Soft-
ware Feathers as a standalone approach leverages
only parts of its potential utility. In particular, con-
sidering that a small version of a feather may act as
an icon or thumbnail representing a code entity, fur-
ther areas of application become apparent: Software
IVAPP2014-InternationalConferenceonInformationVisualizationTheoryandApplications
14

Feathers can be integrated into software engineering
tools replacing standard icons with individual feather
icons for the represented code entities. For instance,
in an IDE, feather icons can be used in tree views of
the project structure, as headers of editor tabs, or in
search results.
It is further possible to augment the raw source
code as presented in an editor view by Software
Feathers. Feather may accompany the declaration
of each class and interface in larger size and might
even enrich each usage of a class or interface as
tiny thumbnails. Details such as a labeled feather
can be provided as tooltips. This constitutes a form
of in situ software visualization as already proposed
for schematic diagrams visualizing line-based met-
rics (Harward et al., 2010), code smells of meth-
ods (Murphy-Hill and Black, 2010), states of numeric
variables (Beck et al., 2013a), or method runtime con-
sumption (Beck et al., 2013b).
These ideas of tool integration finally exploit the
recognizability of the feathers in order to provide en-
hanced orientation in IDEs, documentation, and other
user interfaces showing code entities. When using
feathers consistently, the approach even might link
diverse tools closer through recognizability of code
entities. The integration promises to ease code nav-
igation as entities can be retrieved more quickly and
feathers provide a preview on unknown entities; as
Ko et al. (2006) found, developers might spent 35%
of their time for code navigation.
7 CONCLUSIONS
Software Feathers are a technique for figurative vi-
sualization of code entities. Applying the metaphor
of feathers to software systems, they provide a play-
ful approach to software metrics. By mapping impor-
tant characteristics of code entities in the parameters
of the rendering procedure of feathers, unique images
are created for each entity. They provide the orig-
inally ‘invisible’ software artifacts with a recogniz-
able ‘face’ and promise to be suitable in different ap-
plications: specifically, simple categories of feathers
give a quick outlook on the purpose of the represented
code entity. This enables finding interesting code en-
tities, gaining an overview of a project, or studying
the evolution of code entities. Future research ques-
tions will be how quickly users learn to read Software
Feathers, how far having feathers integrated in the
IDE improves orientation and eases code navigation,
and whether Software Feathers increase the motiva-
tion among developers to consider and use software
metrics.
REFERENCES
Alam, S. and Dugerdil, P. (2007). EvoSpaces Visualization
Tool: Exploring Software Architecture in 3D. In WCRE
’07: Proceedings of the 14th Working Conference on Re-
verse Engineering, pages 269–270. IEEE Computer So-
ciety.
Beck, F., Hollerich, F., Diehl, S., and Weiskopf, D. (2013a).
Visual Monitoring of Numeric Variables Embedded in
Source Code. VISSOFT ’13: Proceedings of the 1st IEEE
Working Conference on Software Visualization.
Beck, F., Moseler, O., Diehl, S., and Rey, G. D. (2013b). In
Situ Understanding of Performance Bottlenecks through
Visually Augmented Code. In ICPC ’13: Proceedings
of the 21st IEEE International Conference on Program
Comprehension, pages 63–72. IEEE.
Beddow, J. (1990). Shape coding of multidimensional data
on a microcomputer display. In VIS ’90: Proceedings of
the 1st Conference on Visualization ’90, pages 238–246.
IEEE Computer Society Press.
Biegel, B., Beck, F., Hornig, W., and Diehl, S. (2012). The
Order of Things: How Developers Sort Fields and Meth-
ods. In ICSM ’12: Proceedings of the 28th IEEE In-
ternational Conference on Software Maintenance, pages
88–97. IEEE.
Borgo, R., Kehrer, J., Chung, D. H. S., Maguire, E.,
Laramee, R. S., Hauser, H., Ward, M., and Chen, M.
(2013). Glyph-based Visualization: Foundations, Design
Guidelines, Techniques and Applications. In Eurograph-
ics State of the Art Reports, pages 39–63. Eurographics
Association.
Briand, L. C., Daly, J. W., and W
¨
ust, J. (1998). A Uni-
fied Framework for Cohesion Measurement in Object-
Oriented Systems. Empirical Software Engineering,
3(1):65–117.
Briand, L. C., Daly, J. W., and W
¨
ust, J. K. (1999). A Uni-
fied Framework for Coupling Measurement in Object-
Oriented Systems. IEEE Transactions on Software En-
gineering, 25(1):91–121.
Chan, W. W. (2006). A Survey on Multivariate Data Vi-
sualization. Technical report, Department of Computer
Science and Engineering. Hong Kong University of Sci-
ence and Technology.
Chau, M. (2011). Visualizing Web Search Results Using
Glyphs: Design and Evaluation of a Flower Metaphor.
ACM Transactions on Management Information Systems,
2(1):2+.
Chen, Y., Xu, Y., Guo, B., and Shum, H. Y. (2002). Mod-
eling and Rendering of Realistic Feathers. In SIG-
GRAPH ’02: Proceedings of the 29th Annual Confer-
ence on Computer Graphics and Interactive Techniques,
volume 21, pages 630–636. ACM.
Chernoff, H. (1973). The Use of Faces to Represent Points
in k-Dimensional Space Graphically. Journal of the
American Statistical Association, 68(342):361–368.
Chidamber, S. R. and Kemerer, C. F. (1994). A Metrics
Suite for Object Oriented Design. IEEE Transactions on
Software Engineering, 20(6):476–493.
SoftwareFeathers-FigurativeVisualizationofSoftwareMetrics
15

Chuah, M. C. and Eick, S. G. (1998). Information Rich
Glyphs for Software Management Data. IEEE Computer
Graphics and Applications, 18(4):24–29.
DeLine, R., Czerwinski, M., Meyers, B., Venolia, G.,
Drucker, S., and Robertson, G. (2006). Code Thumb-
nails: Using Spatial Memory to Navigate Source Code.
In VL/HCC ’06: Proceedings of the IEEE Symposium on
Visual Languages and Human-Centric Computing, vol-
ume 0, pages 11–18. IEEE.
Draper, G. M., Livnat, Y., and Riesenfeld, R. F. (2009).
A Survey of Radial Methods for Information Visualiza-
tion. IEEE Transactions on Visualization and Computer
Graphics, 15(5):759–776.
Ducasse, S. and Lanza, M. (2005). The Class Blueprint:
Visually Supporting the Understanding of Classes. IEEE
Transactions on Software Engineering, 31(1):75–90.
Eick, S. G., Steffen, J. L., and Sumner, E. E. (1992).
Seesoft—A Tool for Visualizing Line Oriented Software
Statistics. IEEE Transactions on Software Engineering,
18(11):957–968.
Erdemir, U., Tekin, U., and Buzluca, F. (2011). E-Quality:
A Graph Based Object Oriented Software Quality Visu-
alization Tool. In VISSOFT ’11: Proceedings of the 6th
IEEE International Workshop on Visualizing Software
for Understanding and Analysis, pages 1–8. IEEE.
Fowler, M., Beck, K., Brant, J., Opdyke, W., and Roberts,
D. (1999). Refactoring: Improving the Design of Exist-
ing Code. Addison-Wesley Professional, 1 edition.
Franco, C. G. and Walter, M. (2001). Modeling the Struc-
ture of Feathers. In SIBGRAPI ’01: Proceedings of the
XIV Brazilian Symposium on Computer Graphics and
Image Processing, pages 381+. IEEE Computer Society.
Graham, H., Yang, H. Y., and Berrigan, R. (2004). A So-
lar System Metaphor for 3D Visualisation of Object Ori-
ented Software Metrics. In APVis ’04: Proceedings of the
2004 Australasian Symposium on Information Visualisa-
tion, pages 53–59. Australian Computer Society, Inc.
Harward, M., Irwin, W., and Churcher, N. (2010). In Situ
Software Visualisation. In ASWEC ’10: Proceedings
of the 21st Australian Software Engineering Conference,
pages 171–180. IEEE Computer Society.
Hindle, A., Barr, E. T., Su, Z., Gabel, M., and Devanbu,
P. (2012). On the Naturalness of Software. In ICSE
’12: Proceedings of the 34th International Conference
on Software Engineering, pages 837–847. IEEE.
Knight, C. and Munro, M. (1999). Comprehension with[in]
Virtual Environment Visualisations. In IWPC ’99: Pro-
ceedings of the 7th International Workshop on Program
Comprehension, pages 4–11. IEEE Computer Society.
Ko, A. J., Myers, B. A., Coblenz, M. J., and Aung, H. H.
(2006). An Exploratory Study of How Developers Seek,
Relate, and Collect Relevant Information during Soft-
ware Maintenance Tasks. IEEE Trans. Softw. Eng.,
32(12):971–987.
Lanza, M. (2001). The Evolution Matrix: Recovering
Software Evolution using Software Visualization Tech-
niques. In IWPSE ’01: Proceedings of the 4th Inter-
national Workshop on Principles of Software Evolution,
pages 37–42. ACM.
Lanza, M. and Ducasse, S. (2003). Polymetric Views -
A Lightweight Visual Approach to Reverse Engineering.
IEEE Transactions on Software Engineering, 29(9):782–
795.
Lucas, P. R. and Stettenheim, A. M. (1972). Avian Anatomy:
Integument. US Department of Agriculture Handbook.
U. S. Government Printing Office, 1st edition.
McCabe, T. J. (1976). A Complexity Measure. IEEE Trans-
actions on Software Engineering, SE-2(4):308–320.
Murphy-Hill, E. and Black, A. P. (2010). An Interactive
Ambient Visualization for Code Smells. In SOFTVIS
’10: Proceedings of the 5th International Symposium on
Software Visualization, pages 5–14. ACM.
Nocke, T., Schlechtweg, S., and Schumann, H. (2005).
Icon-based Visualization using Mosaic Metaphors. In IV
’05: Proceedings of the 9th International Conference on
Information Visualisation, pages 103–109. IEEE.
Passos, E. B., Medeiros, D. B., Neto, P. A. S., and Clua, E.
W. G. (2011). Turning Real-World Software Develop-
ment into a Game. In SBGAMES ’11: Brazilian Sympo-
sium on Games and Digital Entertainment, pages 260–
269. IEEE.
Pickett, R. M. and Grinstein, G. G. (1988). Iconographic
Displays For Visualizing Multidimensional Data. In
SMC ’88: Proceedings of the 1988 IEEE International
Conference on Systems, Man, and Cybernetics, vol-
ume 1, pages 514–519. IEEE.
Pinzger, M., Gall, H., Fischer, M., and Lanza, M. (2005).
Visualizing Multiple Evolution Metrics. In SOFTVIS
’05: Proceedings of the 2005 ACM Symposium on Soft-
ware Visualization, pages 67–75. ACM.
Podulka, S., Rohrbaugh, R. W., and Bonney, R. (2004).
Handbook of Bird Biology. Princeton University Press.
Singer, L. and Schneider, K. (2012). It Was a Bit of a Race:
Gamification of Version Control. In GAS ’12: Proceed-
ings of the 2nd International Workshop on Games and
Software Engineering, pages 5–8. IEEE.
Steinbr
¨
uckner, F. and Lewerentz, C. (2013). Understand-
ing software evolution with software cities. Information
Visualization, 12(2):200–216.
Streit, L. and Heidrich, W. (2002). A Biologically-
Parameterized Feather Model. Computer Graphics Fo-
rum, 21(3):565–573.
Ward, M. O. (2008). Multivariate Data Glyphs: Princi-
ples and Practice. In Handbook of Data Visualization,
Springer Handbooks Comp.Statistics, pages 179–198.
Springer Berlin Heidelberg.
Wettel, R. and Lanza, M. (2008). Visual Exploration of
Large-Scale System Evolution. In WCRE ’08: Proceed-
ings of the 15th Working Conference on Reverse Engi-
neering, pages 219–228. IEEE.
Wong, P. C. and Bergeron, R. D. (1997). 30 Years of Multi-
dimensional Multivariate Visualization. In Scientific Vi-
sualization, Overviews, Methodologies, and Techniques,
pages 3–33. IEEE Computer Society.
IVAPP2014-InternationalConferenceonInformationVisualizationTheoryandApplications
16
