
Simulation and Optimization
for Bed Re-organization at a Surgery Department
Paolo Landa, Elena Tànfani and Angela Testi
Department of Economics and Business Studies, University of Genova, Via Vivaldi 5, Genova, Italy
Keywords: Discrete Event Simulation, Simulation Optimization, Patient Flow, Bed Reconfiguration, Surgery
Department.
Abstract: In this paper we focus our analysis on patient flows inside a hospital surgery department, with the aim of
supporting the bed re-configuration following an “intensity of care” paradigm. The main contribution of this
paper is to develop a Discrete Event Simulation (DES) model which describes the elective and emergent
patient flows in a Surgery Department, and is able to evaluate the impact of re-organizing hospital resources
within the Department. The model has been applied to reproduce a case study of a General Surgery
Department sited in Genova (Italy). Firstly, the model has been used to quantify the impact on a set of
performance indicators of the re-organization of a "traditional" stay area into an "intensity of care" one.
Following this re-organization the available beds capacity is no longer divided into operating units based on
the pathology and medical discipline, but into three different stay areas homogeneous with respect of the
complexity of care to be delivered. Secondly, by using the “Optimizer” module, embedded in the Witness
simulation software, the best number of beds to be assigned to each Intensity of Care Level (ICL) is
determined in order to maximize the number of patients operated. The model development is presented and
preliminary results are analyzed and discussed.
1 INTRODUCTION
Worldwide, aging of population, more demanding
consumers and, above all, fast technological
progress able to diagnose and solve more and more
health problems, are threatening the sustainability of
public health systems. The situation is worsened by
the current economic crisis and the stringent public
budget constraints.
If we agree that coverage should not be reduced,
the only way of ensuring the health systems survival
is reducing costs. There are many potential ways of
doing it (Berwick and Hackbarth, 2012). Here we
focus on what can be done by re-organizing patient
flows through hospital surgical facilities.
From the analysis of the literature it appears that
simulation has been extensively used for evaluating
the impact of resource availability and
organizational setting, since direct experimentation
is too costly and almost impossible to pursue
(Jacobson et al., 2006); (Lagergren, 1998); (Gunal,
2012).
All phases of patient flow have been studied. In
particular, some authors use simulation to improve
the waiting list management and scheduling patient
admission in hospitals (Sciomachen et al., 2005);
(Vissers et al., 2007). Tuft and Gallivan (2001) use
simulation to compare different strategies for
determining admission dates for patients awaiting
cataract extraction, while Ratcliffe et al. (2001)
evaluate alternative allocation policies for the
management of waiting list for liver transplantation.
Other works deal with the use of simulation for
Operating Room (OR) planning and scheduling.
Among them, a practical and efficient simulation
model to support OR scheduling decisions
concerning patients waiting for elective surgery is
proposed in Everett (2002), while in Bowers and
Mould (2004) simulation is used to assess proposals
for improving the utilisation of orthopaedic trauma
theatre sessions. In Testi et al. (2007) a discrete
event simulation model has been developed in order
to compare different sequencing of patients inside
ORs
.
Simulation has been used also for planning bed
capacity (Harper and Shanani, 2002) and for
balancing bed unit utilizations (Cochran and Bharti,
2006), while Akkerman and Knip (2004) use
584
Landa P., Tànfani E. and Testi A..
Simulation and Optimization for Bed Re-organization at a Surgery Department .
DOI: 10.5220/0004635805840594
In Proceedings of the 3rd International Conference on Simulation and Modeling Methodologies, Technologies and Applications (HA-2013), pages
584-594
ISBN: 978-989-8565-69-3
Copyright
c
2013 SCITEPRESS (Science and Technology Publications, Lda.)

simulation to reallocate hospital beds, taking into
account the relationship between patient length of
stay, bed availability, and hospital waiting lists.
From a more “holistic” point of view, Harper and
Shanani (2002) develop an integrated simulation
model for planning and managing operating theatre,
beds and workforce needs, while VanBerkel and
Blake (2007) propose a discrete event simulation
model to support capacity planning and wait time
reduction in a general surgery department.
Other authors investigate the global flow of
patients belonging to different paths, focusing on
hospital or ambulatory facilities (Cardoen and
Demeulemeester, 2008); (Swisher et al., 2001),
while Maliapen and Dangerfield (2010) use a system
dynamics-based simulation approach to examine
clinical pathways in an Australian hospital.
In this paper we use simulation adopting a
patient-centered approach. From an operational
point of view this means considering the patient
clinical characteristics (i.e. their pathology, which
can be proxied by the so called Clinical Pathway (De
Blaser, 2006), as well as their demand of services
(that is, for instance, operating room time, nurse
assistance, monitored post-intervention assistance,
stay bed time, and so on).
The first objective of our study is to evaluate the
impact of re-organizing the "traditional" stay area
into an "intensity of care" one. This means that the
available stay beds are no longer grouped by
operating units, based on the pathology and medical
discipline, but into homogeneous stay areas with
respect of the complexity of care, not necessarily
coincident with the medical severity of the case. The
second objective is to determine the best bed
capacity re-configuration able to maximize the
number of patients operated by the surgical
department.
This first objective is achieved by developing a
Discrete Event Simulation (DES) model reproducing
a case study of a General Surgery Department sited
in Genova (Italy).
Afterwards, the optimization module integrated
in the simulation software environment (Witness,
2012) has been used in order to identify the “best
scenario”, i.e. the optimal number of beds to be
assigned to different Intensity of Care Level (ICL)
areas in order to maximize the patient throughput.
The paper is organized as follows. In Section 2,
we introduce the DES models developed to represent
the traditional and the intensity of care Department
organization. In Section 3 the data collection and
characteristics of the case study are given, while in
Section 4 the preliminary results of the scenario
analysis and optimization phase are reported.
Finally, some conclusions and directions on future
research are given in Section 5.
2 DES SIMULATION MODELS
Patients flowing across a surgical department can be
identified by many attributes, describing both their
clinical characteristics as well as resource
requirement (Tànfani and Testi, 2012).
In this framework we consider the following
relevant attributes:
Pathology-related Clinical Pathway which is
related to the Surgical Specialty assigned to the
patient;
Urgency coefficient (URG);
Expected Operating Time (EOT);
Length of Stay (LOS);
Intensity of Care Level (ICL).
The first two attributes refer to the clinical
characteristics of the patient, whereas the other three
to the individual resource requirement. Moreover,
we can use the number of beds and OR blocks as
proxies of department resource capacity, assuming
that their amount includes all necessary inputs, such
as staff, materials, drugs, etc.
In our framework, both elective surgery
pathways, as well as emergent patients coming from
the Emergency Department (ED) are considered and
the above reported attributes manage the patient
flows through the system.
In particular, two simulation models have been
developed in order to analyze how the department
stay areas can be organized and what is the impact
of different settings on patient flows. The first refers
to the system as it is in the current practice, whereas
the second reproduces the system after re-organizing
beds into the so-called “intensity of care” levels.
From literature analysis, the latter proved to be a
better setting engendering not only beneficial
effects on patient, but also hospital costs reduction
(Major, 2007).
In the “intensity of care” model patients are
grouped into 3 ICLs: i.e. high, medium and low.
These groups embody the patient clinical conditions
and complexity level of assistance.
Patients following a CP that requires particular
complexity of care (advanced nurse control, specific
monitoring activity and so on) are defined as "high
ICL" patients. The correspondent high intensity area
is high technology equipped and staff is usually
more skilled and abundant.
Patients following a CP requiring a LOS between
SimulationandOptimizationforBedRe-organizationataSurgeryDepartment
585

1 and 5 days are defined as "low ICL". If they are
appropriately scheduled, they can be admitted and
dismissed within the same week. The low ICL area
is standard equipped and can be closed during the
weekends, engendering a consistent cost saving for
the hospital. For this reason it is usually named also
as "week surgery area". Note that not only patients
with LOS less than five days are classified as low
ICL. There is the possibility that some patients, with
an expected LOS less than 5 days, are classified as
into high ICL, depending on the level of assistance
needed and the specific CP they are following.
All other patients, not classified as high or low
ICL, are admitted into the “medium ICL” area.
These patients are more heterogeneous with respect
to the ones admitted into the other two areas.
Patients coming from ED first stay in the
medium ICL area and, after being diagnosed and
possibly operated, could also change their ICL
following the pathology assessment.
In Figure 1 and 2 chart overviews of the DES
models are reported, identifying the main elements
of the system and the functional relationship among
them. In particular, Figure 1 depicts the current
system which follows the traditional organization of
the department in surgical specialties, while Figure 2
reproduces the system behaviour that should come
from the “intensity of care” re-organization.
2.1 Traditional Model
Elective patients begin the care process by a
consultation visit when the clinician decides if a
surgical intervention is needed. In the first case, the
surgeon assigns the patients to a surgical specialty i
and registers them in the corresponding waiting list
(WL
i
).
The queue discipline of the WLs which
determines the order by which patients are admitted
to be operated on is based on an already validated
prioritization system (Valente et al., 2009). When a
patient is registered in an elective waiting list, the
surgeon assigns him/her an urgency coefficient
depending on the maximum time allowed before the
treatment. The urgency coefficient (URG) gives the
speed at which the clinical need of the patient
increases along with time passing. Patients proceed
in the list according to their urgency and gain
different relative priorities, given the same time
spent in the list. In our model the queue discipline is,
therefore, based on the individual priority score
computed multiplying the already waited time for
the URG coefficient.
Elective patients exit the waiting list to be
admitted and operated in an OR block assigned to
the specialty they belong to (block scheduling
strategy). We assume the tactical decisions
pertaining the number of OR block times (usually
one half to one full day in length) assigned to each
surgical specialty as input data. We assume as given
also the cyclic timetable, denoted as Master Surgical
Schedule (MSS), which gives the assignment of
surgical specialties to each OR and day of the
planning horizon.
In our model, MSS is assumed to be given on a
historical basis and the planning horizon is set to a
week. Alternatively MSS can be obtained from ad
hoc optimization models (Cardoen et al., 2010).
At the beginning of the week, the model reads
the MSS. Afterwards, before including a patient in
the “Preoperation list” of a given OR block assigned
to the specialty to which the patient belongs to, the
model, firstly, verifies if there is a free bed and after
if the EOT is not larger than the left time available in
the assigned OR block. If the time is not enough to
include the patient in the operation list, the patient
returns to the waiting list to be scheduled in the next
OR block assigned to the specialty. The model then
goes on trying to fill the operation list as much as
possible, until the sum of the EOT of the patients
included does not exceed the block time capacity.
The ORs are modelled as machines with service
times given by the duration of the intervention. Note
that, the surgery duration can be different by the
EOT. If the surgery durations of some operated
patients exceed their EOT, the left time in a block
could not be enough to start the intervention of some
other patients. In this case, patients are shifted, i.e.
their operation is postponed to another day.
Emergent patients are directly admitted from the
Emergency Department (ED) and enter the stay area
of a specific specialty to be diagnosed and operated
on if intervention is needed. After few days if they
do not need any intervention, or if their intervention
may be postponed, they go back home and may re-
enter the system as elective patients in the future. On
the contrary, if they need immediate intervention,
they will be pushed to the “Emergent to operated”
buffer and scheduled to be operated on in the first
OR block assigned to the specialty they have been
associated to.
In order to create the operation lists, emergent
and shifted patients have pre-emption with respect to
the elective ones. In particular, firstly the model
checks if there are patients in the “Emergent to
operate” buffer, then it checks if there are patients
previously shifted waiting for the surgical operation
(“Shifted WL”) and just afterwards elective patients
in the waiting lists are selected.
SIMULTECH2013-3rdInternationalConferenceonSimulationandModelingMethodologies,Technologiesand
Applications
586

Figure 1: Traditional (“per specialty”) model.
Finally, after the intervention both elective and
emergent patients stay in a bed for a given number
of days, according to their length of stay, before
being discharged.
2.2 Intensity of Care Model
Figure 2 shows the ICL model representing an
alternative organization of the stay area with respect
to the traditional model. This organization represents
an important contribution to surgical therapeutic
strategies, allowing an excellent compromise among
safety, convenience for the patient, nurse workload
organization and economic savings for health care
structures.
The modifications with respect to the traditional
model are intended to exploit all possible benefits
coming from the “intensity of care” re-organization.
Elective patients arriving from outside world are
registered into two different waiting lists
created for
low (WL low) and medium-high (WL M-H) patients,
respectively.
The admission machine rules allow operating
low ICL patients in the first days of the week to be
able to discharge them before the week end.
Both
SimulationandOptimizationforBedRe-organizationataSurgeryDepartment
587
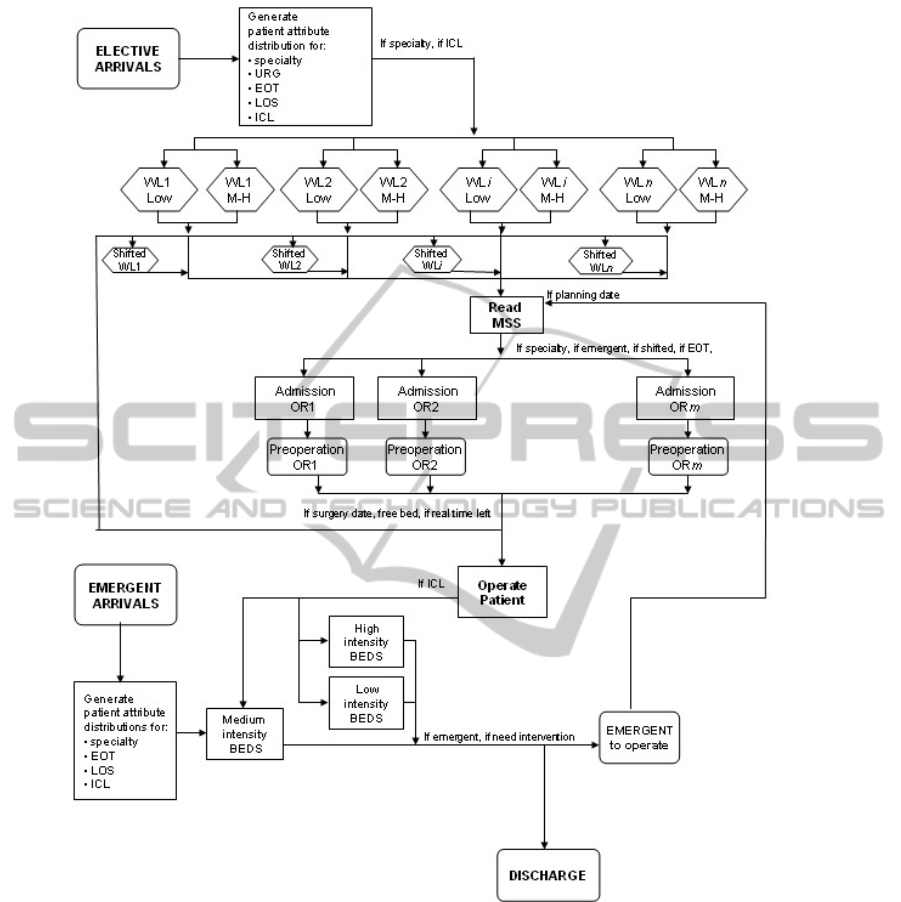
Figure 2: “Intensity of Care” (ICL) Model.
lists are ordered following the same prioritisation
system of the traditional model. I
n the first two days
of the week (Monday and Tuesday) the admission
machines read the MSS and first check for each OR
and day if there are emergent or shifted patients to
be operated on. After, they verify if patients from the
low ICL waiting list are present and only if there not
patients belonging to the above described classes,
medium-high patients are selected. In the other days
of the week, patients with the highest priority among
low, medium and high ICL patients are selected to
be included in the Preoperation list of each OR
block.
In the ICL model emergent patients coming from
the ED stay into a medium ICL bed (pre-
intervention stay) and, after being diagnosed, can be
dismissed or included into the “Emergent to
operated” buffer. Note that, have to be operated,
they could change their ICL following the pathology
assessment.
The main modification of the system behaviour
regards the organization of the stay area. Beds are
grouped into low, medium and high ICL areas. This
organization impacts on the rule which manages the
flow of patients (both elective and emergent) in the
stay area after the surgical intervention. In particular,
SIMULTECH2013-3rdInternationalConferenceonSimulationandModelingMethodologies,Technologiesand
Applications
588

low ICL patients are directed to a Low Intensity bed,
while patients that have a medium and high ICL are
moved respectively to Medium and High Intensity
beds. Note that, the Low ICL area closes during the
week end and patients that are not dismissed before
Saturday morning are moved into a medium ICL
bed.
3 CASE STUDY AND DATA
COLLECTION
The simulation model has been applied to analyse
the patient flows into a General Surgery Department
of the San Martino University hospital sited in
Genova, Italy. In the department under study 7
specialties share the hospital resources, i.e. operating
theatre and hospital stay beds. In particular, the
operating theatre includes 6 ORs open, from 8 a.m.
to 2 p.m., 5 days a week, for a total of 30 OR blocks
available for surgery each week.
The OR scheduling strategy herein utilized is
based on block scheduling, where the entire time slot
belongs to the specialty which OR session is
assigned by the MSS. The historical MSS is reported
in Figure 3.
With reference to the stay area 105 beds are
available for the post-intervention stay of patients
and also for the pre-intervention stay of the
emergent ones.
Figure 3: The Master Surgical Schedule.
The distribution of beds among surgical specialties
is reported in Table 1.
One year of patient data collection has been
carried
out, through the collaboration of the hospital
department under study. For all patients we collected
the whole set of characteristics necessary to generate
the distribution functions to manage the flow of
patients through the system.
Table 1: Number of beds available for each surgical
specialty.
Surgical specialty # Beds available
SS1 19
SS2 21
SS3 25
SS4 18
SS5 7
SS6 9
SS7 6
TOTAL 105
The collected data were sorted and various statistics
were derived using statistical modelling package,
such as SAS System, to estimate the inter-arrival
time distribution function for each specialty and to
obtain the empirical distributions of SS, EOT, LOS
and ICL attributes.
The patient inter-arrival times of each surgical
specialty are generated following NegExp
distributions with mean value defined in Table 2.
Table 2: Mean values inter-arrival times.
Surgical specialty Mean
SS1 9.2
SS2 12.0
SS3 10.5
SS4 12.7
SS5 30.0
SS6 33.3
SS7 40.0
The patient distribution of the ICL attribute among
the specialties is shown in Figure 4.
Note that, the highest percentage of patients
belongs to medium and low ICL, while high
intensity patients represent a small ratio.
Figure 4: Distribution of High, Medium and Low ICL
patients for each specialty.
In Figure 5 are depicted the LOS empirical
frequency distributions for the elective patients
belonging to the three ICLs. Low ICL patients
0%
10%
20%
30%
40%
50%
60%
70%
80%
90%
100%
SS1 SS2 SS3 SS4 SS5 SS6 SS7
High Medium Low
SimulationandOptimizationforBedRe-organizationataSurgeryDepartment
589

usually have a LOS less to five days and rarely
consume few days outside the first week. High and
medium ICL patients have longer LOS (between one
week and two weeks), with most likely values of 10
and 11 days, respectively.
Figure 5: Elective LOS distributions (in days) by each
ICL.
Emergent patients have different LOS distributions
from the elective ones and they occupy a bed also
before the intervention (pre-operation stay). The
rationale of this behaviour becomes from the clinical
need of surgeons to perform preliminary diagnosis
evaluation in order to assess if they need or not an
intervention.
The histograms depicted in Figure
6 show the
empirical distributions of the LOS for emergent
patients operated and not operated. Usually if the
patient should not be operated, he/she is dismissed
by the hospital within 5 or 6 days, otherwise he/she
occupies a bed for at maximum two weeks.
Figure 6: LOS distributions (in days) for emergent patients
operated and not operated.
Finally, the distributions of the patient EOT and
URG are shown in Figure 7 and 8. Also for these
attributes the distributions used differ with respect to
the specialty to which patients belong to, even if
some similarities among specialties have been
observed.
Figure 7: Patient EOT distributions (in hours) for each
surgical specialty.
Figure 8: Patient urgency distributions for each surgical
specialty.
4 VALIDATION
AND SCENARIOS ANALYSIS
Once the discrete event simulation model has been
implemented in WITNESS simulation software
(Witness, 2012), it has been validated to ensure its
ability to represent the real system case study under
investigation.
During the models development and after their
implementation and running a face validation (Law
2007) has been performed with the clinicians and
nurses of the department to verify the overall
behaviour and the rules introduced for both the
traditional and ICL model. The personnel involved
gave us many insights to adapt the model to the
current practice and render it a truer representation
of the real system. Afterwards, the “traditional”
simulation outputs have been compared to the real
measures under investigation by adopting
appropriate validation tests (Law, 2007). After a one
year warm up, we compare the number of patients
operated by each specialty simulation output,
0%
5%
10%
15%
20%
25%
30%
35%
40%
123456789101112131415>15
High Medium Low
0%
5%
10%
15%
20%
25%
30%
35%
40%
123456789101112131415>15
Notoperated Operated
0%
10%
20%
30%
40%
50%
60%
70%
80%
90%
100%
SS1 SS2 SS3 SS4 SS5 SS6 SS7
1.25 1.75 2.5 3.5 4.5
0%
10%
20%
30%
40%
50%
60%
70%
80%
90%
100%
SS1 SS2 SS3 SS4 SS5 SS6 SS7
A1 A2 B C D
SIMULTECH2013-3rdInternationalConferenceonSimulationandModelingMethodologies,Technologiesand
Applications
590

obtained by 10 IID replications one year length, with
the real collected values. We used the t-Test for
testing the null hypothesis H
0
under a probability of
rejecting the model fixed to the =0.05 level,
obtaining for all specialties a value inferior to the
critical value.
The discrete event simulation models have been
used to analyze the effects on system behavior of the
proposed re-organization of the stay area. Besides,
the optimization module integrated in the simulation
software environment has been applied in order to
determine the optimal decision pertaining the
number of beds to assign to each ICL area following
the intensity of care re-organization.
For the output analysis we used a set of
performance indexes able to assess the performance
of the system and the resource (OR and beds)
utilizations and bottlenecks by different point of
views.
The ORs activity is measured by the number of
patients operated during the period. The OR
utilization rate measures whether OR blocks, which
are the most costly resources of the hospital, are
exploited as much as possible. The index is
computed as the average ratio between the real
occupation and the OR block length for all blocks.
The number of shifted patients, could be considered,
in some sense, an index of equity of the OR activity
measuring the percentage of patients planned to be
operated on and then shifted, i.e. rescheduled in
other days.
Finally, the stay area performance is assessed by
the bed utilization rate. Note that in the ICL model
the utilization rate is computed separately for beds
devoted to low, medium and high intensity stay and
as average for the whole department (overall).
4.1 Optimization Settings and Results
In order to run the ICL model a decision must be
taken about how many beds, among the 105
currently available in the Department, should be
assigned to each ICL area. To find the best
combination of these variables we run the
“Optimizer” module, embedded in Witness, using as
objective function the number of patients operated.
Two optimization settings have been evaluated
which differ on the range of values fixed for each
variable, i.e. lower and upper bounds on the number
of beds for each ICL area (Table 3). At this stage we
just take the preliminary hypothesis under study at
the Department which provides us the data, but
many other range value combinations could be
tested and compared. A total capacity constraint has
been included which forces the total number of beds
used to be less than, or equal to, the maximum
number of beds available.
To carry out the optimization process we choose
the “Adaptive Thermostatistical Simulated
Annealing (SA)” algorithm. This algorithm is based
on traditional simulated annealing methodology and
incorporates adaptive cooling and reactive
thermostatistical search. We set the maximum
number of consecutive moves without improvement
at 300, thus obtaining the maximum number of
constrained scenarios to be evaluated reported in the
last row of Table 3.
Table 3: Optimization parameters settings and scenarios.
ICL
Model
[Setting 1]
ICL
Model
[Setting 2]
# beds LOW [15-35] [15-35]
# beds MEDIUM [55-75] [45-65]
# beds HIGH [15-35] [15-35]
Total beds <=105 <=105
# of constr. scenarios
to be evaluated
286 711
The one-year length steady state computational
results, obtained with a one-year warm up and 10
IID replication runs, are reported in Tables 4 and 5.
Table 4: Optimization results.
ICL
Model
[Setting 1]
ICL
Model
[Setting 2]
Best scenario 27-55-23 27-51-23
Total number of beds 105 101
In particular, in Table 4 the best scenario, i.e. the
number of beds for each ICL level, and the total
number of beds used are reported, while in Table 5
the output measures obtained with the traditional
model and the ICL ones, are reported and compared.
The best scenario has been obtained by using the
optimization setting 2 and corresponds to assign,
respectively, 27, 51 and 23 beds to high, medium
and low ICL stay areas.
Moreover, for both optimization settings herein
evaluated, the ICL model overlaps the traditional
one with respect to all performance measures
computed. Introducing the “intensity of care”
organization improves the activity indexes, not only
for the number of patients operated and OR
utilization rate, as expected, but also improves the
performance of the stay area. Dismissed patients and
bed utilization rates increase as a consequence of the
SimulationandOptimizationforBedRe-organizationataSurgeryDepartment
591

Figure 9: Objective function value obtained during the optimization run.
Table 5: Traditional and ICL models comparison.
Tradit.
Model
ICL
Model
[Setting 1]
ICL
Model
[Setting 2]
# operated . 3244 3619 3649
# shifted 869 735 717
OR utiliz. rate 75.6 85.9 84.8
# dismissed 3418 3793 3821
Bed utiliz. rate
(high ICL)
/ 63.5 63.4
Bed utiliz. rate
(medium ICL)
/ 69.6 72.1
Bed utiliz. rate
(low ICL )
/ 71.9 74.3
Bed utiliz. rate
(overall )
64.8 66.8 68.5
performance of the stay area. Dismissed patients and
bed utilization rates increase as a consequence of the
increased throughput. Note that the overall
utilization rate passes from 64.8 (traditional model)
to 68.5 (ICL model [Setting 2]) as a direct effect of
this re-organization. More importantly the bed
utilization of the different ICL areas are balanced,
thus allowing an efficient human resources workload
organization within the stay areas. In addition, the
number of shifted patients decreases.
As a further analysis, in Figure 9 the values of
the objective function for each evaluation of the ICL
model [setting 2] are plotted, while in Table
6 the
performance measures of the best 20 scenarios are
reported and compared.
The SA optimization algorithm starts to explore
the scenarios with less high ICL beds and for each
value of this variable, changes the number of
medium and low beds, respectively. Note that, by
increasing the number of high ICL beds until 27
greater objective function values are obtained. The
best solution is reached at evaluation 557 and
corresponds to 3649 operated patients, afterwards no
more improvement can be obtained.
From the analysis of the set of output measures
of the 20 best solutions, it appears that the decision
tool here presented allows quantifying the
performance of the system for several scenarios by
means of a multidimensional evaluation. In fact
looking at the total number of beds used it can be
noted that comparing the best scenario with
scenarios 486, 549 and 630, only 99 beds are used
instead of 101, even if less patients are operated.
While, if we focus on the beds utilization rates, the
scenarios with 25 high ICL beds (502, 509 and 515)
allow a better bed balancing utilization even if 3609
patients are operated instead of 3649.
The DES models, together with the use of some
optimization methods, allow assessing how the re-
organization can impact on system behaviour as well
as finding a set of “good” solutions with respect to
different performance measures. The optimal
solution greatly depends on the case study analysed.
SIMULTECH2013-3rdInternationalConferenceonSimulationandModelingMethodologies,Technologiesand
Applications
592

Table 6: Best 20 scenarios output analysis.
Evaluat.
Obj_funct
(operated
patients)
Total #
of beds
used
High
ICL
beds
Medium
ICL
Beds
Low
ICL
beds
#
dismissed
patients
#
shifted
patients
OR
utilizati
on rate
(%)
Bed
utiliz.
rate %
(High )
Bed
utiliz.
Rate %
(Medium
Bed
utiliz.
rate %
(Low )
486 3619 99 25 49 25 3768 745 84.439 65.945 75.894 68.002
502 3609 101 25 53 23 3765 746 84.020 70.986 69.634 70.901
509 3609 103 25 55 23 3765 746 84.020 70.986 67.102 70.901
515 3609 105 25 57 23 3765 746 84.020 70.986 64.747 70.901
549 3611 99 27 49 23 3785 749 84.159 61.357 75.653 72.419
551 3615 103 27 49 27 3772 735 84.321 62.401 78.405 60.382
552 3619 105 27 49 29 3776 741 84.272 63.209 76.405 56.297
557 3649 101 27 51 23 3821 717 84.810 63.332 71.841 74.399
558 3618 103 27 51 25 3784 698 84.393 68.364 70.466 67.558
565 3614 105 27 53 25 3794 723 84.180 63.32 70.044 67.277
570 3619 105 27 55 23 3793 735 84.252 62.969 69.42 71.933
595 3623 101 29 47 25 3782 705 84.641 58.045 79.229 65.374
604 3607 105 29 49 27 3758 753 84.005 57.611 75.212 62.13
609 3613 103 29 51 23 3781 759 84.107 57.494 73.268 73.208
630 3614 99 31 45 23 3761 764 84.330 57.782 78.821 72.181
638 3607 101 31 47 23 3774 740 83.963 54.096 80.1 71.228
644 3608 101 31 49 21 3796 696 84.257 57.308 76.587 75.867
673 3607 103 33 47 23 3774 740 83.963 50.818 80.1 71.228
678 3609 103 33 49 21 3765 757 83.890 52.077 74.104 80.994
700 3607 105 35 47 23 3774 740 83.963 47.914 80.1 71.228
704 3609 105 35 49 21 3765 757 83.890 49.101 74.104 80.994
Moreover, the framework could be used as a
decision support system, to quantify the costs and
benefits of different re-organization strategies and
their impact on system performance.
5 CONCLUSIONS
In this paper we develop a decision support
framework to analyze patient flows inside a hospital
surgery department, taking advantage both from
simulation and optimization ability to support
decisions. The framework has been applied to a real
case study of a Surgery Department sited in Genova
(Italy).
The main aim is to evaluate the effects on the
department system performance of differentiating
stay areas with respect to the level of assistance
needed by patients. In this organization, which
follows the so called “intensity of care” paradigm,
stay beds should be grouped by complexity of
assistance, rather than be associated to specialties as
it is in the current practice.
The results of the optimization analysis
performed with the “Optimizer” module are
presented.
The main conclusion is that, in principle, a
decision tool cannot individuate the best solution,
but rather can help in assessing the direct and
indirect impact of each re-organizational strategy.
Of course the model is quite general and other
patient characteristics and flows, as well as structure
and system constraints implying different
organizational models, could be included.
Future research can be devoted to explore the
effects of introducing different objective functions,
such as maximizing the utilization bed rate,
minimizing shifted patients or detecting the best mix
between bed and OR availability. Moreover, a
deeper analysis is still necessary in order to compare
a larger set of variable combinations as well as
quantify the sensitivity of the solutions to parameter
settings.
SimulationandOptimizationforBedRe-organizationataSurgeryDepartment
593

ACKNOWLEDGEMENTS
The authors acknowledge support from the Italian
Ministry of Education, University and Research
(MIUR), under the grand FIRB n. RBFR081KSB.
The authors wish to thank the staff of General
Surgery Department of the San Martino and in
particular, Giancarlo Torre, Gianluca Ansaldo and
Emanuela Varaldo, for providing data and helping in
model implementation and validation.
REFERENCES
Akkerman R., Knip M., 2004. Reallocation of beds to
reduce waiting time for cardiac surgery. Health Care
Management Science 7(2), 119-126.
Berwick D. M., Hackbarth A. D., 2012. Eliminating Waste
in US Health Care, JAMA 307(14), 1513-151.
Bowers J., Mould G., 2004. Managing uncertainty in
orthopaedic trauma theatres. European Journal of
Operational Research 154, 599-608.
Cardoen B., Demeulemeester E., 2008. Capacity of
Clinical Pathways - A Strategic Multi-level Evaluation
Tool. Journal of Medical Systems 32(6), 443-452.
Cochran J. K., Bharti A., 2006. Stochastic bed balancing
of an obstetrics hospital. Health Care Management
Science 9(1), 31-45.
Cardoen B., Demeulemeester E., Beliën J., 2010.
Operating room planning and scheduling: A literature
review. European Journal of Operational Research
201(3), 921-932.
De Blaser L., Depreitere R., De Waele K., vanhaecht K.,
Vlayen J., Sermeus W., 2006. Defining pathways.
Journal of Nursing Management 14, 553-563.
Everett J. E., 2002. A decision Support Simulation model
for the management of an elective surgery waiting
system. Health Care Management Science 5, 89-95.
Gunal M. M., 2012. A guide for building hospital
simulation models. Health Systems 1, 17–25
Harper P. R., Shanani A. K., 2002. Modelling for the
planning and management of bed capacities in
hospitals. The Journal of the Operational Research
Society 53(1), 11-18.
Harper P. R., 2002. A framework for operational modeling
of hospital resources. Health Care Management
Science 5(3), 165-173.
Jacobson S. H., Hall S. N., Swisher J. R., 2006. Discrete
Event Simulation of Health Care Systems. In Hall
R.W. (eds.) Patient Flow: Reducing Delay in
Healthcare Delivery, pp. 211-252. International Series
in Operations Research and Management Science,
Vol. 91. Springer, New York.
Lagergren M., 1998. What is the contribution of models to
management and research in health services? A view
from Europe. European Journal of Operations
Research 105(2), 257-266.
Law M. A., 2007. Simulation Modeling & Analysis.
McGraw-Hill, 4th ed.
Major S., 2007. New approach to surgical care aims to
improve recovery and reduce length of hospital stay.
British Medical Journal 334(7598), 816-817.
Maliapen M., Dangerfield B. C., 2010. A system
dynamics-based simulation study for managing
clinical governance and pathways in a hospital.
Journal of the Operational Research Society 61, 255–
264.
Ratcliffe J., Young T., Buxton M., Eldabi T., Paul R.,
Burroughs A., Papatheodoridis G., Rolles K., 2001. A
simulation Modelling Approach to evaluating
alternative policies for the management of the waiting
lists for liver transplantation. Health Care
Management Science 4, 117-124.
Sciomachen A., Tanfani E., Testi A., 2005. Simulation
models for optimal schedules of operating theatres.
International Journal of Simulation 6, 26-34.
Swisher J., Jacobson S., Jun J., Balci O., 2001. Modeling
and analyzing a physician clinic environment using
discrete event-event (visual) simulation. Computers &
Operations Research 28, 105-125.
Tànfani E., Testi A., 2012. A decision support tool to
analyze Clinical Pathways in hospital. In Advanced
decision making methods applied to Health Services –
Series on Operations Research and Management
Science, pp. 191-211, Vol. 173. Springer- Verlang,
Milano
Testi A., Tànfani E. Torre G., 2007. A three-phase
approach for operating theatre schedules. Health Care
Management Science 10,163–172.
Testi A., Tanfani E., Valente R., Ansaldo G., Torre G.C.,
2008. Prioritising surgical waiting list. Journal of
Evaluation in Clinical Practice 14(1), 59-64.
Tuft S., Gallivan S., 2001. Computer modelling of a
cataract waiting list. British Journal of Ophthamology
85, 582-585.
Valente R., Testi A., Tanfani E., Fato M., Porro I., Santori
G., Santo M., Ansaldo G., Torre G.C., 2009. A model
to prioritize access to elective surgery on the base of
clinical urgency and waiting time. BMC, Health
Services Research 9(1). doi: 10.1186/1472-6963-9-1.
VanBerkel P. T., Blake J. T., 2007. A comprensive
simulation for wait time reduction and capacity
planning applied in general surgery. Health Care
Management Science 10(4), 373-85.
Vissers J. M., Adan I. J., Dellaert N. P., 2007. Developing
a platform for comparison of hospital admission
systems: An illustration. European Journal of
Operations Research 180(3), 1290-301.
Witness (2012). User guide. Lanner Group, London, UK
SIMULTECH2013-3rdInternationalConferenceonSimulationandModelingMethodologies,Technologiesand
Applications
594
