
A System Dynamics Study of an Emergency Department Impact
on the Management of Hospital’s Surgery Activities
Lucia Cassettari, Roberto Mosca, Andrea Orfeo, Roberto Revetria, Fabio Rolando
DIME Department of Mechanical, Energetic, Management and Transport Engineering, University of Genoa,
Via all’Opera Pia 15, 16145, Genoa, Italy
J. Bradley Morrison
Brandeis International Business School, Waltham (MA), U.S.A.
Keywords: Emergency Department, System Dynamics, Healthcare Management.
Abstract: In Italian hospitals equipped with an Emergency Department (ED), it is possible that patients coming from
such a structure occupy beds that had previously been scheduled for other patients. This happens because of
some law regulations that give these kind of patients preferential access to hospitalization, and it may cause
reduction in, or even stop, scheduled surgery activities. For such a reason operating theaters, surgery teams,
sterilization structure, etc., are often unable to operate in an efficient way. Regarding costs and hospital
management, this issue become considerable, and maybe even more unpleasant for patients on the waiting
list since their scheduled surgery date generally is delayed by a long time. Studying an ED, the authors
decided to build a System Dynamics model to analyze the impact of the admission from ED on other
hospital structures, and thus identify the critical threshold. Some “non trivial” corrective actions have been
evaluated in order to suggest how to address the problem which is currently causing internal conflicts and, if
not managed, is destined to grow over time.
1 INTRODUCTION
The persistence of economic turmoil, which was
originated in the U.S. due to subprime mortgages
and the collapse of Lehman Brothers in 2008, has
forced many sovereign states in Europe to take
drastic policies to limit their debt.
Among all the financial measures adopted by
Italian government, also the Healthcare system, with
a level of annual costs out of control, became the
subject of increasingly frequent budget cuts aiming
to contain the amount of Healthcare spending which
in 2010 reached 9,6% of the Gross Domestic
Product.
As a direct consequence, managers of individual
cost centers (Local Healthcare public utilities - ASL,
hospitals, research laboratories) had to make a
choice between two alternatives: on one side the so-
called "linear cuts" to performances, on the other,
the pursuit and elimination of systemic
inefficiencies, usually quite spread in those systems.
This second way of act is certainly more difficult but
could allow to recoup the amount of money
corresponding to lower state transfers, without
negatively affect the capacity of healthcare
assistance.
Thanks to the experience gained in recent years
by the DIME research group in the healthcare
management field, working jointly with some
hospital managers particularly sensitive to choice
the second route mentioned above, it has been
shown how wide the scope for action for engineers
trained in the management of complex systems
(Cassettari et al., 2011); (Frigato et al., 1999);
(Mosca et al., 2002); (Mosca et al., 2005); (Mosca et
al., 2009); (Mosca et al., 2010); (Revetria et al.,
2011). In fact, with this kind of background culture,
based on the use of ideas and models from the world
of production and services, it is widely possible to
reduce systemic costs through significant
improvements in management efficiency. This paper
arises from a collaboration between DIME research
597
Cassettari L., Mosca R., Orfeo A., Revetria R., Rolando F. and Morrison J..
A System Dynamics Study of an Emergency Department Impact on the Management of Hospital’s Surgery Activities.
DOI: 10.5220/0004617205970604
In Proceedings of the 3rd International Conference on Simulation and Modeling Methodologies, Technologies and Applications (HA-2013), pages
597-604
ISBN: 978-989-8565-69-3
Copyright
c
2013 SCITEPRESS (Science and Technology Publications, Lda.)
group and Prof. J. B. Morrison from Boston’s
Brandeis University. It aims to show how, through
the combined use of quantitative analysis and
modeling tools (Briano et al., 2010); (Cassettari et
al., 2010); (Cassettari et al., 2011); (Mosca and
Giribone, 1982); (Mosca et al., 2005); (Mosca et al.,
2010), it is possible both analyze and understand the
reasons that underlie certain inefficiencies, and the
consequences of any corrective actions, before they
are adopted.
The subject of this paper is a classic theme,
namely an analysis of the impact of an Hospital’s
Emergency Department (ED) on the beds
management of the hospital itself. With specific
reference to the examined case, it should be stated
that there are two different kind of access to the
hospital:
Ordinary admissions: made through booking and
then scheduled in the ordinary surgery activity ;
Urgent admissions: admissions from the ED,
affected by statistical randomness and with strict
priority on ordinary admissions according to
Regional laws;
This second type of access implies a possible
negative impact on the planning of hospital
departments operating on appointment (ordinary
surgery). In particular, especially in conjunction
with epidemic events, the hospitalization of these
patients in surgical wards reduces availability of
beds to those who are waiting for surgical operation,
reducing, consequently, the activity of whole
divisions. The obvious consequence is the negative
impact on the operators’ utilization indexes and the
reduction in efficiency with the related increase in
costs due to inactivity. In order to better understand
the extent of the problem, it could be highlighted
that the 54% of overall 2011 hospital admissions
(9361 on 17305) came from ED (Table 2).
It may be interesting to observe how from the
80s up to now the proposed topic has been
considered of primary importance by healthcare
management scholars (especially in North America
and Great Britain) and, consequently, is currently
available an extensive bibliography on such a
subject. For example it may be noted as in the U.S.,
between 1995 and 2005, while the ED visits
increased of 20% (up to 115 million in 2005), the
number of beds dropped by 134.000 units (Nawar et
al., 2007), increasing the ED crowding (Asplin et al.,
2003), and thus forcing many American ED to
operate at peak capacity a day-to-day basis (O’Shea,
2007). In those circumstances it should be
considered that usually the greatest part of hospital
admissions from ED are ascribable to patients with a
yellow code assigned them in the “triage” phase.
The “triage” phase is carried out by specialized
nurses and it consists into the assignment of a color
code to each incoming patient depending on the
seriousness of his conditions:
Green/white code: non urgent patient, no risks in
worsening his conditions, postponable visit
Yellow code: medium critical level, possible
evolving risks, possible life danger
Red code: very critical conditions, danger of life,
extreme priority
(Italian Ministry of Healthcare, government
ordinance, year 1992)
Facing a specific request made by the hospital
management, a System Dynamics (SD) model has
been built in order to evaluate the impact of yellow
codes on the hospital’s beds capacity.
2 DATA COLLECTION PHASE
In a first phase an analysis on data extracted from
the hospital database (related to year 2011) has been
carried out.
ED inflows and outflows, and ordinary
admissions data have been collected and then
examined. This has been done in order to accurately
assess the impact of the sum of these two
contributions (ED + Ordinary admissions) on the
hospital wards.
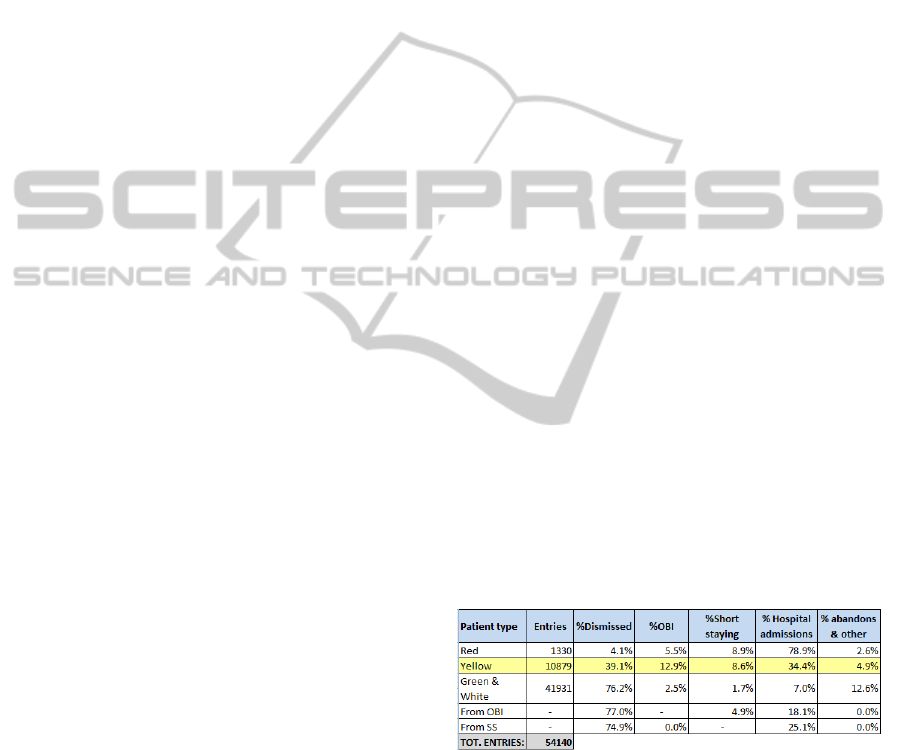
First step was the evaluation of different “color-
coded” patients incoming to the ED and their
destination after the ED physician visit (Table 1).
Table 1: Emergency Department admissions (2011).
As previously stated in the introduction, each
patient, arriving to the ED, is assigned a color
depending on the seriousness of his condition. After
the triage, the patient should wait in the queue or be
urgently visited (depending on his code). The visit
result could be:
Discharge
Admission to the Brief Intensive Observation
(OBI) structure
Admission to Short Stay (SS) structure
Admission to ordinary beds (in hospital wards)
SIMULTECH2013-3rdInternationalConferenceonSimulationandModelingMethodologies,Technologiesand
Applications
598
Abandons and others (i.e. transfer to other
structures)
The OBI is a ward inside the ED where patients
could be monitored up to 24 hours. Patients coming
out from OBI could be discharged, admitted to SS or
admitted to ordinary beds. The SS is an hospital
ward in which patients could be hospitalized in order
to be monitored up to 72 hours. Patients outcoming
from this structure are discharged or admitted to
ordinary beds according to percentages shown in
Table 1.
In the following modeling phase the authors
decided to consider only the yellow-coded patients’
flow because such a category is supposed to be the
one which is most affecting hospital occupancy in
terms of admissions per year.
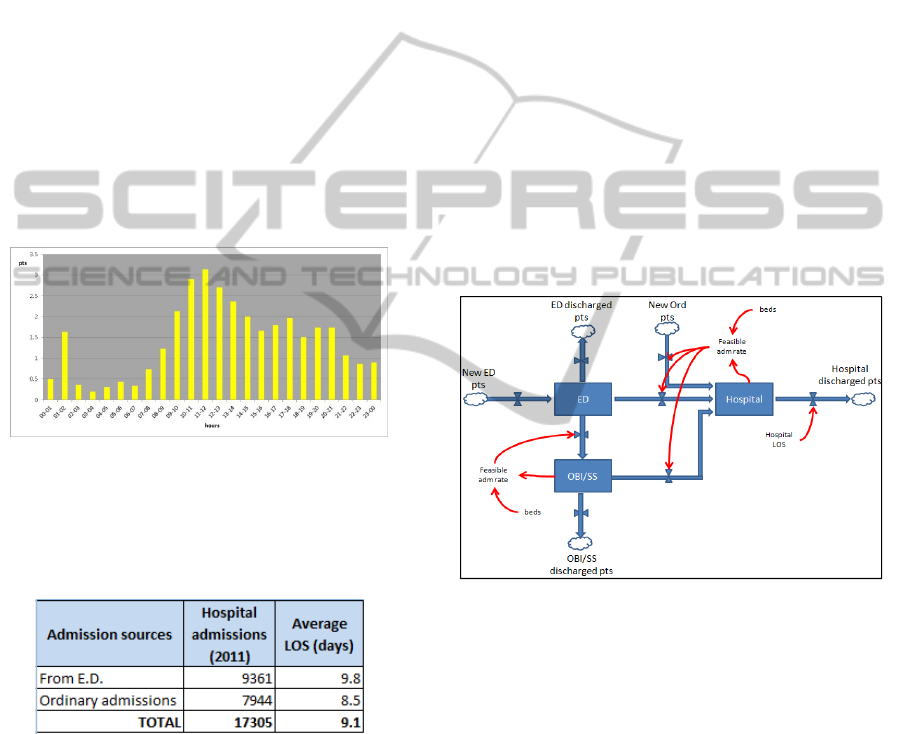
Arrivals of yellow-coded patients have been
sampled, grouping data by time slot (24 one-hour
slots) in order to take into consideration the real
arrival distribution of ED patients (Fig.1).
Figure 1: Hourly patients arrivals to ED.
Then, average Length Of Stay (LOS) both in the ED
and in OBI/SS structures has been calculated.
Table 2: Hospital admissions (2011).
Table 2 shows the average LOS in hospital wards
calculated through data extracted from the hospital
information system. This quantity will prove to be
crucial as it will be explained later.
As previously mentioned, this data collection
phase was just the necessary prelude to the modeling
phase, phase that will be described in the next
section of this paper. The model was developed both
with a thorough analysis of the real operation of the
Emergency Department, conducted through
observation on site, and as a result of discussions
and interviews with hospital staff.
3 THE SIMULATION MODEL
The authors decided to adopt a continuous modeling
technique, the System Dynamics (SD), in order to
analyze the behavior of the studied system. In
literature some SD studies over emergency
departments can be found: Lattimer et al. (2004)
built a SD model to investigate ways in which
patients flow through EDs and system capacity
could be improved, Morrison and Wears (2011)
evaluated the crowding phenomenon affecting
emergency rooms, Morrison and Rudolph (2011)
studied how the accumulation of small interruptions
on ED’s ongoing activities could lead the dynamics
of such a system into a fragile, crisis-prone one. This
methodology has often been chosen because of its
dynamic complexity, and the delayed feedback loops
imbedded in it, thus it was proved to be particularly
suitable to study the reality under consideration
(Homer and Hirsch 2006).
Fig.2 shows Author’s model in a conceptual
form.
Figure 2: A conceptual scheme of the model.
Patients enter the ED and then, after a visit, could be
sent home, or retained for a certain period in the
hospital structures. In case of hospital admissions,
this flow goes to overlap with the ordinary
admissions flow (patients of pre-scheduled surgical
operations). The admission decision, in both cases,
is a critical point, strictly related to beds availability
and Hospital Length Of Stay as it will be discussed
later.
The simulation model, developed with ISEE’s
iThink 9.1.4, resulted to be a very complex model
because of numerous variables and equations
embedded in it (see Fig.3). Thus some conceptual
schemes, with simplified illustrations, will be
presented in the paper in order to allow the reader to
understand the logical connections between main
stocks.
ASystemDynamicsStudyofanEmergencyDepartmentImpactontheManagementofHospital'sSurgeryActivities
599
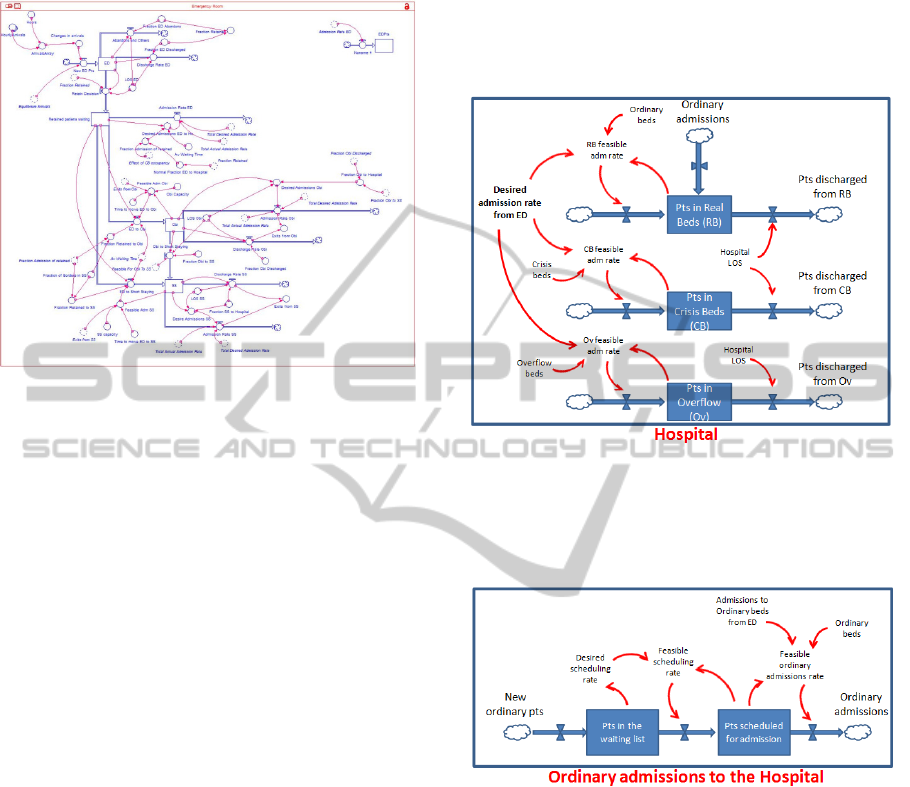
Fig. 3 shows the Emergency Department block.
Patient’s flow enters to the ED block where it stays
Figure 3: SD model – Emergency Department block.
Fig. 3 shows the Emergency Department block.
Patient’s flow enters to the ED block where it stays
for an average time of 3,2 hours (ED LOS,
calculated from hospital database), then a part of it
goes out from the system, and another one is
retained in order to be routed, at a later stage, toward
Hospital, OBI, or SS. Patients are routed to these
different destinations according to Table 1
percentages.
Both OBI and SS structures, and their related
flows, work with the same behavior.
Patients flow addressed to ordinary admissions is
routed to the Pts in Real Beds stock until its capacity
has run out. When there is no more space in real
beds, the flow goes to Pts in Crisis Beds stock and
eventually, when even this stock is full, it goes to the
Pts in overflow stock (Fig.4).
The “Hospital” block (Fig.4), which has a
limited beds capacity, receives patients from both
others model blocks (“ED” and “Ordinary
Admissions”). Patients stay into the Hospital for an
average hospitalization time (Hospital LOS), as
shown in Table 2, and they are then discharged.
Ordinary admissions and discharges usually take
place from 7:00 am to 5:00 pm, while admissions
from ED occur continually during the 24 hours since
they are emergency admissions.
Overall real beds among all Hospital’s wards are
397, plus more 13 “crisis” beds addressed to face
possible emergency situations.
In actual practice, since it is not uncommon for
the capacity to run out, the medical staff is able to
set up a number of additional beds in order to ensure
medical assistance even in the case of capacity limit
reached. In the modeling phase the authors deal with
this practice creating the Pts in Overflow stock
destined to receive patients not able to be
hospitalized neither in Pts in Real Beds nor in Pts in
Crisis Beds.
Figure 4: SD model, Hospital block – a conceptual
scheme.
Third and last block is representing ordinary
admissions dynamics (Fig.5).
Figure 5: SD model, Ordinary admission block - a
conceptual scheme.
New patients requiring surgical intervention are
inserted on a waiting list, and then comparing the
availability of beds with demand from PS, scheduled
to be hospitalized. The model has been built by
implementing a logic of "strict priority" which
focuses on access from ED. This has been made in
order to simulate the real behavior of the Hospital
which must act this way because of regional laws’
requirements.
Model has been validated through the Dynamic
Equilibrium technique (Sterman, 2000) which states
that the model reaches the equilibrium when all
incoming flows equal the total of outcoming flows.
In this specific case the equation is:
SIMULTECH2013-3rdInternationalConferenceonSimulationandModelingMethodologies,Technologiesand
Applications
600

Hospital Exits = New OrdinaryPts + New EDPts
(1)
Once the equilibrium condition has been identified,
the model has been fed with real functioning ED
data in order to evaluate its real behavior. In
particular, yellow-coded patients’ arrival
distribution, daily ordinary admissions (from the
Hospital database), and each structure LOS have
been set.
4 SIMULATION RESULTS
Analyzing the simulations results it can be
immediately put in evidence, as expected, the
importance of the impact of hospitalization time on
the
Hospital’s beds availability.
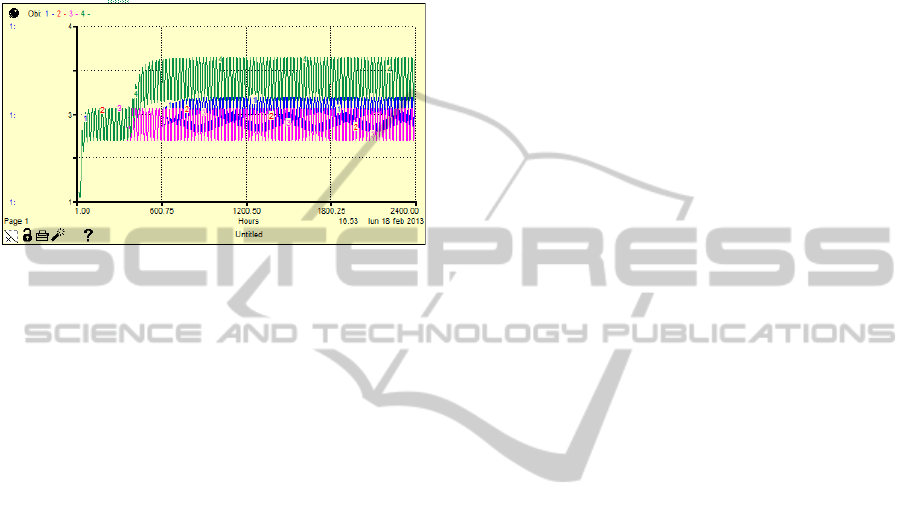
Fig. 6 shows the results of 4 simulation runs,
each one with a different value of AvgLOS.
Different colors have been used to draw each
scenario’s line:
Green line: LOS = 10 d
Blue line: LOS = 9.6 d (today)
Red line: LOS = 9 d
Purple line: LOS = 8.5 d
Figure 6: Hospital Occupancy during time vs AvgLOS
Oscillations in each individual curves are obviously
due to the daily trend of simulation inputs (ED
admissions and ordinary admissions) and outputs
(discharges). All curves reach the stability condition
after 600 simulated hours (as it can be seen in
Fig.6); this could be considered as the model’s warm
up time, and so results could be reliable only after
this period of time.
For a thorough analysis of the Fig.6 graph, the
trend of crisis beds during simulation has to be
considered (Fig.7).
Same line colors of Fig.6 have been used for all
the simulation graphs presented in this paper.
Analyzing Fig.6 and Fig.7 graphs at the same
time, the great impact of the hospitalization time on
the Hospital’s level of occupancy can be put in
evidence.
0
Figure 7: Crisis Beds Occupancy during time vs AvgLOS.
According to simulation results, currently (Average
Hospital LOS of 9,6 days) Hospital is almost always
working in bed capacity saturation conditions, and 5
additional crisis beds are necessary to face the
admission demand. It can be observed that if the
Avg.LOS grows up to 10 days, the demand for crisis
beds would rise up to 9 (on 13 available crisis beds).
Both these results are worrying because it has to
be noted that in this work the authors consider just
the ED admission flow related to yellow-coded
patients, and this doesn’t obviously represent the
total admission demand coming from such structure.
Other Fig.6’s curves (red and purple) show the
expected benefit from a possible decrease in the
average hospitalization time.
If the Hospital management could achieve a
6,25% decrease in the avgLOS (from 9,6 to 9 days),
the Hospital occupancy would stabilize around 380
beds (96% of total available beds) and thus no crisis
beds would be occupied.
The expected benefit in the fourth scenario
(purple line, 11,5% decrease in avgLOS) is even
greater, with an occupancy level of about 90,6% of
total capacity (360 occupied beds).
In order to complete the analysis, SS (Fig.7) and
OBI (Fig.8) behavior in the four scenarios has been
evaluated.
Figure 8: SS Occupancy during time vs HospitalLOS.
ASystemDynamicsStudyofanEmergencyDepartmentImpactontheManagementofHospital'sSurgeryActivities
601
By looking at both graphs it is possible to observe
how the demand for ordinary beds impact on OBI
and SS occupancy.
When the Hospital is not completely full (red and
purple lines), 7 Short Stay’s beds and 3 OBI’s beds
are required, respectively on 12 and 8 total available
beds.
Figure 9: OBI Occupancy during time vs Hospital LOS.
On the contrary, by looking at the blue and green
lines, when the Hospital’s capacity reaches the limit,
these two structures are affected by an increased
demand for beds. In current case (blue line) the
demand for SS beds increases of one unit, while the
OBI occupancy remains unchanged. In the worst
scenario (green line) the SS occupancy rises up to 9
beds, and the OBI demand increases by one unit.
Such a simulated behavior reproduces the reality
in a very accurate way; the ED decision makers, in
fact, use these two structures as a kind of “shock
absorber” for the Hospital in order to drain the
admission demand from ED. This practice could be
considered as a “bad behavior” of the system
because OBI and SS for their own nature should be
destined to a different kind of patients. They should
allow ED physicians to keep a certain percentage of
patients monitored for a limited period of time (24 or
72 hours) whether their conditions are not
completely clear.
Eventually, since only yellow-coded patients
have been considered in this study, it should be
noted once again that graphs shown in Fig.7 and
Fig.8 are not representative for the real occupancy
level of the structures. By completing the analysis
with other patients’ flows, is reasonable to expect a
saturation of capacity for both structures
5 CONCLUSIONS
This study points out the criticality of the impact of
yellow-coded patients on the ordinary surgery
structures.
In order to avoid such critical situations, two
strategies have been identified through the
simulation analysis:
Increase the number of available beds without
change the LOS
Decrease the avgLOS of 6,25%, passing from 9,6
to 9 days
However, the first strategy does not match with the
current Italian trend of Healthcare costs reduction in
which the decrease of beds is one of key points. This
could be true not only for Italy, but also for other
countries such as USA or England as well.
The second alternative, even if feasible from a
management point of view, would need a non trivial
change in some medical habits and it could be even
seen like an interference of engineers in the
physicians’ decisions. The pressure on Hospital
physicians to discharge patient in a shorter time, in
order to increase the assistance capacity, could bring
patients to revisit the ED and thus to increase the
demand for hospitalization (Baer et al., 2001); (Jack
et al., 2009).
Acting on their own capability in handling
complex systems, the DIME-MIT group suggested a
third strategy to slow down the problem at its
source: this approach consists into contain the
number of yellow-coded patients coming to the ED.
While the decentralization of some ED activities
to 24 hours clinics is taking place, as advanced by
actual government, it can be put in evidence that a
great number of yellow-coded patients are originated
by chronic ills (i.e. diabetic, heart patients) which do
not comply elementary healthcare rules. This
phenomenon in 2011 caused an overall LOS
estimated in about 5000 days (considering all the
hospitalization structures in the studied Hospital). A
strategy to contain this problem could be the
creation of dedicated outpatient clinics in order to
monitor such kind of patients in scheduled visits
such as happens for the precautionary screening of
other diseases (i.e. colon tumors, breast cancers).
By adopting this strategy, hospitals would incur
in almost negligible costs because these outpatient
clinics would have to be open just a few hours a
week, with scheduled visits carried out by ward’s
physicians in low workload moments. On the other
hand, the advantages in terms of social costs and
patients satisfaction would be significant.
The management of the Hospital appreciated
such a proposal and then declared that they will
seriously take into consideration the proposed
solution.
SIMULTECH2013-3rdInternationalConferenceonSimulationandModelingMethodologies,Technologiesand
Applications
602

6 FUTURE DEVELOPMENTS
To face the problem discussed in this work, the
authors became aware of some problems affecting
the operational functioning of the Emergency
Department.
In particular it has come to light that the triage
phase is not carried out with an adequate accuracy.
In fact, a considerable percentage of hospital
admissions (37%) is ascribable to patients
previously identified with green code, while the
greatest part of such category is supposed to be
discharged, or in the worst cases, sent to OBI or SS.
On another hand, it has been pointed out that the
great pressure on ED physicians, caused by white
and green codes that usually represent the majority
of ED accesses, has no reasons to exist. It is a non
sense to wear out and divert such kind of emergency
specialists with high frequency visits forced by the
significant number of patients affected by low
critical diseases. This kind of patients could be
easily visited by young specializing doctors as
already happens in the US. For such a reason, the
authors are currently building a discrete event
simulator in order to evaluate a possible ED re-
organization. This re-organization will have to take
into consideration the creation of a different path for
white and green-coded patients among the hospital,
in order to allow emergency specialists to take care
of real urgent cases in a better way.
REFERENCES
Asplin, B. R., Magid, D. J., Rhodes, K. V., Solberg, L. I.,
Lurie, N., Camargo, C.A., 2003. A conceptual model
of emergency department crowding. In Annals of
Emergency Medicine, vol.42, Issue 2, pag. 173-180
Baer, R. B., Pasternack, J. S., et al. 2001. Recently
discharged inpatients as a source of emergency
department overcrowding. In Acad Emerg Med 8(11)
Briano, E., Caballini, C., Mosca, R., Revetria, R., Testa,
A., 2010. Proposing a system dynamic approach to
assess and improve Italian ports competitiveness.
Proceedings of the 12th WSEAS Conference on
Automatic Control, Modelling and Simulation
Cassettari L., Dagnino F., Mosca M., Revetria R., 2010.
Analysis of a urban route traffic flow exploiting the
system dynamic model. Proceedings of the 4th
WSEAS International Conference on Computer
Engineering and Applications (CEA’10), Cambridge,
USA, January 27-29, 2010.
Cassettari L., Mosca R., Revetria R. Rolando F., 2011.
Sizing of a 3,000,000t Bulk Cargo Port through
Discrete and Stochastic Simulation Integrated with
Response Surface Methodology Techniques.
Proceedings of 11th WSEAS International Conference
on Systems Theory And Scientific Computation
(ISTASC '11), Florence, Italy, August 23-25.
Cassettari, L., Mosca, R., Revetria, R., 2012. Monte Carlo
Simulation Models Evolving in Replicated Runs: A
Methodology to Choose the Optimal Experimental
Sample Size. In Mathematical Problems In
Engineering, 2012 Hindawi Publishing, Article
Number: 463873 DOI: 10.1155/2012/463873.
Frigato, A., Mosca, M., Schenone, M., 1999. Risk
management applied to project management and
project control. Proceedings of MIC 99- IASTED
Symposium on Modelling, Identification and Control,
Innsbruck (Austria).
Jack, B. W., Chetty, V. K., et al. 2009. A Reengineered
Hospital Discharge Program to Decrease
Rehospitalization: A Randomized Trial. In Ann Intern
Med. 150(3).
Homer, J. B. and Hirsch G. B., 2006. System Dynamics
Modelling for Public Health: Background and
Opportunities. In Am J Public Health 96(3).
Lattimer, V., Brailsford, S., Turnbull, J., Tarnaras, P.,
Smith, H., George, S., Gerard, K., Maslin-Prothero S.,
2004. Reviewing emergency care systems I: insights
from system dynamics modelling. In Emerg Med J
2004, n.21, 685-691.
Morrison, J. B., Rudolph, J. W., 2011. Learning from
Accident and Error: Avoiding the Hazards of
Workload, Stress, and Routine Interruptions in the
Emergency Department. Academic Emergency
Medicine, Vol.18, Issue 12, Dec. 2011.
Morrison, J. B., Wears, R. L., 2011. Emergency
Department Crowding: Vicious Cycles in the ED. 4
th
Mayo Clinic Conference on Systems Engineering &
Operations Research in Health Care Proceedings,
Rochester, MN.
Mosca, R., Giribone, P., 1982. Optimal lenght in O.R.
simulation experiments of large scale production
system. Proceedings of IASTED "Modelling,
Identification and Control", Davos (CH), 1982, pp.
78-82.
Mosca, R., 2002. Using HLA as a framework for supply
chain management: Project web-integrated logistics
designer. Simulation 78 (5 SPEC.) ,SCS, pp. 289-292.
Mosca, R., Bruzzone, A.G., Revetria R., 2002.
Cooperation in Maritime Training Process using
Virtual Reality Based and HLA Compliant Simulation.
Proceedings of XVII International Port Conference.
January 27-29, Alexandria Egypt.
Mosca, R., Cassettari, L., Revetria, R., Magro, L., 2005.
Simulation as Support for production planning in
Small & Medium Enterprise: A Case Study.
Proceedings of Winter Simulation Conference 2005,
Orlando (FL), 5-7 December 2005.
Mosca, R., Bruzzone, A. G., Cassettari, L., Mosca, M.
2009. Risk analysis for industrial plants projects: an
innovative approach based on simulation techniques
with experimental error control. Proceedings of the
European Modelling and Simulation Symposium
(EMSS’09).
ASystemDynamicsStudyofanEmergencyDepartmentImpactontheManagementofHospital'sSurgeryActivities
603

Mosca, R., Cassettari, L., Revetri,a R., 2010.
Experimental error mesaurement in Monte Carlo
Simulation. Handbook of Research on Discrete Event
Simulation: Technologies and Applications –
Chapter6, ISBN 978-1-60566-774-4 ( hardcover ),
ISBN 978-1-60566-775-1 ( ebook ) Evon M.O.Abu
Taieh and Asim Abdel Rahman El Sheikh,
Information Science Reference, New York, USA.
Mosca R., Mosca M., Cassettari L., Giribone P.G., 2010.
The Stochastic analysis of investments in industrial
plants by simulation models with control of
experimental error: theory and application to a real
business case. Applied Mathematical Sciences, Vol. 4,
2010, no. 76, 3823 – 3840.
Nawar, E. W., Niska R. W., et al. 2007. National Hospital
Ambulatory Medical Care Survey: 2005 Emergency
Department Summary. In Advance Data from Vital
and Healt Statistics, Hyattsville, MD, National Center
for Health Statistics.
O’Shea, J. S., 2007. The crisis in America’s Emergency
Rooms and what can be done. In Executive Summary
Backgrounder, n.2092, The Heritage Foundation.
Revetria, R., Testa, A., Cassettari, L., 2011. A generalized
simulation framework to manage logistics systems: a
case study in waste management and environmental
protection. Proceedings of the 2011 Winter Simulation
Conference , 943-952.
Sterman, J., 2000. Business Dynamics: Systems thinking
and modeling for a complex world, McGraw-
Hill/Iriwin.
SIMULTECH2013-3rdInternationalConferenceonSimulationandModelingMethodologies,Technologiesand
Applications
604
