
An Unsupervised Ensemble-based Markov Random Field Approach
to Microscope Cell Image Segmentation
B´alint Antal, Bence Remenyik and Andr´as Hajdu
University of Debrecen, Faculty of Informatics, POB 12, 4010, Debrecen, Hungary
Keywords:
Cell Segmentation, Markov Random Fields, Bit Plane Slicing.
Abstract:
In this paper, we propose an approach to the unsupervised segmentation of images using Markov Random
Field. The proposed approach is based on the idea of Bit Plane Slicing. We use the planes as initial labellings
for an ensemble of segmentations. With pixelwise voting, a robust segmentation approach can be achieved,
which we demonstrate on microscope cell images. We tested our approach on a publicly available database,
where it proven to be competitive with other methods and manual segmentation.
1 INTRODUCTION
Microscope cell segmentation is a very important and
challenging task for the medical image processing
community as well as physicians. Cell segmentation
is essential for several cytometric tasks likecell count-
ing and tracking. The automatic segmentation of cell
images is a well-studied field (Meijering et al., 2012)
(Coelho et al., 2009). However, efficient segmenta-
tion of such images is still an open issue. A sample
image can be seen in Figure 1.
Figure 1: A sample image from the dataset.
In this paper, we present an approach which is
shown to be effective in this field. This approach is
based on Markov Random Field segmentation, which
is a very effective way for segmenting images with
near-homogeneous objects (like cells). However, the
usual way for Markov Random Field segmentation
is via supervised learning of certain features, which
makes is dependent on the quality of the training data.
The proposed method substitutes this weakness with
an automatic approach. We provide an automatic ini-
tial labelling of the images based on only pixel inten-
sities. Since there are multiple possible choices are
available for this task, we run the segmentation from
multiple starting points and create an ensemble from
them. As the results will demonstrate, our approach
outperforms most of the state-of-the-art approaches
on a publicly available database and results in a tie
with the previousbest approaches and the manual seg-
mentation.
The rest of the paper is organized as follows: in
section 2, we describe the segmentation framework of
the Markov Random Fields, which we extend in sec-
tion 3. Section 4 contains the methodology we used in
this study. We present the results in section 5. Finally,
we draw conclusions in section 6.
2 MARKOV RANDOM FIELD
SEGMENTATION
In this section, we briefly summarize the basis for
Markov Random Field (MRF) segmentation based on
(Berthod et al., 1996). Let I = {i
1
, i
2
, . .., i
n
} be an
image. Let Λ = {0, 1} be a set of labels. Then,
we assign each i
j
, j = 1, ..., n a label ω
i
j
. Let X
be a labelling field. X is a Markov Random Field
if P(X = ω), for all ω ∈ Λ and P
ω
i
j
|ω
i
k
, i
j
6= i
k
=
94
Antal B., Remenyik B. and Hajdu A..
An Unsupervised Ensemble-based Markov Random Field Approach to Microscope Cell Image Segmentation.
DOI: 10.5220/0004612900940099
In Proceedings of the 10th International Conference on Signal Processing and Multimedia Applications and 10th International Conference on Wireless
Information Networks and Systems (SIGMAP-2013), pages 94-99
ISBN: 978-989-8565-74-7
Copyright
c
2013 SCITEPRESS (Science and Technology Publications, Lda.)

P
ω
i
j
|ω
i
k
, i
k
∈ N
i
j
, where N
i
j
is a neighbourhood of
i
j
.
The segmentation of an image I with the MRF
framework presented above, one must find an optimal
labelling. Due to the Hammersley-Clifford Theorem
(Hammersley and Clifford, 1971), we can calculate
the global energy for a labelling by summarizing the
local energies for each pixels if P(ω) follows a Gibbs
distribution. We split the local energy into two terms
for all i
j
:
E
singleton
(i
j
) = P(i
j
|ω
i
j
=
1
√
2πσ
ω
i
j
exp
i
j
ν
ω
i
j
2
2σ
ω
i
j
,
where σ is the standard deviation and the ν is the mean
of the sample.
E
doubleton
(i
j
) = V ( j, k) =
(
−β if ω
i
j
= ω
i
k
β otherwise.
The first term considers the distribution of the pixel
labels as Gaussian. For this term, the σ and ν must be
determined prior segmentation. Usually, this task re-
quires training. The second term is a smoothness prior
ensuring homogeneous segmentation of clustered re-
gions. In this case, the global energy U is the follow-
ing:
U =
∑
j=0
n
E
singleton
(i
j
) + E
doubleton
(i
j
)
.
The optimization of MRF configuration can be
done by optimizingU. If P(ω) follows a Gibbs distri-
bution, simulated annealing (Kirkpatrick et al., 1983)
converges to the optimal solution with 1 probabil-
ity. However, simulated annealing tends to be slow
in some cases. However, Iterated Conditional Modes
(ICM) (Besag, 1986) can also be effective if there is a
good initial configuration.
3 UNSUPERVISED
MRF-ENSEMBLES
As we stated in Section 2, the usual optimization of
MRFs needs training. In this section, we present an
approach to lose this dependency. For this task, we
use the basic idea of Bit Plane Slicing (BPS) (Gonza-
lez et al., 2009). BPS considers an image as a series
of planes in the following way:
BSP( j,k) =
(
1 ifthejthbitofi
k
∈ Iisset
0 otherwise.
,
where j = {0, 1, ..., 7 for a standard 8-bit grayscale
image. The planes created by BSP can be seen in Fig-
ure 2 on a sample image. A plane can be regarded as
an initial labelling of the original image without hav-
ing any prior knowledge about the image. In this way,
we can calculate the parameters for E
singleton
and start
the optimization process from an initial configuration.
As no single plane can be selected obviously as a
proper initial labelling for an MRF, we propose to use
all of them as an ensemble (Antal and Hajdu, 2012a)
(Antal and Hajdu, 2012b). That is, we run the op-
timization eight times using each plane as the initial
labelling. Then, we can use pixelwise voting (Nagy
et al., 2011) on the resulting eight images. In this
way, each pixel on the resulting image will be hav-
ing a confidence level between 0 and 7 depending on
how many of the segmentations labelled them as ob-
ject points. In Figure 3, we can see a probability map
generated from the confidence levels, and the results
for thresholding the probability map at the different
confidence levels.
4 METHODOLOGY
In this section, we provide a brief overview on the
methodologywe used in this experiment. First, in sec-
tion 4.1, we present the database we used. Then, we
introduce our evaluation procedure in section 4.2.
4.1 Database
We used the U2OS microscope cell image database
(Coelho et al., 2009). The database consists of 50
images with 1349 × 1030 resolution in PNG format.
The database contains 1830 cells, which a per image
cell count between 24 and 63. We did not use any of
the hand-segmented ground truth for learning.
4.2 Evaluation
To evaluate our segmentation approach, we have con-
sidered several metrics. In this section, we briefly in-
troduce the selected set of evaluation metrics.
For each metrics, we use the following notations.
Let I = {i
1
, i
2
, . .. , i
n
} be an image, S = {s
j
∈I}, j =
1, ... , k, k ≤ n be the result of the segmentation and
G = {g
j
∈ I}, j = 1, ..., l, l ≤ n be the ground truth.
Then, we use the following notation:
• n
00
=
n
∑
j=1
{1|i
j
/∈ S∧i
j
/∈G}.
• n
01
=
n
∑
j=1
{1|i
j
/∈ S∧i
j
∈G}.
• n
10
=
n
∑
j=1
{1|i
j
∈ S∧i
j
/∈G}.
AnUnsupervisedEnsemble-basedMarkovRandomFieldApproachtoMicroscopeCellImageSegmentation
95
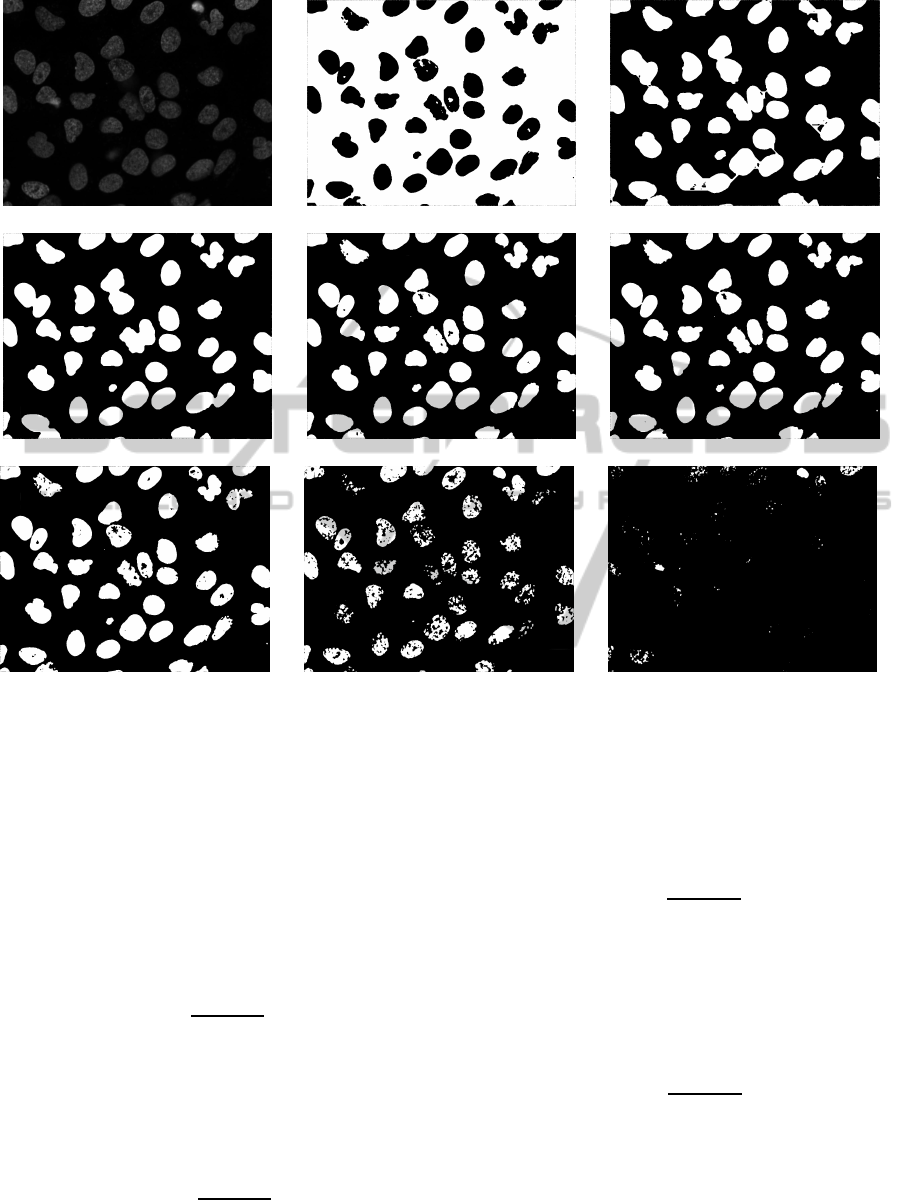
(a) Original image (b) Bit plane 0 (c) Bit plane 1
(d) Bit plane 2 (e) Bit plane 3 (f) Bit plane 4
(g) Bit plane 5 (h) Bit plane 6 (i) Bit plane 7
Figure 2: (a): Original image. (b)-(i) bit planes of 2(a).
• n
11
=
n
∑
j=1
{1|i
j
∈ S∧i
j
∈ G}.
4.2.1 Symmetric difference
Symmetric difference (SD) (tagkey2007xxi, 2007) is
a set theoretic measure counting the elements which
belong to either the segmentation or the ground truth
bot not both. We also normalize SD with the number
of pixels in the image. That is
SD =
n
01
+ n
10
n
.
4.2.2 Sensitivity
Sensitivity (SEN) (Kuncheva, 2004) is a statistical
measure for quantifying the correctly identified pos-
itive samples. In our case, it is defined as follows:
SEN =
n
11
n
11
+ n
01
.
4.2.3 Specificity
Specificity (SPE) (Kuncheva,2004) measures the cor-
rectly identified negative samples in a binary classifi-
cation problem. In our case, it is defined as follows:
SPE =
n
00
n
00
+ n
10
.
4.2.4 Positive Predictive Value
Positive Predictive Value (PPV) (Rijsbergen, 1979)
indiciates the proportion of correctly identified pos-
itive samples among all samples marked as object
points:
PPV =
n
11
n
11
+ n
10
.
4.2.5 F-score
F-score (SPE) (Rijsbergen, 1979) indiciates the pro-
portion of correctly identified positivesamples among
SIGMAP2013-InternationalConferenceonSignalProcessingandMultimediaApplications
96
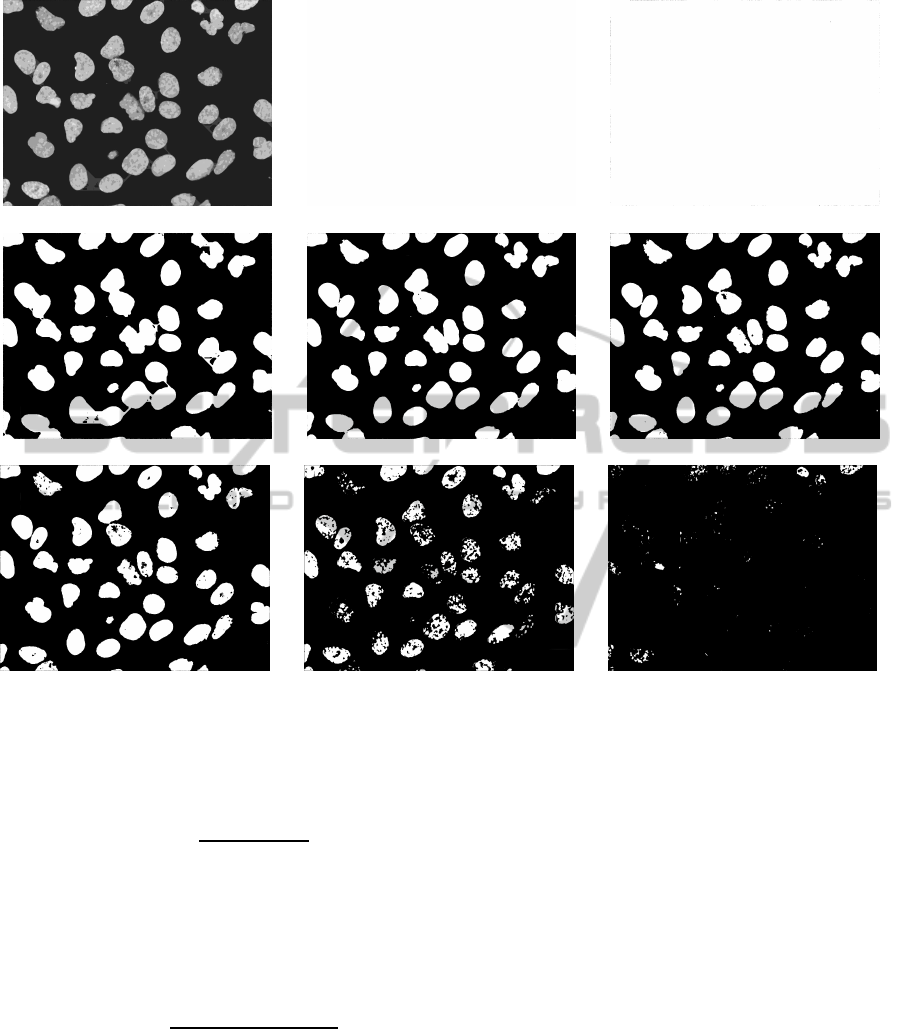
(a) Probability map (b) Confidence level 0 (c) Confidence level 1
(d) Confidence level 2 (e) Confidence level 3 (f) Confidence level 4
(g) Confidence level 5 (h) Confidence level 6 (i) Confidence level 7
Figure 3: (a): Probability map for the sample image shown in 2(a). (b)-(i) Voted images with ascending confidence level.
all samples marked as object points:
FSCORE =
2·SEN·PPV
SEN + PPV
.
4.2.6 Rand Index
Rand Index (RI) (Rand, 1971) measure the agreement
between the segmentation and the ground truth in the
following way:
FSCORE =
n
11
+ n
00
n
11
+ n
00
+ n
01
+ n
10
.
4.2.7 Receiver Operating Characteristics
We also disclose the Receiver Operating Characteris-
tics (ROC) (Johnson, 2004) curve for our segmenta-
tion approach. For the curve fitting and for the ROC-
related calculations, we used JROCFIT (Eng, ).
5 RESULTS
In Table 1, we can see the different evaluation metric
values at the different confidence levels. As we can
see, the proposed segmentation approach performs
best at the 3 confidence threshold. In this way, a sensi-
tivity of 0.84 and a specificity of 0.99 can be achieved.
We also evaluated the overall performance of the
proposedsegmentation approach. The Receiver Oper-
ating Characteristics (ROC) curve of the approach can
be seen in Figure 4. The area under the fitted ROC is
0.945, which indicates a good overall performance on
the U2OS database.
We have compared the Rand Index value achieved
by our approach to other published results on this
database. In all cases, we considered the values pre-
sented in (Coelho et al., 2009). As it can be seen,
our approach is competitive with the other methods
(outperforming five of them) as well as the manual
segmentation of an expert.
AnUnsupervisedEnsemble-basedMarkovRandomFieldApproachtoMicroscopeCellImageSegmentation
97

Table 1: Detailed results for the proposed method.
Confidence level 0 1 2 3 4 5 6 7
SD 144.91 107.64 21.71 2.34 2.75 4.09 9.72 14.35
SEN 1.00 0.97 0.88 0.84 0.81 0.71 0.39 0.14
SPE 0.00 0.24 0.84 0.99 0.99 1.00 1.00 1.00
PPV 0.26 0.31 0.66 0.98 0.98 0.98 0.98 0.97
FSCORE 0.41 0.47 0.75 0.90 0.89 0.83 0.55 0.24
RI 0.26 0.43 0.85 0.96 0.95 0.92 0.84 0.78
0
0,1
0,2
0,3
0,4
0,5
0,6
0,7
0,8
0,9
1
0 0,1 0,2 0,3 0,4 0,5 0,6 0,7 0,8
0,9 1
Sensitivity
1 - specificity
Figure 4: Receiver Operating Characteristics curve for the
proposed approach.
Table 2: Comparison of the proposed method with other
approaches.
Approach RI
proposed 0.96
Mean Threshold 0.96
Merging Algorithm (Lin et al., 2003) 0.96
AS Manual 0.96
RC Threshold (Ridler and Calvard, 1978) 0.92
Otsu Threshold (Otsu, 1979) 0.92
Watershed (direct) 0.91
Watershed (gradient) 0.90
Active Masks (Srinivasa et al., 2008) 0.87
6 CONCLUSIONS
In this paper, we presented an approach to the unsu-
pervised segmentation of images using Markov Ran-
dom Field. In this way, we can benefit from the well-
studied and efficient framework of MRFs without
the dependency on training. We have demonstrated
our approach on the problem of microscope image
segmentation, where it performed competitively with
other approaches on a publicly available database. In
the future, we plan to extend this method to cell track-
ing on videos.
ACKNOWLEDGEMENTS
The publication was supported by the T
´
AMOP-
4.2.2.C-11/1/KONV-2012-0001 project. The project
has been supported by the European Union, co-
financed by the European Social Fund.
REFERENCES
Antal, B. and Hajdu, A. (2012a). An ensemble-based
system for microaneurysm detection and diabetic
retinopathy grading. IEEE Transactions on Biomed-
ical Engineering, 59:1720 – 1726.
Antal, B. and Hajdu, A. (2012b). Improving microa-
neurysm detection using an optimally selected sub-
set of candidate extractors and preprocessing methods.
Pattern Recognition, 45(1):264 – 270.
Berthod, M., Kato, Z., Yu, S., and Zerubia, J. (1996).
Bayesian image classification using markov random
fields. Image and Vision Computing, 14(4):285 – 295.
Besag, J. (1986). On the statistical analysis of dirty pictures.
Journal of the Royal Statistical Society, B-48:259–
302.
Coelho, L. P., Shariff, A., and Murphy, R. F. (2009).
Nuclear segmentation in microscope cell images:
A hand-segmented dataset and comparison of algo-
rithms. In 2009 IEEE International Symposium on
Biomedical Imaging: From Nano to Macro, pages
518–521. IEEE.
Eng, J. ROC analysis: web-based calculator for
ROC curves. http://www.jrocfit.org Downloaded on
07/11/2012.
Gonzalez, R. C., Woods, R. E., and L., E. S. (2009). Digital
Image Processing Using MATLAB. Gatesmark Pub-
lishing.
Hammersley, J. M. and Clifford, P. (1971). Markov field on
finite graphs and lattices.
Johnson, N. P. (2004). Advantages to transforming the re-
ceiver operating characteristic (roc) curve into like-
lihood ratio co-ordinates. Stastics in Medicine,
23:2257–2266.
Kirkpatrick, S., Gelatt, C. D., and Vecchi, M. P. (1983). Op-
timization by simulated annealing. Science, 220:671–
680.
SIGMAP2013-InternationalConferenceonSignalProcessingandMultimediaApplications
98

Kuncheva, L. I. (2004). Combining Pattern Classifiers.
Methods and Algorithms. Wiley.
Lin, G., Adiga, U., Olson, K., Guzowski, J. F., Barnes,
C. A., and Roysam, B. (2003). A hybrid 3d water-
shed algorithm incorporating gradient cues and object
models for automatic segmentation of nuclei in con-
focal image stacks. Cytometry Part A, 56A(1):23–36.
Meijering, E., Dzyubachyk, O., and Smal, I. (2012). Chap-
ter nine - methods for cell and particle tracking. In
conn, P. M., editor, Imaging and Spectroscopic Anal-
ysis of Living Cells Optical and Spectroscopic Tech-
niques, volume 504 of Methods in Enzymology, pages
183 – 200. Academic Press.
Nagy, B., Harangi, B., Antal, B., and Hajdu, A. (2011).
Ensemble-based exudate detection in color fundus im-
ages. In Proceedings of the International Symposium
on Image and Signal Processing and Analysis, pages
700–703.
Otsu, N. (1979). A threshold selection method from gray-
level histograms. Systems, Man and Cybernetics,
IEEE Transactions on, 9(1):62 –66.
Rand, W. M. (1971). Objective criteria for the evaluation of
clustering methods. Journal of the American Statisti-
cal Association, 66(336):846–850.
Ridler, T. and Calvard, S. (1978). Picture thresholding us-
ing an iterative selection method. Systems, Man and
Cybernetics, IEEE Transactions on, 8(8):630 –632.
Rijsbergen, C. V. (1979). Information Retrieval. Butter-
worths, London, 2nd edition.
Srinivasa, G., Fickus, M., Gonzalez-Rivero, M., Hsieh, S.,
Guo, Y., Linstedt, A., and Kovacevic, J. (2008). Ac-
tive mask segmentation for the cell-volume compu-
tation and golgi-body segmentation of hela cell im-
ages. In Biomedical Imaging: From Nano to Macro,
2008. ISBI 2008. 5th IEEE International Symposium
on, pages 348 –351.
tagkey2007xxi (2007). In Microscope Image Processing.
Academic Press, Burlington.
AnUnsupervisedEnsemble-basedMarkovRandomFieldApproachtoMicroscopeCellImageSegmentation
99
