
Toward an Integrated Framework for Declarative
and Interactive Spreadsheet Debugging
Dietmar Jannach, Arash Baharloo and David Williamson
TU Dortmund, 44221 Dortmund, Germany
Keywords:
Spreadsheets, Debugging, Artificial Intelligence, Software Risk.
Abstract:
Spreadsheet applications can nowadays be found nearly everywhere in companies and are used for a variety
of purposes. Because of the high risk that arises when business decisions are based on faulty spreadsheets, in
recent years new approaches for spreadsheet quality assurance have been proposed. Among them are tech-
niques that allow for more intelligent tool support during the spreadsheet test and debugging process.
The design and evaluation of such new methods and tools, which are for example based on model-based tech-
niques is however challenging. On the one hand, real-world spreadsheets can be large and complex, thus
requiring highly efficient and scalable error-location algorithms. On the other hand, as spreadsheets are usu-
ally developed by non-programmers, special care has to be taken when designing the debugging user interface.
In this paper, we discuss these challenges and present the design and architecture of an integrated framework
for spreadsheet debugging called EXQUISITE. Furthermore, we report details and first experimental results of
a constraint-based debugging approach implemented in the framework, which supports the automated identifi-
cation of possible spreadsheet errors based on user-provided test cases and model-based diagnosis techniques.
1 INTRODUCTION
According to a recent meta-survey, spreadsheets are
used in more or less all levels of a company for a
variety of purposes and in particular for financial ac-
counting (Panko and Port, 2012). Like any other type
of software (SW), spreadsheets are prone to error and
in some studies, at least one fault was found in every
analyzed spreadsheet, see e.g. (Panko, 1998). This
might be caused by the fact that spreadsheets are often
developed by non-programmersand are not subject to
formal QA procedures.
Therefore, over the years, a number of propos-
als have been made which aimed to support the user
to improve the quality of spreadsheets and to mini-
mize the corresponding risks of faulty spreadsheets.
These proposals try to address the problem in differ-
ent ways. Some of the problems of poor spreadsheet
quality can be found in a lack of formal training or
missing formal Q&A procedures, see, e.g., (Pember-
ton and Robson, 2000). In this work, however, we
will focus on approaches that try to automate parts
of the development process or support the user in
the construction and debugging of the spreadsheet.
Examples of such approaches include methods for
automated test-case generation and mutation-testing
(Abraham and Erwig, 2006, 2009), program-slicing
for spreadsheets (Reichwein et al., 1999), constraint-
based declarative debugging (Abreu et al., 2012; Jan-
nach and Engler, 2010), goal-oriented repair sugges-
tions (Abraham and Erwig, 2007) or visualization-
based approaches (Chadwick et al., 2001).
The evaluation of such advanced approaches for
spreadsheet testing and debugging is a challenging
task and often accomplished through offline experi-
mental designs using existing spreadsheet corpora or
with the help of user studies. One particular issue in
spreadsheet testing and debugging is the fact that the
developer often has no profound technical expertise
in SW development. Therefore, special care has to be
taken when designing the user interaction. The usual
spreadsheet development paradigm does not, for ex-
ample, include the concept of a “test case” or a “watch
point”. As most of the above-mentioned techniques
require the user to provide further input during the
process, mechanisms have to be designed that allow
the spreadsheet developer to specify such inputs in an
intuitive way.
In this paper, we describe the design of the
EXQUISITE framework, which aims to provide new
algorithms and an integrated system for interactive,
declarative debugging of spreadsheets. The technical
117
Jannach D., Baharloo A. and Williamson D..
Toward an Integrated Framework for Declarative and Interactive Spreadsheet Debugging.
DOI: 10.5220/0004410601170124
In Proceedings of the 8th International Conference on Evaluation of Novel Approaches to Software Engineering (ENASE-2013), pages 117-124
ISBN: 978-989-8565-62-4
Copyright
c
2013 SCITEPRESS (Science and Technology Publications, Lda.)

foundation of our work consists of Reiter’s model-
based diagnosis framework (Reiter, 1987) and our
work thus continues the line of research of Jannach
and Engler (2010) or Abreu et al. (2012), who ex-
plored the general feasibility of model-based and
constraint-based debugging. The EXQUISITE frame-
work goes beyond these efforts and aims to provide
a comprehensive debugging infrastructure, which is
fully integrated in a real spreadsheet environment and
supports interactive debugging.
2 PREVIOUS WORKS
The literature on debugging of traditional SW arte-
facts is huge and comprises techniques such as slic-
ing, spectrum-based fault localization (SFL), algo-
rithmic and genetic debugging, “code smells”, or hy-
brids thereof. We plan to investigate the applicabil-
ity of adapted versions of such techniques for spread-
sheet debugging in the future, as done for example in
(Hermans et al., 2012) or (Hofer et al., 2013). Here,
however, we focus on methods that were explicitly
designed for spreadsheets as well as on declarative,
model-based debugging approaches.
Model-based Diagnosis and Debugging. Declar-
ative, knowledge-based systems as well as spread-
sheets are different from traditional programs as they
do not consist of sequences of instructions including
conditional branchings, loops or recursion. Instead,
they consist of individual “statements” that describe,
e.g., inference rules or constraints in a declarative or
functional way. Thus, there exists no program flow or
execution trace that can be used for error localization
as done in traditional debugging approaches.
Model-based diagnosis (MBD) is a systematic ap-
proach from the field of AI, which was originally ap-
plied to compute possible reasons for an unexpected
behavior of hardware artefacts, e.g., electronic cir-
cuits. In that context, “diagnoses” correspond to sub-
sets of the components of a system, which, if assumed
to be faulty, explain the unexpected behavior. The
computation of such diagnosis is based on the con-
cept of “conflicts”, which are, roughly speaking, sub-
sets of the components, that cannot be assumed to
behave correctly at the same time given the observa-
tions. Diagnoses can be inferred from these conflicts
using, e.g., Reiter’s Hitting Set (Reiter, 1987) algo-
rithm. The generic nature of the approach made it
possible to apply it to other types of systems, in partic-
ular to software-based ones. MBD techniques have,
for example, been applied to find errors in logical
programs, VHDL specifications, complex knowledge
bases or ontologies and even imperative languages
(Console et al., 1993; Friedrich et al., 1999; Felfer-
nig et al., 2004; Mateis et al., 2000). Recently, ap-
proachestoward applying MBD to spreadsheets based
on a translation of the spreadsheet to a constraint sat-
isfaction problem have been reported in (Jannach and
Engler, 2010) and (Abreu et al., 2012).
Our work continues this line of research. How-
ever, besides planned algorithmicimprovements(e.g.,
based on constraint graph analysis), our goal is to
evaluate the practical applicability through a more re-
alistic evaluation. The mentioned previous works are
mainly based on an “offline” analysis without any real
user interaction or integration into a real spreadsheet
system. Thus, it remains unclear whether or not users
will be able to interpret the debugging hints by the di-
agnosis engine or discriminate between different al-
ternatives. Furthermore, questions related to methods
for test case specification remain open.
Spreadsheet-specific Methods. GOALDEBUG is a
user-oriented spreadsheet debugging method, which
calculates “repair” proposals for faulty spreadsheets
(Abraham and Erwig, 2007) based on user-provided
expected values for certain cells. The ranking of pos-
sible repairs that lead to the desired result is based on
domain-specific heuristics. The evaluation was based
on the mutation of real-world spreadsheets through
the injection of artificial errors using spreadsheet-
specific mutation operators (Abraham and Erwig,
2009). As evaluation metrics both the percentage of
identified correct repairs as well as the ranking of the
correct repair within a set of alternatives were used.
Similar to the above mentioned MBD-approaches,
GOALDEBUG uses a constraint representation of the
spreadsheet on which the internal inferences are
based. The proposed change inference rules are how-
ever spreadsheet-specific and GOALDEBUG’s effec-
tiveness thus depends on the quality of these rules.
Our work is similar to GOALDEBUG in that we aim
to develop a system which is integrated into a real
spreadsheet environment, which shall allow us to con-
duct studies with real users as described later on. Fur-
thermore, the EXQUISITE frameworks will rely on
a similar experimental protocol for offline analysis
based on automatically generated program mutants
using spreadsheet specific operators. In contrast to
GOALDEBUG, our framework will focus on the error
localization process and not on repair.
Software testing and debugging are closely re-
lated. Spreadsheet-specific methods for testing have
been proposed, e.g., in (Abraham and Erwig, 2006),
(Rothermel et al., 1998), or (Burnett et al., 2002).
These approaches for example include techniques for
automatic test case generation or a visual (“What
you see is what you test”) method for end users
ENASE2013-8thInternationalConferenceonEvaluationofNovelSoftwareApproachestoSoftwareEngineering
118
(WYSIWYT), which allows users to interactively test
a spreadsheet. Test cases play a crucial rule for
model-based diagnoses and the EXQUISITE frame-
work, which comprises tools for test case manage-
ment. Similar to the WYSIWYT approach, our
framework allows the user to specify that a certain
value is correct. This information is then used to nar-
row down the set of possible error candidates. With
respect to test case generation as proposed in (Abra-
ham and Erwig, 2006), EXQUISITE does not comprise
such a functionality so far. However, we believe that
this will be a valuable functionality to include as one
of our next steps to support the end user in the spec-
ification of test cases in particular for large spread-
sheets.
Evaluation Aspects and User Studies. One major
design goal of EXQUISITE is its suitability for user
studies serving two purposes. First, we aim to evalu-
ate the suitability of algorithmic debugging as well as
corresponding visualizations within spreadsheet envi-
ronments, which was not done to a large extent in pre-
vious works. Second, user studies should help us to
better understand how users develop spreadsheets and
which types of errors they make. Given such observa-
tions, we hope to be able to derive better heuristics or
error probabilities to focus the error localization pro-
cess. The work by Galletta et al. (1993) represents an
early example of an experimental study with users.
Their goal was to understand the role of domain-
and spreadsheet expertise on the error-finding perfor-
mance of spreadsheet users. The exercise consisted in
letting users find manually-injected errors in spread-
sheets and it turned out that domain experts usually
find more errors than non-experts. Still, even the ex-
perts did not detect all errors. Similar code-inspection
experiments also showed the limitations of manual er-
ror localization procedures, see (Panko, 1998). Over-
all, the number of such studies is relatively low as
mentioned by Powell et al. (2008). EXQUISITE is
therefore designed in a way that allows us to perform
such studies based on insights, experimental protocols
and methodological advices from the literature, see,
e.g., (Brown and Gould, 1987).
3 DECLARATIVE SPREADSHEET
DEBUGGING
The basis of our approach is the theory of diagnosis
developed in (Reiter, 1987). There, a diagnosable sys-
tem is described as a pair (SD, COMPONENTS) where SD
is a system description (a set of logical sentences) and
COMPONENTS, which represents the system’s compo-
nents. When diagnosing, e.g., an electronic circuit,
COMPONENTS are the different elements of the circuit
and SD describes the connections between them and
their normal behavior, which can be described using a
distinguished (usually negated) unary predicate AB(.),
meaning “abnormal”.
A diagnosis problem arises when some observa-
tion OBS of the system’s behavior deviates from the
expected behavior. Given a diagnosis problem (SD,
COMPONENTS, OBS), a diagnosis is a minimal set ∆ ⊆
COMPONENTS s.t.
SD ∪ OBS ∪{ AB(c)|c ∈ ∆} ∪
{¬ AB(c)|c ∈ COMPONENTS−∆} is consistent.
In other words, a diagnosis is a subset of the system’s
components, which, if assumed to be faulty (and thus
behave abnormally) explain the system’s behavior,
i.e., are consistent with the observations. Usually, we
are only interested in minimal diagnosis and not in
supersets of diagnosis.
Finding all minimal diagnoses can be efficiently
done based on the concept of conflicts. A conflict for
(SD, COMPONENTS, OBS) is a set {c
1
, ..., c
k
} ⊆ COMPO-
NENTS such that SD ∪ OBS ∪{¬ AB(c
1
), ... ¬ AB(c
k
)}
is inconsistent. A (minimal) conflict thus corresponds
to a (minimal) subset of the components, which, if as-
sumed to behave normally, are not consistent with the
observations. The set of minimal diagnosis for (SD,
COMPONENTS, OBS) can be determined by calculating
the hitting sets (HS) of the set of conflicts for (SD,
COMPONENTS, OBS) using a breadth-first search pro-
cedure, see (Reiter, 1987).
MBD-based Spreadsheet Debugging. The applica-
bility of the MBD principle to spreadsheet debugging
through a translation of the spreadsheet into a Con-
straint Satisfaction Problem (CSP) was demonstrated
by Jannach and Engler (2010) and Abreu et al. (2012).
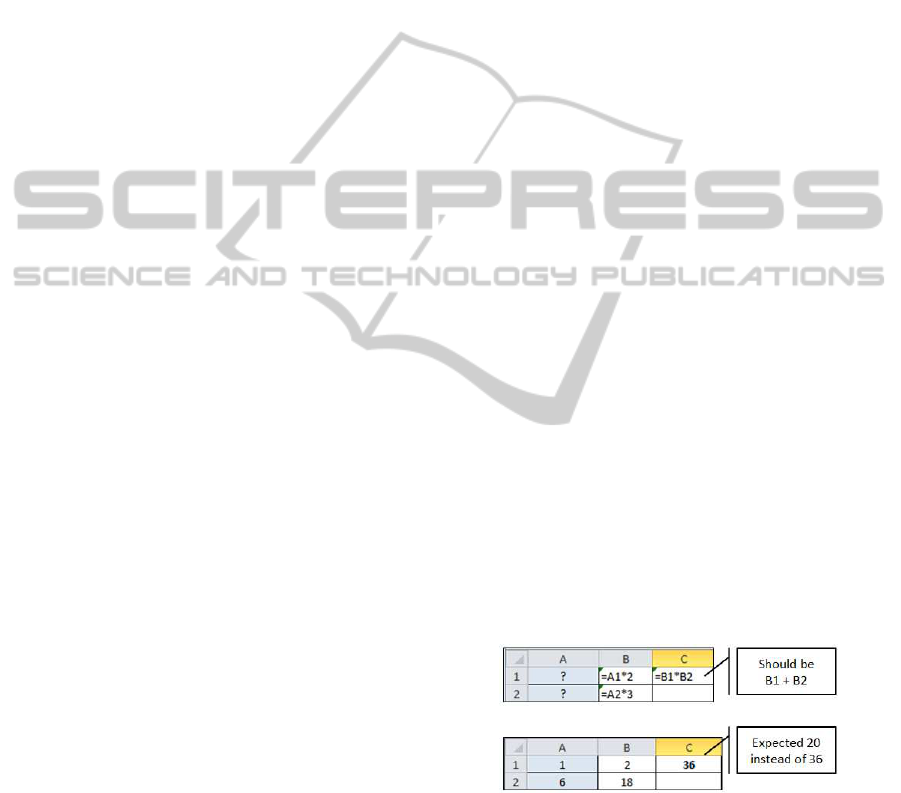
Consider the example shown in Figure 1.
Figure 1: MBD example, cf. (Jannach and Engler, 2010).
The error in the example is that the user has mis-
takenly used a plus in cell C1 instead of a multipli-
cation. During a test with the input values A1=1 and
A2=6, the user thus observes C1=36 as an unexpected
output (instead of C1=20). The user might now mark
the test case with the given inputs and the wrong out-
put in cell C1 as a failed test case. When applying the
MBD paradigm to the spreadsheet problem, the set of
TowardanIntegratedFrameworkforDeclarativeandInteractiveSpreadsheetDebugging
119
components that can be faulty correspond to the set of
spreadsheet cells with formulas {B1, B2, C1}, assum-
ing that the input values are correct. Assuming that
only integer values are allowed, a closer inspection
of the problem reveals that given A2=6 and C1=36,
the formulas in B2 and C1 cannot be correct at the
same time; {B1,C1} therefore represents a minimal
conflict. Thus, the set of possible diagnoses given
the example is therefore { {B1},{C1}}, which actu-
ally includes the cell with the true error.
The computation of conflicts in the CSP-encoded
spreadsheet can be computationally complex. De-
pending on the given problem, the underlying con-
straint solver has to determine at least one solution to
the relaxed constraint problem, that is currently be-
ing checked for consistency. To speed up this pro-
cess, Jannach and Engler (2010) rely on the domain-
independentQuickXPlain algorithm (Junker, 2004) to
efficiently find minimal conflicts.
Challenges of MBD-based Debugging. While the
above-mentionedapproaches demonstrate the general
feasibility of the MBD-based spreadsheet debugging,
some open issues remain. We will sketch three major
ones in the following paragraphs.
Scalability to large problems. Real-world spread-
sheets can be large and complex and contain hundreds
or in some cases even thousands of formulas. Our
own experiments and results reported in the literature
indicate that there are limits with respect to the size
of spreadsheets that can be handled by plain MBD-
approaches within limited time frames. Furthermore,
the observed running times can depend on the domain
sizes for variables in the generated CSP. Finally, the
treatment of real-valued variables has not been previ-
ously discussed in the literature in sufficient depth.
Ranking and discriminating diagnoses. Depend-
ing on the problem and the test cases, the number of
possible diagnoses (called candidates) returned by the
MBD-engine can be large. It might therefore be chal-
lenging or impossible for an end user to inspect all the
possible causes. Therefore, techniques or heuristics
are required to rank the candidates in some form or to
interactively narrow down the number of candidates
and to pinpoint the real cause of the problem.
User interaction design. The debugger interfaces
of integrated SW development environments (IDEs)
like Eclipse can be fairly complex. As the users of
spreadsheets are usually non-programmersand can be
heterogenous with respect to their experience, partic-
ular care has to be taken with respect to visual UI de-
sign, its general complexity and the used metaphors.
Previous approaches such as GOALDEBUG or AU-
TOTEST (Abraham and Erwig, 2006) for example
try to stay within the interactive paradigm of spread-
sheets. Existing MBD-based debugging approaches
have not addressed user interaction issues so far.
4 THE EXQUISITE
FRAMEWORK
Next, we will give an overview of the EXQUISITE
framework, sketch the main architecture, discuss de-
sign considerations and report first experimental re-
sults regarding the efficiency of our new implementa-
tion of MBD-based spreadsheet debugging.
4.1 Architecture Overview
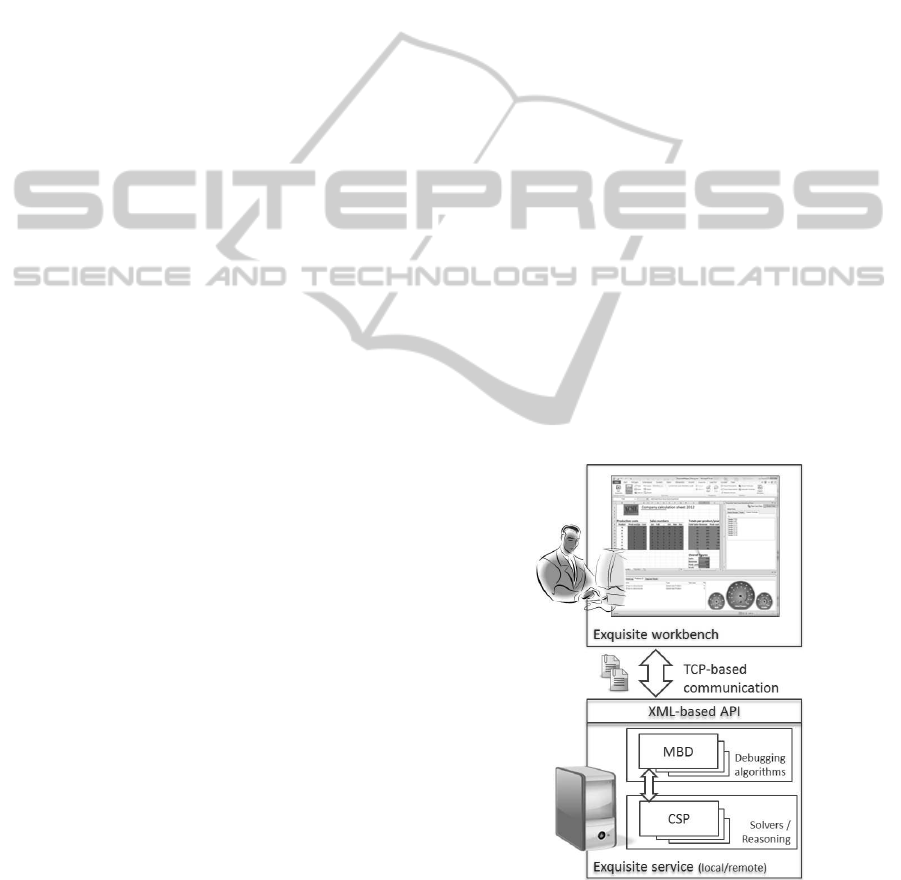
Figure 2 shows an overview of the main components
and the architecture of the EXQUISITE framework.
End User View. During the whole process, the
spreadsheet developer works in his usual environ-
ment, in this case MS Excel. When encountering a
problem, he can switch to the debugging view (the
“workbench”), in which he can specify test cases,
provide additional information for the debugging pro-
cess, or inspect the error candidates as computed by
the diagnosis algorithm. Technically, the workbench
is implemented as an Excel plug-in so that a consis-
tent look-and-feel for the end user is guaranteed.
Figure 2: Exquisite architecture.
Diagnosis Engine. The EXQUISITE service is the
other major component of the framework providing
algorithmic debugging functionality. Currently, the
only supported approach is based on MBD as de-
ENASE2013-8thInternationalConferenceonEvaluationofNovelSoftwareApproachestoSoftwareEngineering
120

scribed above
1
. The framework thus comprises an
implementation of QuickXplain and Reiter’s Hitting
Set algorithm, which is capable of handling multiple
examples as proposed in Felfernig et al. (2004).
As an underlying constraint engine, we use the
Java-based, open source solver Choco. Since the di-
agnosis technique is independentfrom the internals of
the constraint solver, the solver can be exchanged and
replaced by other powerful, commercial tools.
Client-Server Communication. In order to ensure
the modularity of the framework and the exchange-
ability of the components, we have introduced a de-
coupling layer between the C#-based Excel plug-in
and the debugging component. The data exchange be-
tween the client and the server is based on an exten-
sible XML-based format. When the diagnosis engine
is invoked, the current (faulty) spreadsheet is trans-
lated into the exchange format and enhanced with ad-
ditional information such as user-specified test cases,
expected values for cells etc. The information re-
turned by the server is also XML-encoded and usually
contains a ranked list of error candidates. Technically,
the communication is based on TCP so that the diag-
nosis service can either run on the local machine or a
powerful remote server.
4.2 The EXQUISITE Workbench
Figure 3 shows the main functionalities of the end
user view of the debugging environment. For demon-
stration purposes, we have reconstructed the example
spreadsheet from Jannach and Engler (2010), which
we also used for performance experiments.
The Debugging View. Users can start the debugging
view shown in Figure 3 from the EXQUISITE ribbon.
One of the major UI design goals was to leave the user
in his known environment. The original spreadsheet
therefore remains visible all the time. We however
change the background colors of the cells depending
on whether they are input cells (green), intermediate
cells (yellow) or output cells (orange). This way, the
user gets a better overview of the spreadsheet struc-
ture, and at the same time strong visual feedback that
he is now in a certain “debug mode”. In addition, er-
ror types like wrong cell references may already be-
come visible through the visualization.
Test Case Management. In the debug mode, the user
can now specify test cases for the diagnostic reason-
ing process. A test case in that context is different,
1
The framework is however open for the inclusion of
other techniques for spreadsheet debugging including hy-
brids as proposed recently in Hofer et al. (2013).
e.g., from individual unit tests in standard SW devel-
opment and corresponds to what is termed positive
and negative examples in Felfernig et al. (2004). A
“positive test case” means a combination of input and
output cell values which is assumed to be correct. A
“negative test case” is a situation, which is consid-
ered to be wrong by the spreadsheet developer. When
observing the outputs of the calculations as shown in
Figure 1, the user could mark the combination of in-
puts (A1=1, A2=6) and outputs (C1=36) as wrong. If
possible, he could also provide an expected value for
C1, which, together with the inputs, would represent
a positive test case. Note that the provided test cases
do not have to be complete in a sense that values for
all input and output cells must be provided.
In addition to the test cases, the user can mark in-
dividual cell values to be correct or state that certain
formulas are definitely correct independent of a test
case and should thus not be considered in the diag-
nostic process (right panel in Figure 3).
Cell Types and Value Ranges When translating the
spreadsheet into a CSP, one has to decide on appropri-
ate domain sizes for the problem variables, which in
turn can havean effect on the diagnosis running times.
Therefore, EXQUISITE encouragesthe user to provide
additional type and range information for the cells in
particular as spreadsheet systems often do not ask for
explicit types and use their own type inference heuris-
tics. The progress indicators shown in the right lower
corner of the screen shall help to give the user feed-
back on how complete the provided information is.
The list of under-specified cells and other problems
are shown in the “Problems” list in the left lower cor-
ner of the screen. If no information about cell types is
provided, diagnostic reasoning is still possible based
on heuristically determined default ranges and types.
Feedback and Results. Besides feedback on open
problems, the information area in the lower left corner
is also used to display the ranked list of possible error
locations in the spreadsheets (diagnoses). When the
user selects one of the entries, we visualize the cor-
responding cells in the spreadsheet and also show the
cells on which the potentially faulty cell is depending.
Fixing Errors. Once the user has identified a bug in
the spreadsheet, he will leave the debug mode and re-
turn to the original spreadsheet view. As usual also in
standard IDEs and debugging environments, the user
cannot change the program during debugging. Once
the user has made the changes, he can switch back to
the debugging view and run all previously specified
test cases again to check if still some problems exist.
Thus, the EXQUISITE workbench also takes the role
of a (regression) test environment.
TowardanIntegratedFrameworkforDeclarativeandInteractiveSpreadsheetDebugging
121

Figure 3: Exquisite workbench.
4.3 First Evaluation and Discussion
Next, we will discuss the EXQUISITE framework with
respect to the above-mentioned challenges and report
the results of an initial experimental evaluation.
Performance and Scalability. In order to com-
pare our work with previous results, we have re-
constructed the parameterizable evaluation setting
from Jannach and Engler (2010). The spreadsheet
represents a typical sales calculation with incremen-
tally aggregated numbers. To measure the efficiency
for different problem sizes, the number of “products”
(lines in the spreadsheet) can be increased which
leads to an increase in inputs, problem variables and
constraints in the underlying CSP.
The resulting running times are shown in Figure 4.
Similar to the measurement in (Jannach and Engler,
2010), we ran experiments in which we injected one
single fault. In order to avoid effects related to a par-
ticular choice of the injected error we used a slightly
different evaluation procedure. Similar to previous
works on spreadsheet debugging, we used a set of mu-
tation operators (e.g., exchanging a plus by a multipli-
cation symbol) and mutated one or two of the spread-
sheet formulas. Like in (Jannach and Engler, 2010)
we created a single positive test case for each prob-
lem to be diagnosed. The process was repeated 100
times for each problem size. In addition, we shuffled
the order of the constraints before the diagnosis pro-
cess in each iteration as QuickXplain’s running times
can depend on the position of the conflict.
In the tables we report average running times us-
ing a current laptop computer (Intel core i7, 2.3 GHz,
8 GB RAM). Furthermore, we report the resulting
problem sizes in terms of variables and constraints as
well as the average number of constraint propagations
and solution searches. Given the completeness of the
MBD procedure and the given test cases, all injected
errors were found in each problem setting.
The results indicate that the MBD debugging ap-
proach is tractable at least for small to medium sized
problems. The absolute running times are signifi-
cantly lower than those reported in (Jannach and En-
gler, 2010). In order to validate which fraction of the
obtained improvements is due to newer hardware or
later versions of external software libraries, we re-
ENASE2013-8thInternationalConferenceonEvaluationofNovelSoftwareApproachestoSoftwareEngineering
122
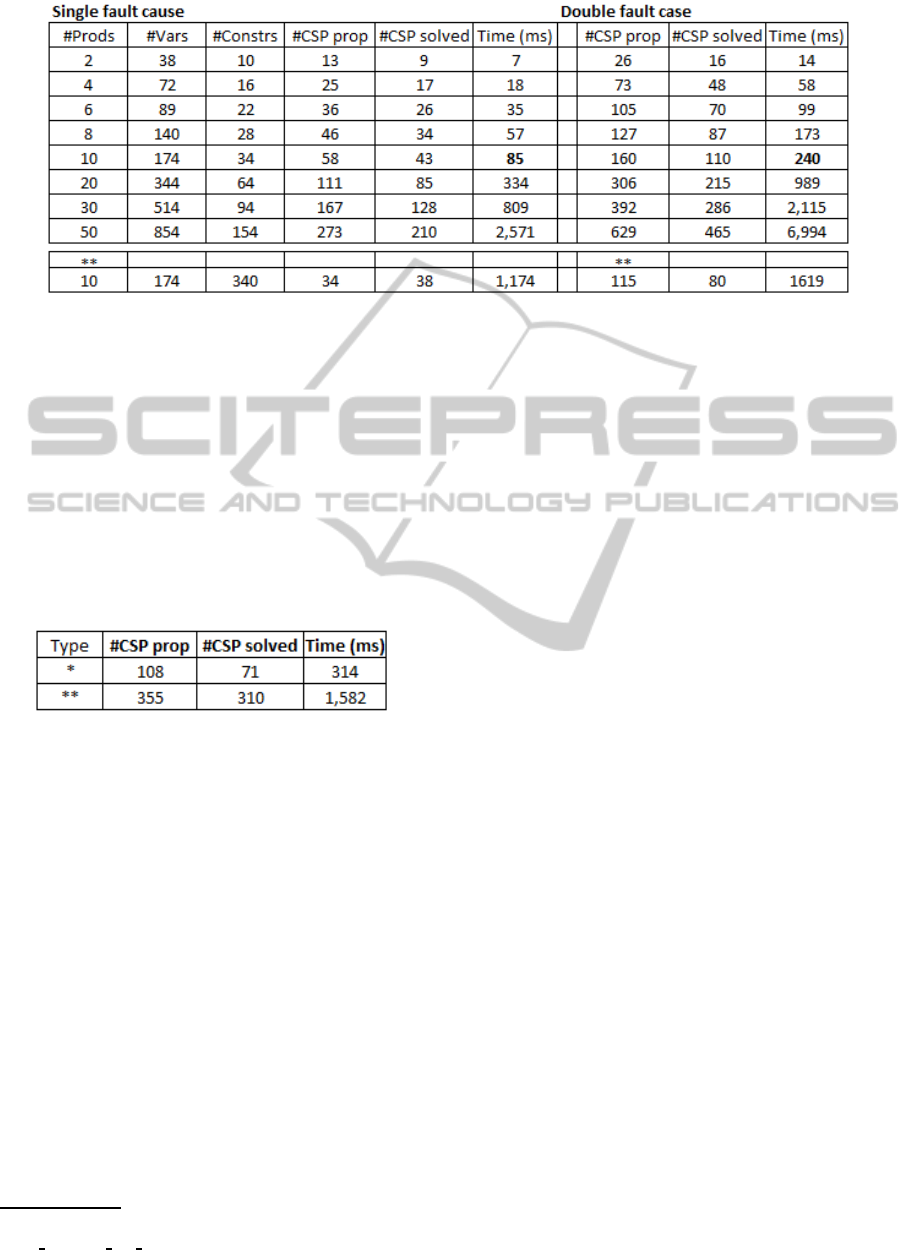
Figure 4: Running times for different problem sizes in ms. (single fault and double fault case). **Numbers obtained using
the implementation of Jannach and Engler (2010) with newer hardware and software libraries.
peated their experiments using their original imple-
mentation on the same test machine and with the latest
versions of any external software libraries each imple-
mentation used in common (in particular Choco).
While the absolute running times using the orig-
inal implementation are also smaller on newer hard-
ware and updated software libraries, see Figure 4, we
can also see our new implementation is, e.g. for the
10-row test case, up to 10 times faster due to a bet-
ter problem encoding and branching heuristic, more
efficient data structures and other engineering efforts.
Figure 5: Running times for real-world spreadsheet in ms
(367 vars, 143 constraints). * Single fault in intermediate
formula. ** Single fault with error in final output formula.
Besides the tests on this artificial spreadsheet, we
also ran experiments for a small set of other real-
world spreadsheets. Figure 5 shows the running times
for such a spreadsheet which can be publicly obtained
from the Web
2
. We again randomly injected program
mutations in the spreadsheet, which contains 224 in-
put cells and 119 formulas. The results in Figure 5
show that EXQUISITE was for example able to detect
a single fault injected in an intermediate formula and
render a diagnosis within an average elapsed time of
378ms. The time for detecting a pathological case
where a single fault was injected in the final total and
thus depends on most other formulas was about 1.5
seconds, which might be still acceptable for an inter-
active debugging session.
The reported running times in (Jannach and En-
gler, 2010) suggest that the number of variables and
2
http://www.score.org/sites/default/files/
Sales Forecast 1yr 0.xls
constraints mainly influences the required running
times. However, when comparing the elapsed times
of the real world and artificially created examples it
becomes obvious that the complexityof the faulty for-
mula – in terms of its number of referenced cells –
as well as its position in the spreadsheet can be even
more important.
Overall, while we see the results as a further in-
dicator for the applicability MBD-based spreadsheet
debugging, further work is required to improve the
scalability of the approach to very complex spread-
sheets. Our current work therefore includes the inte-
gration of parallelized search and the use of alterna-
tive hitting set algorithms.
As for the support of real-valued numbers, the
EXQUISITE framework uses the capabilities of the
Choco constraint engine as an underlying reasoner.
While Choco also has some limitations, the frame-
work’s design allows us to exchange the solver com-
ponent and rely on commercial tools with advanced
capabilities. For the determination of appropriate do-
main sizes, we currently rely on the participation and
feedback from the end user. We however also work on
better heuristics to estimate appropriate domain sizes.
Ranking of Candidates. Currently, EXQUISITE
ranks the diagnosis in increasing order of their cardi-
nality. According to the principle of parsimony, diag-
noses that can explain the unexpected program behav-
ior using less assumedly wrong formulas are there-
fore listed first. However, more work is required in
that context. Our current goals therefore include the
exploration of other ranking heuristics based on for-
mula complexity or on error rate statistics from the
literature.
As part of our future work, we plan to design more
interactive strategies, in which the user is queried by
the system to provide more inputs about the correct-
ness of individual values or formulas. Technically, we
TowardanIntegratedFrameworkforDeclarativeandInteractiveSpreadsheetDebugging
123

plan to investigate if the interactive strategy proposed
in (Shchekotykhin et al., 2012) for ontology debug-
ging can be applied to the spreadsheet domain.
User Interaction. The design goals in particular in-
cluded the provision of a user interface, in which
the spreadsheet developer can stay within the interac-
tion patterns and paradigms of a spreadsheet program.
This way, we hope to keep the required cognitive load
for the end user at an acceptable level. So far, we
however have only anecdotal evidence and feedback
from individual pilot users regarding the usability of
the system. Therefore,we are currently designing lab-
oratory studies with real users to evaluate the practi-
cability of the current approach and to get feedback
on possible improvements to the UI.
5 SUMMARY
Spreadsheet applications can be found everywhere in
organizations and often serve as a basis for business-
critical decisions. Still, the support for the end
user when trying to find errors in large and complex
spreadsheets is still very limited. In this paper, we
have presented the design of the EXQUISITE frame-
work for declarative spreadsheet debugging. The
framework is based on model-based diagnosis tech-
niques as well as a user interface design that should
be usable also by end users who are not IT experts.
A first experimental evaluation regarding the scal-
ability of the implemented MBD technique showed
the general applicability of the approach for small- to
medium sized problems. A systematic evaluation of
the current as well as alternative approaches for rank-
ing diagnosis candidates and for interacting with the
user remain as a part of the ongoing development of
the framework.
REFERENCES
Abraham, R. and Erwig, M. (2006). Autotest: A tool for
automatic test case generation in spreadsheets. In Proc.
VLHCC ’06, pages 43–50, Brighton, UK.
Abraham, R. and Erwig, M. (2007). GoalDebug: A spread-
sheet debugger for end users. In Proceedings ICSE ’07,
pages 251–260, Minneapolis, USA.
Abraham, R. and Erwig, M. (2009). Mutation operators for
spreadsheets. IEEE Trans. Softw. Eng., 35(1):94–108.
Abreu, R., Riboira, A., and Wotawa, F. (2012). Constraint-
based debugging of spreadsheets. In Proc. CIbSE 2012,
pages 1–14.
Brown, P. S. and Gould, J. D. (1987). An experimental
study of people creating spreadsheets. ACM Trans. Inf.
Syst., 5(3):258–272.
Burnett, M., Sheretov, A., Ren, B., and Rothermel, G.
(2002). Testing homogeneous spreadsheet grids with the
”what you see is what you test” methodology. IEEE
Trans. Softw. Eng., 28(6):576–594.
Chadwick, D., Knight, B., and Rajalingham, K. (2001).
Quality control in spreadsheets: A visual approach us-
ing color codings to reduce errors in formulae. Software
Quality Control, 9(2):133–143.
Console, L., Friedrich, G., and Dupr´e, D. T. (1993). Model-
based diagnosis meets error diagnosis in logic programs.
In Proc. IJCAI ’93, pages 1494–1499, Chambery.
Felfernig, A., Friedrich, G., Jannach, D., and Stumptner,
M. (2004). Consistency-based diagnosis of configuration
knowledge bases. Artif. Intell., 152(2):213–234.
Friedrich, G., Stumptner, M., and Wotawa, F. (1999).
Model-based diagnosis of hardware designs. Artif. In-
tell., 111(1-2):3–39.
Galletta, D. F., Abraham, D., Louadi, M. E., Lekse, W., Pol-
lalis, Y. A., and Sampler, J. L. (1993). An empirical study
of spreadsheet error-finding performance. Accounting,
Management and Inf Techn, 3(2):79 – 95.
Hermans, F., Pinzger, M., and van Deursen, A. (2012). De-
tecting code smells in spreadsheet formulas. In Proc.
ICSM, Riva del Garda.
Hofer, B., Riboira, A., Wotawa, F., Abreu, R., and Getzner,
E. (2013). On the empirical evaluation of fault localiza-
tion techniques for spreadsheets. In Proc. FASE 2013,
Rome, Italy.
Jannach, D. and Engler, U. (2010). Toward model-based
debugging of spreadsheet programs. In Proc. JCKBSE
’10, pages 252–264, Kaunas, Lithuania.
Junker, U. (2004). Quickxplain: Preferred explanations and
relaxations for over-constrained problems. In Proceed-
ings AAAI’04, pages 167–172.
Mateis, C., Stumptner, M., Wieland, D., and Wotawa, F.
(2000). Model-based debugging of Java programs. In
Proc. AADEBUG.
Panko, R. R. (1998). What we know about spreadsheet er-
rors. J. End User Comput., 10(2):15–21.
Panko, R. R. and Port, D. N. (2012). End user computing:
The dark matter (and dark energy) of corporate IT. In
Proc. HICSS ’12, pages 4603–4612.
Pemberton, J. and Robson, A. (2000). Spreadsheets in
business. Industrial Management & Data Systems,
100(8):379–388.
Powell, S. G., Baker, K. R., and Lawson, B. (2008). A crit-
ical review of the literature on spreadsheet errors. Decis.
Support Syst., 46(1):128–138.
Reichwein, J., Rothermel, G., and Burnett, M. (1999). Slic-
ing spreadsheets: an integrated methodology for spread-
sheet testing and debugging. In Proceedings DSL’99,
pages 25–38, Austin, Texas.
Reiter, R. (1987). A theory of diagnosis from first princi-
ples. Artif. Intell., 32(1):57–95.
Rothermel, G., Li, L., Dupuis, C., and Burnett, M. (1998).
What you see is what you test: a methodology for testing
form-based visual programs. In Proc. ICSE 1998, pages
198 –207.
Shchekotykhin, K., Friedrich, G., Fleiss, P., and Rodler,
P. (2012). Interactive ontology debugging: Two query
strategies for efficient fault localization. Journal of Web
Semantics, 1213:88 – 103.
ENASE2013-8thInternationalConferenceonEvaluationofNovelSoftwareApproachestoSoftwareEngineering
124
