
A Malfunction Detection Method for Individual Photovoltaic Modules
Masaya Iwata, Yuji Kasai, Eiichi Takahashi and Masahiro Murakawa
National Institute of Advanced Industrial Science and Technology (AIST), Tsukuba Central 2, 1-1-1 Umezono,
Tsukuba, Ibaraki, 305-8568 Japan
Keywords: Photovoltaic Modules, Monitoring, Malfunction Detection, Maintenance, Power Line Communications.
Abstract: Although photovoltaic (PV) modules occasionally fail, it is difficult to identify which module is
malfunctioning. In order to detect malfunctioning PV modules, we have developed a malfunction detection
method for individual PV modules by continuously monitoring their data. This method can automatically
identify a malfunctioning module where output power declines at an early stage. Thus, the method provides
faster and more accurate detection of malfunctions. Moreover, the method considerably reduces workloads
for maintenance personnel because it eliminates the need for conventional inspection procedures to identify
a malfunctioning module. A feature of the method is the utilization of two kinds of information among the
PV modules, namely, spatial and temporal correlations, to distinguish between generation declines due to
some malfunction and those due to climate conditions. To confirm the effectiveness of the method, we
conducted a malfunction-detection experiment with actual data from our PV module monitoring system
which we have already implemented. The experiment used 24 PV modules installed within the monitoring
system, and simulated a malfunction by covering 10% of a module. The system was able to detect the
period of the simulated malfunction, which confirms the effectiveness of the method.
1 INTRODUCTION
Photovoltaic (PV) modules are generally believed to
be maintenance-free and to last for more than 20
years, but, in reality, they occasionally fail because
they are industrial products. Accordingly, PV
modules need to be maintained in terms of their
proper timing. However, it is difficult to identify
which module has a malfunction because existing
PV module systems are only capable of displaying
the overall level of power generation from a system
on a power conditioner. In order to detect
malfunctioning modules at an early stage, we have
developed a malfunction detection method for
individual PV modules by continuously monitoring
their data.
The maintenance of PV module systems is
conventionally carried out by checking the level of
solar energy at a power conditioner, or by checking
for abnormalities with the modules or with the cable
connections, etc. at an installation (Tan and Seng,
2011). However, this method results in delays in
detecting malfunctions, and, additionally, imposes
heavy workloads on maintenance personnel to check
each PV module in turn. Thus, recently, awareness
of the need for malfunction detection techniques has
been growing. For example, some studies consider
automatic fault detection by continually monitoring
output power data (Chouder and Silvestre, 2010;
Polo et al., 2010; Stettler et al., 2006). Moreover,
other studies have been developing a fault detection
technique for each string (Phoenix Contact, 2012;
Onamba, 2010) or a technique for monitoring and
maximizing the output power from PV modules
(Tigo Energy, 2009).
With the method proposed in this paper, each
module is continuously monitored in order to
identify as soon as possible abnormal decreases in
output power that would indicate the emergence of
some kind of malfunction. Thus, detecting declines
in output power is fast and accurate with this
method, and the workloads for maintenance
personnel are considerably reduced because the
method eliminates the need for conventional
inspection procedures to identify a malfunctioning
module. A technical feature of the method is that it
can distinguish between generation declines due to
some malfunction and those due to overcast or
climate conditions. This is achieved by utilizing
correlation information from the PV modules and
179
Iwata M., Kasai Y., Takahashi E. and Murakawa M..
A Malfunction Detection Method for Individual Photovoltaic Modules.
DOI: 10.5220/0004378601790184
In Proceedings of the 2nd International Conference on Smart Grids and Green IT Systems (SMARTGREENS-2013), pages 179-184
ISBN: 978-989-8565-55-6
Copyright
c
2013 SCITEPRESS (Science and Technology Publications, Lda.)
power output data is transformed in to a form that
makes it easy to detect malfunctions. We employ
two kinds of correlation information; namely, spatial
correlations involving comparisons among
neighbour PV modules and temporal correlations
involving comparisons with prior power output data.
The method utilizes a monitoring system for
individual PV modules that we have already
implemented (Nosato et al., 2012; Nosato et al.,
2013). The system can monitor the status of each
module through the installation of inexpensive
dedicated transmitters and a receiver that has been
developed with our original technology.
Furthermore, a merit of the system is that no
additional cables are required for communication
purposes because the method uses the DC power
lines from the PV modules as communication lines.
In the present study, we conduct a detection
experiment for a simulated malfunction with actual
data for the PV module monitoring system, which
confirms the effectiveness of the method.
2 MONITORING SYSTEM FOR
INDIVIDUAL PV MODULES
The method requires a PV module system that is
capable of monitoring the power generated by each
module. We have already developed such a system
(Figure 1) (Nosato et al., 2012; Nosato et al., 2013).
This section provides an outline of the system.
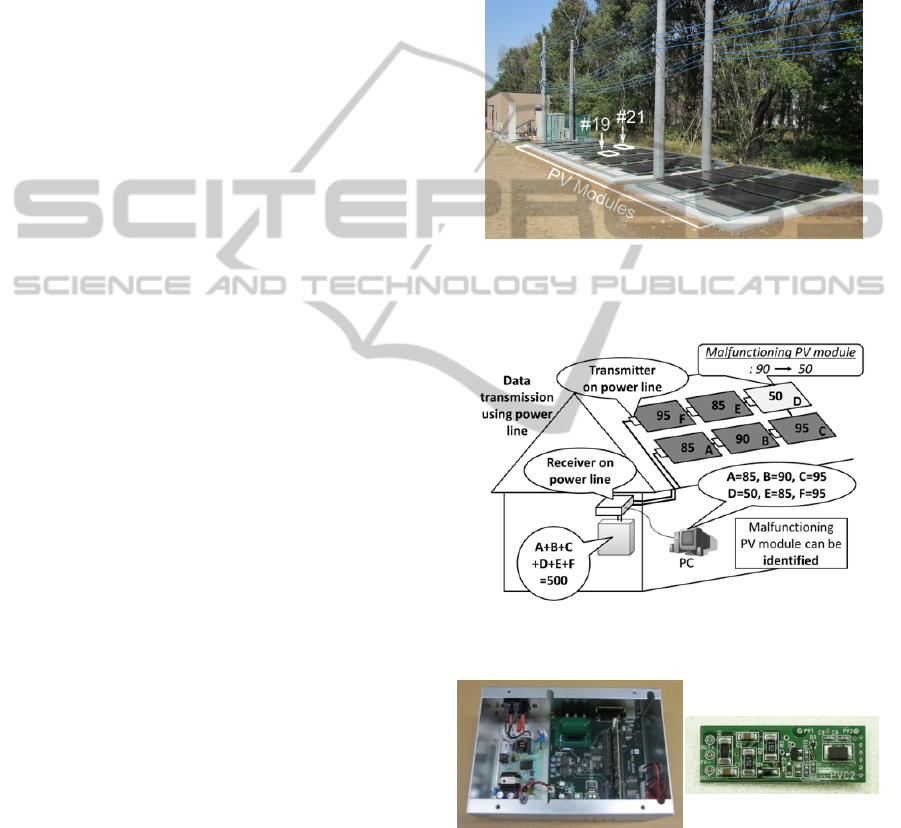
The system monitors the status of power
generation for each module through the installation
of dedicated transmitters and a receiver (Figure 2).
An important advantage of the transceivers is that
the system does not require additional cables for
communication, because the transceivers use the
power lines from the PV modules as communication
lines.
A transmitter (Figure 3) is so small that it can be
installed within a junction box, and a receiver
(Figure 3) is installed on the front of a power
conditioner. For communication, we have developed
a new method that is robust to noise by applying
CDMA (Code Division Multiple Access) technology
which is widely used in wireless communication,
such as mobile phones. Each transmitter measures
the voltage, current, and temperature levels for each
PV module and transmits these data. The receiver
monitors the output power, voltage, current, and
temperature for all the PV modules from the data
received from the transmitters. The receiver is
connected to a PC, where monitoring data are
displayed and saved. This system can monitor data
for up to 50 modules at approximately every 18
seconds. Moreover, the transmitter can be
manufactured with inexpensive commercial parts,
and the manufacturing cost is estimated to be 2 to 3
U.S. dollars when mass produced.
In this study, we conduct a malfunction detection
experiment for individual modules with the
monitoring system.
Figure 1: Photograph of the monitoring system for
individual PV modules (with modules #19 and #21, used
in this paper, highlighted).
Figure 2: Overview of the monitoring system for
individual PV modules.
Figure 3: Transmitter (left, 197 x 140 x 75 mm) and
receiver (right, 14.5 x 42.0 mm) for the PV module
monitoring system.
SMARTGREENS2013-2ndInternationalConferenceonSmartGridsandGreenITSystems
180
3 BASIC CONCEPT OF
MALFUNCTION DETECTION
3.1 Target Malfunction for Detection
In this section we describe the malfunction targeted
for detection in this paper.
PV modules with reduced output power can be
identified with this monitoring technology for
individual PV modules. However, from analyses of
the reasons for power fluctuations with our PV
monitoring system, output levels fluctuate markedly
everyday due to (1) climatic conditions (solar
irradiation and cloud coverage) and (2)
environmental shade from nearby buildings and
trees, etc. Thus, it is necessary to distinguish
between declines due to such factors and decreases
due to a malfunctioning PV module.
Within this paper, malfunction refers to a range
of phenomenon affecting individual modules, from
faults that would require repair to normal
deteriorations in performance over time, as well as
reduced performance due to soil or dirt deposits.
Other causes of declines in output power include
temporary dust covering all modules, such as sand
deposits, and rises in temperature on a module in
summer. However, such factors are beyond the
scope of this paper, because they do not interfere
with the detection of a malfunctioning PV module
due to gradual decreases in output power from the
entire array of modules.
In the present study, we focus on distinguishing
malfunctions from factors (1) and (2) that are
observed on a daily basis with our monitoring
system.
3.2 Approach to Malfunction Detection
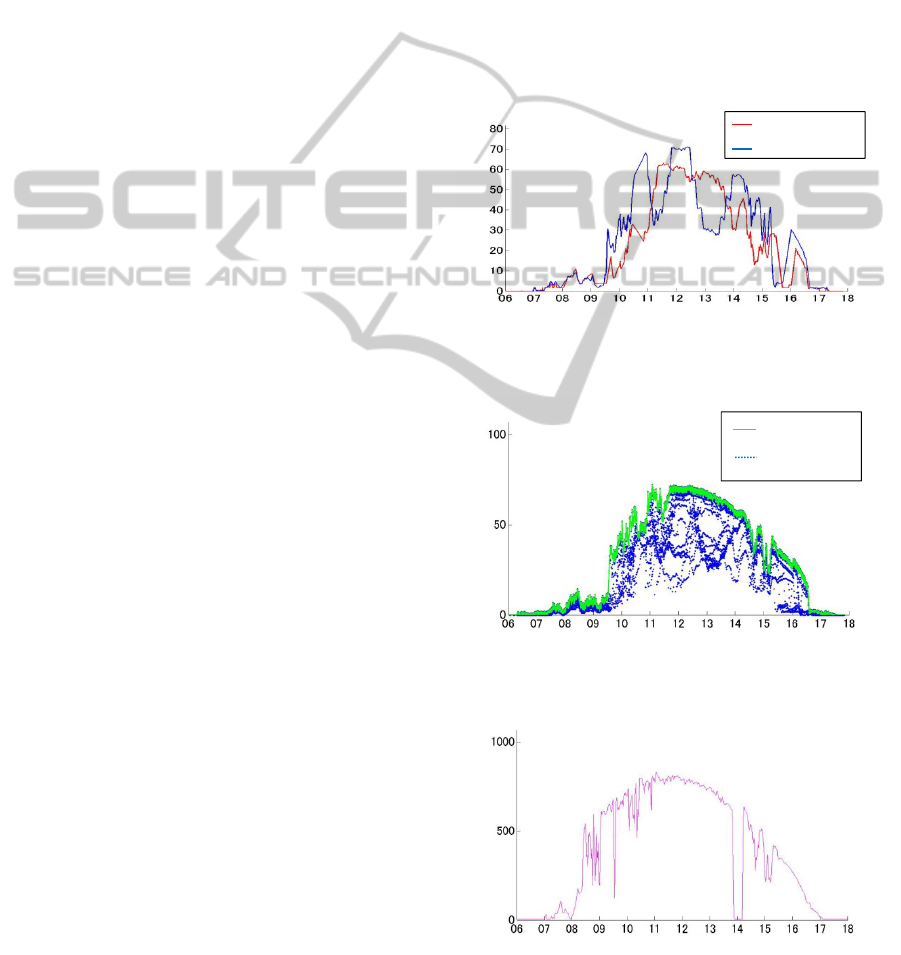
Figure 4 presents graphs for output powers from two
modules on the same day. The graph for module #19
indicates the presence of a malfunction, while the
graph for #21 indicates that output declines are due
to shadow from a utility pole. However, these graphs
also demonstrate how it is difficult to distinguish the
two reasons just from the graphs alone. Moreover,
the objective of this study is to detect as soon as
possible malfunctions at their early stages, which is
a more difficult challenge.
In order to correctly distinguish between them,
our method utilizes correlation information obtained
from simultaneously measuring power data from
each PV module. More specifically, there are two
types of correlation information, relating to spatial
and temporal information. The spatial correlation
information is obtained by comparing the output
power of each module at the same time. In this
paper, the spatial correlation information compares
output powers from the entire array of modules with
each individual module. The temporal correlation
information is obtained by plotting a time series
graph for output powers for each PV module and by
comparing the data in each graph.
By utilizing these two kinds of correlation
information, it is possible to distinguish whether a
decline is due to some malfunctioning of PV
modules or just due to environmental conditions,
such as shadow from buildings or trees. The cause is
illustrated with the following example.
Figure 4: Two examples of output power graphs reflecting
different reasons for the power decreases.
Figure 5: Obtaining a graph of maximum output power.
Figure 6: Graph of solar irradiation (same day as Figure
5).
Power (W)
Time (h)
Module #19
Module #21
Power (W)
Time (h)
Module
Envelope
#1 - #24
Irradiation (W/m
2
)
Time
(
h
)
AMalfunctionDetectionMethodforIndividualPhotovoltaicModules
181
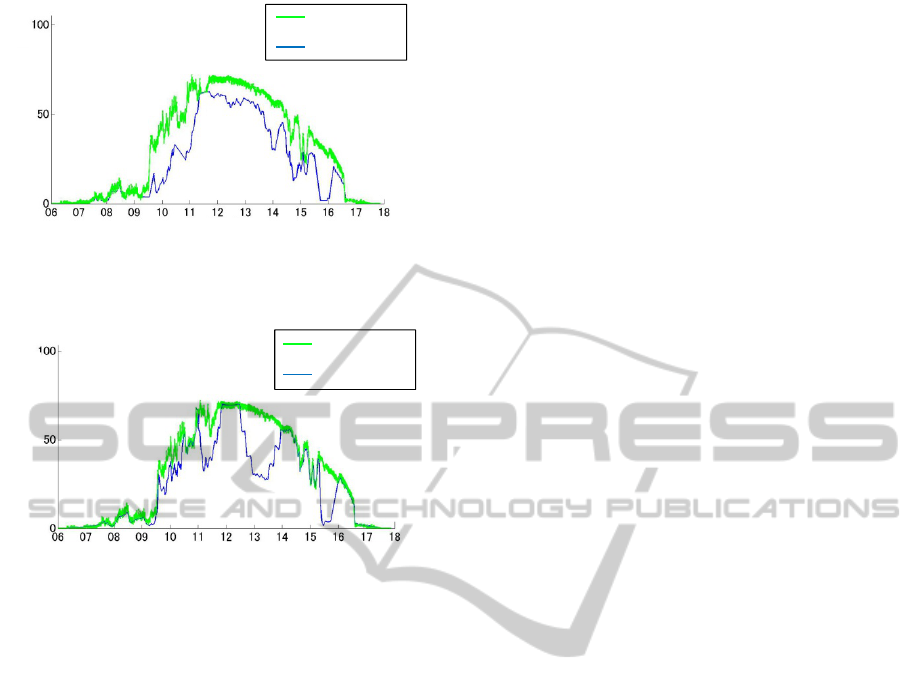
Figure 7: Graph of power output from module #19 and the
envelope.
Figure 8: Graph of power output from module #21 with
many small shadows and the envelope.
In our method, spatial correlation information is
represented as a graph plotting maximum power
levels from all the modules, and by comparing this
graph with similar power level graphs for each
individual module. A graph of maximum power
levels is created by superimposing all the graphs for
the individual modules over a day, and plotting the
envelope, as shown in Figure 5. The shape of the
maximum power output represents an approximation
of solar irradiation (Figure 6), which can be
recognized by comparing the plot shapes in Figures
5 and 6. The graph of the maximum power output is
not affected by shadow falling on some of the
modules, such as that from a utility pole or a house,
because the value is derived from the total area of
the complete PV module system.
Thus, the status of any power declines for an
individual module can be determined by comparing
the temporal graphs for maximum power and for
that particular module. The method is illustrated
with the example in Figure 4, where the power
output declines in the two graphs reflect different
causes. When there is a continuous difference
between two graphs, as shown in Figure 7, it would
indicate a continuous reduction in the power level
from an envelope, which would, in turn, indicate
some malfunction with the module. In contrast,
when two graphs plot similar values over some
periods, despite temporal fluctuations between them,
as shown in Figure 8, it indicates that the power
output fluctuations are due to a shadow passing over
the module.
The procedure for calculating this information is
outlined in the next section.
4 THE MALFUNCTION
DETECTION METHOD
4.1 Overview
The section presents an overview of the malfunction
detection method proposed in this paper. First,
monitoring data relating to output powers from each
module are converted into data adjusting for climate
and seasonal changes. In this paper, we call to this
conversion “normalization”. The normalized data
are converted so that maximum value from all
measured output powers from all modules at each
measurement time is assigned the value of 1. The
normalized data express the output powers relative
to all neighbouring modules based on the spatial
correlation information. Moreover, the time series
graph for each individual module shows the
temporal correlation information for each module.
Then, malfunction detection is conducted by
detecting the modules where the normalized data
values are continually at a reduced level.
4.2 Procedure
The method described in the previous section
consists of the following three steps. The procedure
is easily executed on a PC.
1) Creating maximum output power graphs for all
the modules.
First, time series graphs of all the modules for the
same day are overlaid. Next, an envelope from the
overlaid graphs is plotted (Figure 5). This envelope
represents the maximum output power graph for all
the modules.
2) Creating the normalized data.
The measured output powers are normalized so that
the total value of the envelope, representing the
maximum value, is always assigned a value of 1.
The normalized values are obtained by dividing each
output power by the envelope values for the
corresponding time point. The normalized value
represents an output power that is not influenced by
Power (W)
Time (h)
Envelope
Module #19
Power (W)
Time (h)
Envelope
Module #21
SMARTGREENS2013-2ndInternationalConferenceonSmartGridsandGreenITSystems
182
changes in solar irradiation due to seasonal or
weather conditions. Thus, the modules that have
normalized values that are continuously lower than a
certain value can be detected as possibly
malfunctioning. An example of normalization is
presented in the next section.
3) Detecting modules with continuously reduced
normalized values.
Modules for which the normalized value is
continuously lower than 1 are detected as
malfunctioning. The method of detecting
malfunctioning modules is to plot a graph for each
module for the daily maximum normalized values,
and if a value is lower than some threshold level,
that would be detected.
Results from a detection experiment using this
method are presented in the next section.
5 EXPERIMENT SIMULATING
MALFUNCTION DETECTION
To confirm the effectiveness of the malfunction
detection method, we conducted an experiment that
simulated malfunction detection with actual data
from our PV module monitoring system. The
experiment used Showa-Shell CIS thin film 24 PV
modules that are installed within the monitoring
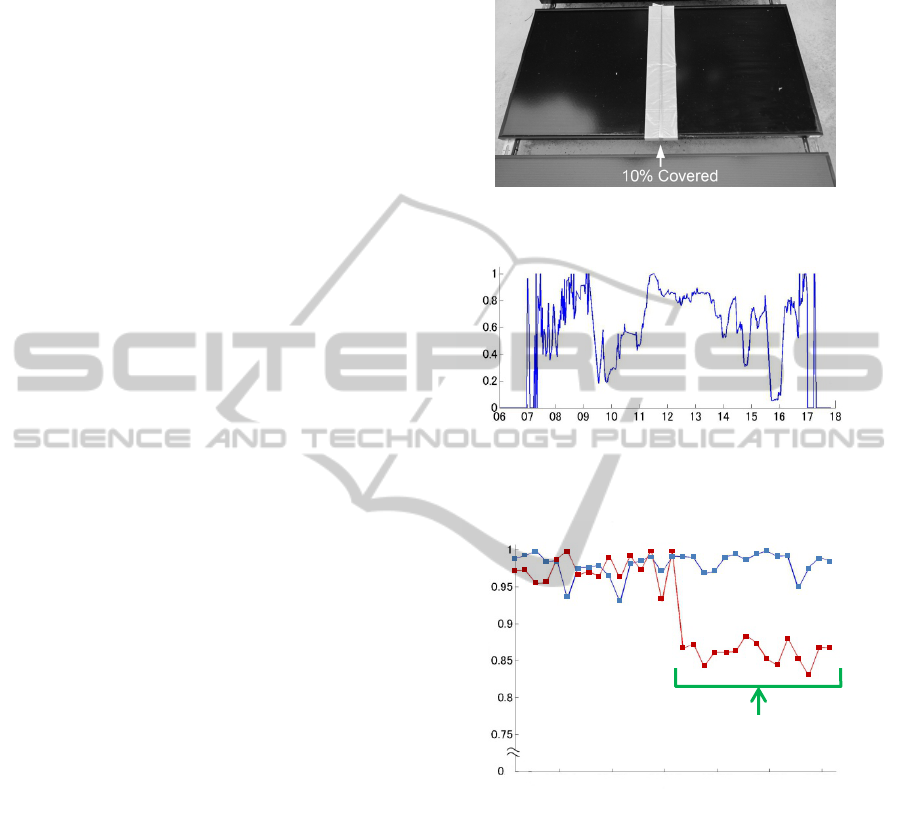
system. The goal of the experiment is to simulate a
malfunction by covering 10% of module #19 (Figure
9) and to detect the period of the simulated
malfunction. The power output from the covered
module decreased only by about 15%, so successful
detection of such a decline would indicate that the
method is capable of detecting malfunctions in the
early stages of malfunctioning.
Figure 7 shown in Section 3 presents a graph for
the power output from the 10% covered module #19.
The data are converted into normalized power values
for easier comparison of power reductions, as
described in Subsection 4.2. Figure 10 presents a
graph of the normalized power values converted
from the data in Figure 7. Graphs for normalized
power are made for all the modules on the days
monitored.
Figure 11 presents the maximum normalized
power output for one day during August 2012 from
the 10% covered module #19, and from module #21
which is a neighbouring module that is
representative of the normal modules. The maximum
normalized values on the graph are calculated from
the daily data for the interval from 1 pm to 5 pm,
because there is relatively little shadow during that
interval.
Figure 9: PV module #19 with covering of 10% total area.
Figure 10: Graph of the normalized power values for
module #19.
Figure 11: Experimental result.
Ten percent of the surface of module #19 was
continuously covered from August 16, and that
resulted in a continuous reduction in the level of
power output. Figure 11 shows that the maximum
normalized values were close to 1 prior to partial
coverage, but that once the cover was in place, the
maximum normalized values decreased to
approximately 0.85. This graph clearly indicates that
the level of power output from this module was
lower from the start of the experiment, and that this
simulated malfunction can be detected by setting a
detection threshold of 0.9 for the maximum
normalized power. This result confirms that our
Normalized Power
Time (h)
#19: 10% covered
Normalized Power
#19
#21
Date
1 5 10 15 20 25 30
Aug.
AMalfunctionDetectionMethodforIndividualPhotovoltaicModules
183

method is capable of detecting an individual PV
module with a loss of approximately 15% in power
output. This result also shows that a module where
the level of power outputs begins to decline can be
detected as potentially malfunctioning.
6 DISCUSSION
In this experiment, we only utilized the spatial
correlation information in comparing the power
output with the maximum power for the entire
modules and the power levels for each individual
module. However, there are various kinds of spatial
correlation information, such as correlations
between neighbouring module groups or between
individual modules. In particular, modules within
the same string tend to be highly correlated because
they mutually influence voltages within the same
current. The attainment of better malfunction-
detection performance by utilizing more complex
forms of spatial correlation information will be
tackled in future research.
The present experiment focused on a malfunction
where the level of power output suddenly decreases,
but there are other forms of malfunctioning, such as
gradual decreases in output power. In those
situations, it is not possible to detect the malfunction
until a certain level of decrease is reached. But once
it has been reached, our method can detect such
malfunctions.
In the present paper, we have focused only on
power, which is the representative value of output
within the solar energy data. However, we may
expect even faster and more accurate malfunction
detection performance by using other values, such as
voltage, current, and temperature. We will continue
to consider the utilization of such values for the
detection of malfunctioning PV modules.
Our method can be applied to mega-scale solar
systems by changing the unit of measurement from
the single module to a string of modules. In the
future, we are planning to apply the method to a
mega-scale solar system.
7 CONCLUSIONS
In this study, we have developed a method of
malfunction detection using a monitoring system of
the individual PV modules. The method makes it
possible to detect malfunctions in their early stages
in terms of slight declines in the levels of power
output from a PV module, which it has been very
difficult to be aware of previously. We confirmed
the effectiveness of the method through a detection
experiment for a simulated malfunction using actual
data from our monitoring system for individual PV
modules. In the future, we plan to explore the
application of our method to mega-scale solar
systems.
ACKNOWLEDGEMENTS
We would like to thank Prof. F. Kano in Oyama
National College of Technology for valuable
discussions.
REFERENCES
Tan, D. and Seng A. K., 2011. Handbook for solar
photovoltaic (PV) systems, Energy Market Authority.
Chouder, A. and Silvestre, S., 2010. Automatic
supervision and fault detection of PV systems based
on power losses analysis. In Energy Conversion and
Management, 51, pp. 1929-1937, Elsevier.
Polo, F. A. O., del Rosario, J. J. A. and Garcia, G. C.,
2010. Supervisory control and automatic failure detec-
tion in grid-connected photovoltaic systems. In N.
Garcia-Pedrajas et al. (Eds.): IEA/AIE 2010, Part I,
LNAI 6096, pp. 458-467, Springer.
Stettler, S., Toggweiler, P. and Remund, J., 2006. SPYCE:
satellite photovoltaic yield control and evaluation. In
21st European Photovoltaic Solar Energy Conference,
pp. 2613-2616.
Phoenix Contact GmbH & Co. KG, 2012. String
monitoring in photovoltaic systems, [online]
Available: http://www.phoenixcontact.com/global/
signal-level-matching/242_66017.htm.
Onamba Co., Ltd., 2010. Photovoltaic intelligent monitor-
ing system (in Japanese). [online] Available:
http://www.onamba.co.jp/pdf/monitor_catalog.pdf.
Tigo Energy, Inc., 2009. Tigo Energy MaxiManager soft-
ware data sheet. [online] Available: http://
www.tigoenergy.com/sites/default/files/attachments/
software.pdf.
Nosato, H., Kasai, Y., Takahashi, E. and Murakawa, M.,
2012. A very low-cost low-ffrequency PLC system
based on DS-CDMA for DC power lines. In 16th
IEEE International Symposium on Power Line
Communications and Its Applications (ISPLC2012).
pp. 398-403, IEEE.
Nosato, H., Kasai, Y., Iwata, M., Takahashi, E. and Mura-
kawa, M., 2013. The development of the individual
photovoltaic module monitoring system using power
line communication. In The Transactions of the
Institute of Electronics, Information and
Communication Engineers (in Japanese), J96-D (3) (in
press), IEICE.
SMARTGREENS2013-2ndInternationalConferenceonSmartGridsandGreenITSystems
184
