
A Machine Vision based Lumber Tracing System
Riku Hietaniemi, Sami Varjo and Jari Hannuksela
Center for Machine Vision Research, University of Oulu, Oulu, Finland
Keywords:
CS-LBP, Usurf, Projection Signal, 1-D Alignment.
Abstract:
In this paper, we introduce a machine vision system for wooden board tracing in sawmills. The goal is to
match images taken from boards in the beginning and at the end of the manufacturing process in order to
track the movement of individual boards. The task is challenging due to the changing appearance of boards
during the process. These are changes in color, texture and physical form. Lighting conditions and camera
parameters are also unknown and can change between different camera systems inside a sawmill. Before
matching, image alignment is carried out using 2-D to 1-D projection signals. Signals are generated using
the statistical properties of gray scale images. Aligned images are then matched using fast and compact local
descriptors. The performance of the system was evaluated using over 1000 real life images captured with
visual quality control cameras integrated into the production line. A tracing accuracy over 95% was achieved
with a high confidence of the individual match.
1 INTRODUCTION
With advances in measurement technologies, we are
approaching a point where it is possible to trace wood
all the way from the harvesting location to a final
product. Tracing reveals important information about
how the whole wood refinement process and the effi-
ciency of the supply chain can be improved. For ex-
ample, by backtracking the logs and boards sawmills
will learn which harvesting areas produce the highest
quality raw material.
One part of the tracking chain is inside the
sawmill. In the beginning of the process boards pass
under a line or matrix camera system for quality and
dimensional measurement. At the end, before pack-
ing, boards pass under a second camera system for
the final visual quality classification. A system that
can detect when a board has passed through the pro-
cess is needed so that the board can be traced back to
the log it was sawn from.
The traditional way of object identification in
mass production is the use markers such as bar codes,
that are added to the product. For example, commer-
cial products for lumber tracing using painted iden-
tifiers are available. RFID tags (Sirkka, 2008) are
also becoming an attractive option due to advances
in wireless technologies. In addition, previous re-
search also includes the use of microwave signatures
(Fuentealba et al., 2004).
In this paper, however, we present the first ap-
proach using only features extracted from images.
Compared with the other systems, which require ad-
ditional equipment to be installed, camera based so-
lutions need only additional software, since the same
cameras that carry out the visual inspection can be
used. This makes it possible to increase the total yield
of a sawmill with only minimal investments.
Typically, the image based quality classification
of boards is based on knot sizes and locations, color,
shakes and other visible defects (Gu et al., 2010).
However, these properties alone are not suitable for
robust matching because of the changes taking place
during the process. Although grain patterns in the
board can experience some slight changes, we found
out that these patterns are a good basis for tracing.
Figure 1 shows an example of these patterns.
Finding a matching pair of two images for the
same board is a challenging problem due to notable
changes that the manufacturing process imposes on
the appearance of the board. There are two types of
changes: actual changes in the board itself caused by
the process and camera induced changes such as lens
distortion and focus blur. It is also highly unlikely
that the lighting conditions are similar for all cameras.
Different sawmills have different camera systems and
in some cases all the cameras installed at one site can
be of different types. Figure 2 shows some of the main
anomalies including changes in color and surface tex-
98
Hietaniemi R., Varjo S. and Hannuksela J..
A Machine Vision based Lumber Tracing System.
DOI: 10.5220/0004279300980103
In Proceedings of the International Conference on Computer Vision Theory and Applications (VISAPP-2013), pages 98-103
ISBN: 978-989-8565-48-8
Copyright
c
2013 SCITEPRESS (Science and Technology Publications, Lda.)
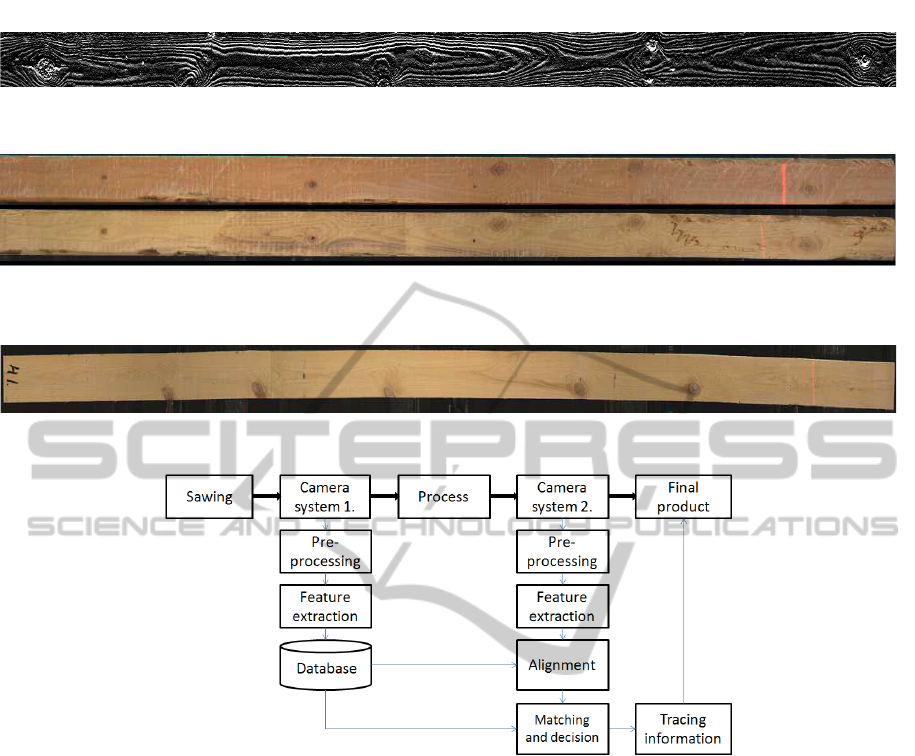
Figure 1: An example of a grain pattern image. Strongest grain are clearly visible.
Figure 2: Typical changes in the appearance of the board caused by the process. Board in the beginning up / board in the end
down.
Figure 3: An example of physical change experienced by a board.
Figure 4: Layout of the production line and tracing components.
ture. Figure 3 presents a case where the physical form
of the board is altered.
In our contribution, we present a complete sys-
tem framework for tracing wooden boards inside a
sawmill. A suitable method for fast image alignment
was implemented using 2-D to 1-D projection signals.
The required preprocessing steps for images are de-
scribed. For matching, we evaluated two different de-
scriptors that are claimed by their original authors to
be fast and compact. Tracing performance of the sys-
tem was finally tested using real life images obtained
from the production line of a sawmill.
2 BOARD TRACING METHOD
The proposed method is divided into three main
phases. Images are first preprocessed, resulting in a
cropped gray scale image of a section of a board. For
images taken in the beginning of the process, features
are extracted from the board and stored to a database
together with a 1-D signal which is used for align-
ment later. For images taken at the end of the pro-
cess, 1-D signal is first formed and the translation be-
tween images is calculated. After the image align-
ment, features are extracted from the corresponding
area. Matches between camera system 1. and camera
system 2. (see Figure 4) are searched for by calculat-
ing the Euclidean distance between the final feature
matrix and feature matrices stored in the database.
Figure 4 illustrates the layout of the production line
and the tracing system.
To be able to run board tracing at full production
speed numerous things have to be taken into consid-
eration. Firstly, the amount of raw image data is mas-
sive, in this case over 16 MB per board. Secondly, the
time that is allowed for feature comparison is only a
few hundred milliseconds for high production speeds.
The database can contain thousands of boards mean-
ing that the computational complexity of the match-
AMachineVisionbasedLumberTracingSystem
99
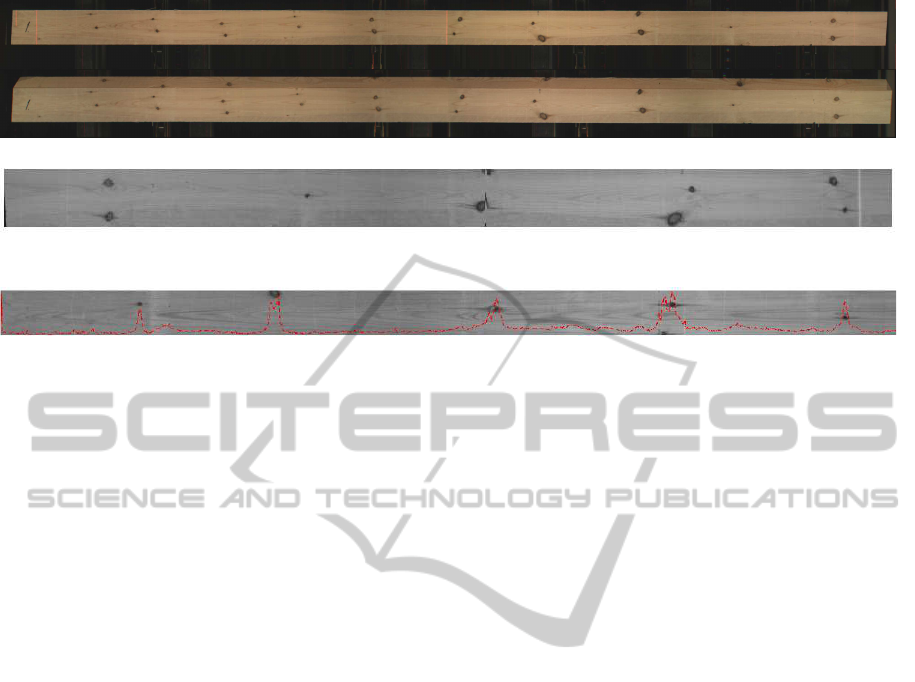
Figure 5: Original and result images of preprocessing.
Figure 6: A cropped section of a board with 1-D projection signal plotted over.
ing has to be low. Also, the need to store thousands
of boards sets limits on the amount of data that can be
used in the matching stage.
2.1 Image Preprocessing
The preprocessing stage is comprised of gray color
transformation, cropping,segmentation, straightening
and background removal. The original raw data for
one board was a 6400 x 600 pixel RGB color image
containing the flat and side/flat view of the board. The
bottom 300 pixels containing the flat/side view is im-
mediately cropped. The remaining area is converted
to a gray scale image.
From the gray scale image the corners of the right
hand side of the board are searched for using thresh-
olding in a small sliding window. After the end of the
board is found, a smaller section of N x 300 pixels
is cropped, where N is the final width of the required
image area. From this cropped section, the left hand
side corners are searched for and the board is straight-
ened by removing background pixels above the board
and moving each row upwards equal to the removed
pixels.
Although straightening induces some geometrical
distortions because of the straightforward nature of
the algorithm, no incorrect matches were observed
due to straightening errors. Straightening also re-
moves the need for y-directional alignment since the
whole height of the board is utilized later in the fea-
ture extraction.
2.2 Feature Extraction
For an application which has strict data storage and
computational time requirements the features used
need to be compact and fast to compute. The two
descriptors chosen here, Center-Cymmetric Local Bi-
nary Pattern (CS-LBP) (Heikkil¨a et al., 2009) and
Upright Speeded-Up Robust Feature (U-SURF) (Bay
et al., 2008), are both modified, faster versions of al-
ready compact and computationally inexpensive solu-
tions. These descriptors are favorable due to the na-
ture of the problem. Boards move through the process
in a fixed position, eliminating the need for rotation
invariance. Also, as stated earlier, most of the infor-
mation lies in the grain patterns which are closely re-
lated to the gradients in images. U-SURF is formed
using gradient information while CS-LBP is claimed
by the original authors to have ”gradient like proper-
ties”.
Multiple feature vectors were calculated for each
image using W subareas. The size of one subarea is h
× w, where h was chosen to be the height of the board
in pixels to utilize the maximum amount of local in-
formation. Different subarea widths w were tested to-
gether with different amounts of subareas W. When
using large subareas, the information stored inside
one descriptor is mainly from grain patterns and local
defects such as knots have a smaller effect, whereas
small subareas concentrate on the finer detail.
Since the desired feature vector length in our ap-
proach is short, based on our tests, narrow subareas
offer the best matching accuracy. The effect of w ver-
sus matching accuracy is further illustrated in Exper-
imental results (Figure 8).
CS-LBP feature vectors are formed by compar-
ing opposite intensity values instead of comparing a
single intensity value with the center pixel, which is
the original local binary pattern method (Ojala et al.,
2002). Feature descriptors used in our work were
formed using the method presented in (Heikkil¨a et al.,
2009). A radius of 1 and neighborhood of 8 was used
together with 2 × 2 subgrid and 16 bin histogram pro-
VISAPP2013-InternationalConferenceonComputerVisionTheoryandApplications
100

ducing a feature vector with the length of 64. A 4 × 4
subgrid is also common but in order to keep the fea-
ture vector length short the histogram bin count would
be reduced. In our tests, we obtained better matching
accuracy using fewer subgrids and a larger number of
histogram bins.
U-SURF features were formed in a similar man-
ner, except for the size of the subgrid which was set
to 4x4. The vector describing each subgrid contains
four values making the length of the final feature vec-
tor for U-SURF also 64. A detailed explanation of the
method can be found in (Bay et al., 2008).
2.3 Alignment
To ensure that the subareas are correctly matched to-
gether, alignment of the input images is required. A
small offset is tolerated, as demonstrated later in the
results section, meaning that sub-pixel accuracy is not
needed. In order to keep the alignment process data
storage space and computational complexity require-
ments low, a 2-D to 1-D projection is utilized (Alliney
and Morandi, 1986).
The steps included in the alignment process are
following:
1. A 1-D signal is formed from the image by calcu-
lating the standard deviation of each image row.
2. The spatial difference between signals is calcu-
lated using phase correlation or cross correlation.
3. The image taken at the end of the process is
shifted according to the difference found.
Because we are interested in the translation in the
longitudinal direction the 1-D signals are formed in
an x-direction only. Multiple projection types were
tested, including the minimum and the maximum val-
ues for columns as well as column sums. Due to the
nature fo the material in hand, these projection strate-
gies do not offer sufficient discriminative qualities for
signal generation. Using the standard deviation for
each column improved robustness considerably. An
example of how the projected signal is related to the
appearance of the board can be seen in Figure 6. As
we can see from the figure, defects and anomalities
like knots produce the highest variations to the gener-
ated signal.
The extracted 1-D vector can be used to determine
horizontal displacement with both the cross correla-
tion and the phase correlation (Stone, 2011). The sig-
nal background variations were smoothed using a low
pass filtering with zero mean and unit variance nor-
malization. The filter border effects were removed
by zeroing the ends of the signal at the half length
of the filter. The cross correlation can be calculated
as a convolution of two signals where one of them
one is reversed. With the phase correlation, the sig-
nals are Fourier transformed, the phase difference
data is extracted, and the phase difference data can
be turned into cross phase correlation by using an in-
verse Fourier transformation. The offset can be deter-
mined by finding the index of the maximum value in
the correlation data. Detailed descriptions of both of
the methods can be found in (Stone, 2011).
Correlation techniques offer a fast and compu-
tationally inexpensive way to carry out the align-
ment. They have been widely utilized in different
machine vision applications for years and highly opti-
mized mathematical frameworks have been presented
for both methods (Agarwal and Cooley, 1977; Loan,
1992).
3 EXPERIMENTAL RESULTS
3.1 Test Material
The test material consisted of two sets: 1003 images
taken in the beginning and 495 images taken at the
end of the process. All boards were sawn from Nordic
pine, pinus sylvestris. Images were obtained from the
real production line of a sawmill. To verify the match-
ing results, an identification number was added to ev-
ery board. Image sections were cropped from boards
in a way that the identification number was not visi-
ble in the matching process. There were boards with
two different widths and multiple lengths. Board di-
mensions were not used in any way for matching. All
tests presented here are Matlab simulations.
3.2 Alignment
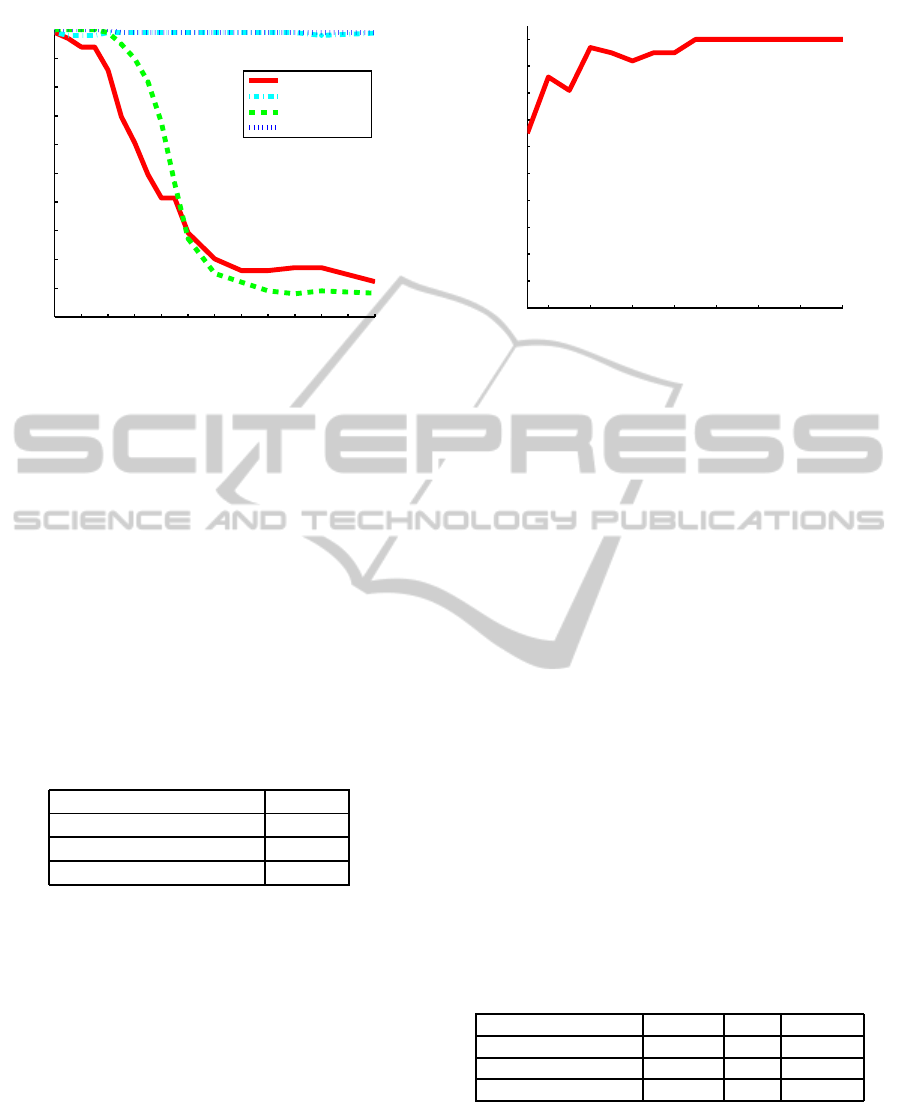
To study the robustness of the method against
board misalignment, without the proposed alignment
method, the offset was varied between 0 and 250 pix-
els with a sample size of 100 image pairs. The graph
in Figure 7 shows that the U-SURF is more sensi-
tive to misalignment than the CS-LBP. The U-SURF
matching accuracy is immediately affected, and de-
creases sharply after an 18 pixel offset, while CS-LBP
performance stays almost unaffected until 20 pixels.
The subarea width w used was 100 pixels, which
roughly translates to a offset tolerance of 20% for CS-
LBP. To confirm the results the test was run again us-
ing 50 pixels as a value for w. CS-LBP matching ac-
curacy started to decline slightly after a 10 pixel off-
set, confirming 20% tolerance.
In order to evaluate the proposed alignment
method, images were warped with a known offset for
AMachineVisionbasedLumberTracingSystem
101
0 10 20 30 40 50 60 70 80 90 100 110 120
0
10
20
30
40
50
60
70
80
90
100
Offset [pixels]
Matching Accuracy [%]
USURF No Reg
USURF Reg
CSLBP No Reg
CSLBP Reg
Figure 7: Matching performance with and without image
alignment.
ground truth. When considering alignment within 10
pixels as an acceptable result, using the standard de-
viation based projection signals, the phase correlation
yielded a 95.8% success rate and the cross correla-
tion a 95.6% success rate with only a 0.2% difference.
When the projection signals were formed using the
minimum value of each image column, the alignment
was successful in 91.8% of the cases. Using the sums
of the image columns produced a correct alignment
only for 64.0% of the boards. The results are summa-
rized in Table 1.
Table 1: Successful phase correlation alignment for differ-
ent projection signals. Alignment error less than 10 pixels
is considered to be success.
Projection type Acc. %
Standard deviation 95.8
Minimum column value 91.8
Column sum 64.0
3.3 Subarea Width
The subarea width w has a major effect on the match-
ing accuracy. If there is no alignment error, the re-
quired width is small. The matching accuracy versus
subarea width w is presented in Figure 8.
In this case, a width of 13 pixels was enough to
produce the best possible results. In reality, w has to
be set larger because of the small remaining alignment
errors and a larger comparison group. The proposed
alignment method typically leaves a small alignment
error of 0-10 pixels. To compensate for this, and fur-
ther increase the confidence of the match, a subarea
width w of 50 pixels was chosen. Width of 50 pixels
provides the needed tolerance of 10 pixels.
6 8 10 12 14 16 18 20
0
10
20
30
40
50
60
70
80
90
100
Subarea width w [pixels]
Matching Accuracy [%]
Figure 8: The effect of subarea width on matching accu-
racy for CS-LBP method (100 board sample size, total of
15 subwindows).
3.4 Tracing Performance
The final tracing performance depends on several fac-
tors: alignment, the number of subareas used W and
subarea width w. The size of w was set to 50 pixels
and the minimum required number of subareasW was
searched. Performance started to decline after 15 sub-
areas. Performance for CS-LBP features calculated
from a gray scale and a gradient image as well as U-
SURF features are presented in Table 2. The length of
the feature vector for all of the methods was 64. For
all the results presented in the table, an w of 50 and W
of 15 was used.
To evaluate the confidence of the matches, a dis-
tance ratio R
C/I
was calculated by dividing the dis-
tance between the best and the second best match for
correct matches, D
12C
, with the corresponding dis-
tance for incorrect matches, D
12I
. Also, the percent-
age of correct matches, for which the Euclidean dis-
tance between the best and the second best match is
greater than the maximum distance in the case of an
incorrect match, D
C>I
, is presented.
Table 2: Tracing performance.
Method Acc. % R
C/I
D
C>I
%
CS-LBP 89.3 10 90
CS-LBP (gradient) 96.2 12 98
U-SURF 96.6 9 86
From the table, we can see that the overall match-
ing accuracy for both of the descriptors is high. Us-
ing a gradient image instead of a gray scale image
increased the accuracy of CS-LBP based matching
considerably. While the matching accuracy of the de-
scriptors is similar, the CS-LBP has a slightly better
confidence of match.
VISAPP2013-InternationalConferenceonComputerVisionTheoryandApplications
102

4 CONCLUSIONS
In this paper, we presented the first machine vision
based board tracing system to be used in a sawmill
to track when a particular board has completed the
manufacturing process. This is one important part of
the chain from raw material to final products. The
proposed system was evaluated using real life images
and was it able to find a correct match for over 96% of
the tested 495 images from a test set of 1003 images.
We proposed a projection signal based alignment
method, which increased the robustness of the system
considerably. Instead of using column sums, standard
deviation of the column was used to create the 1-D
signal. If the alignment accuracy is improved while
keeping the computational complexity low, smaller
subarea widths can be used, thus lowering the total
number of operations required.
The use of gradient images increased the accu-
racy and confidence of the CS-LBP based method.
One possible explanation for this is the material itself.
Grain patterns are unique to different boards, similar
to fingerprints. When the feature vector length was
increased the benefit from gradient images started to
decline, and with 256 long vectors, the matching ac-
curacy was the same. Both of the descriptors are com-
putationally inexpensive and they are well suited for
an application where real-time performance is a criti-
cal parameter.
For future work, implementation using parallel
computing needs to be considered. Accelerated meth-
ods for database queries and comparisons, as well
as strategies for limiting the number of feature ma-
trix comparisons, can offer a significant increase in
the total system performance. Initial pruning of pos-
sible candidates for matching can be started in the
alignment state. Also, a new ORB descriptor (Rublee
et al., 2011), which is claimed by original authors to
be tens of times faster than the SURF method, should
be tested in this application. Fingerprint matching
techniques could also be well suited for this kind of
task.
The described system was targeted here to be used
inside sawmills although it is not in any way limited
to that application area.
REFERENCES
Agarwal, R. and Cooley, J. (1977). New algorithms for dig-
ital convolution. Acoustics, Speech and Signal Pro-
cessing, IEEE Transactions on, 25(5):392 – 410.
Alliney, S. and Morandi, C. (1986). Digital image registra-
tion using projections. IEEE Transactions on pattern
analysis and machine intelligence, PAMI-8(2):222–
233.
Bay, H., Ess, A., Tuytelaars, T., and Gool, L. V. (2008).
Speeded-up robust features (SURF). Computer Vision
and Image Understanding, 110(3):346–359.
Fuentealba, C., Simon, C., Choffel, D., Charpentier, P.,
and Masson, D. (2004). Wood products identifica-
tion by internal characteristics readings. In IEEE In-
ternational Conference on Industrial Technology, vol-
ume 2, pages 763–768.
Gu, I. Y.-H., Andersson, H., and Vicen, R. (2010). Wood
defect classification based on image analysis and sup-
port vector machines. Wood Science and Technology,
44(4):693–704.
Heikkil¨a, M., Pietik¨ainen, M., and Schmid, C. (2009). De-
scription of interest regions with local binary patterns.
Pattern Recognition, 42(3):425–436.
Loan, C. V. (1992). Computational Frameworks for the fast
Fourier transform. SIAM Publications.
Ojala, T., Pietik¨ainen, M., and M¨aenp¨a¨a, T. (2002). Mul-
tiresolution gray-scale and rotation invariant texture
classification with local binary patterns. IEEE Trans-
actions on Pattern Analysis and Machine Intelligence,
24(7):971–987.
Rublee, E., Rabaud, V., Konolige, K., and Bradski, G.
(2011). Orb: an efficient alternative to sift or
surf. International Conference on Computer Vision,
Barcelona.
Sirkka, A. (2008). Modelling traceability in the forestry
wood supply chain. In IEEE International Conference
on Data Engineering Workshop, pages 104–105.
Stone, H. S. (2011). Image Registration for Remote Sens-
ing: Chapter 4 - Fast correlation and phase correla-
tion. Cambridge University Press.
AMachineVisionbasedLumberTracingSystem
103
