
Template Ageing in Iris Recognition
Adam Czajka
1,2
1
Institute of Control and Computation Engineering, Warsaw University of Technology, Warsaw, Poland
2
Biometrics Laboratory, Research and Academic Computer Network, Warsaw, Poland
Keywords:
Biometric Template Ageing, Iris Recognition, Biometrics.
Abstract:
The paper presents an iris ageing analysis based on comparison results obtained for three different iris match-
ers (two of them have not been used earlier in works devoted to iris template ageing). For the purpose of this
research we collected an iris ageing database of samples captured even eight years apart. To our best knowl-
edge, this is the only database worldwide of iris images collected with such a large time distance between
capture sessions. We evaluated the influence of the intra- vs. inter-session accuracy of the iris recognition, as
well as the accuracy between the short term (up to two years) vs. long term comparisons (from 5 to 9 years).
The average genuine scores revealed statistically significant differences with respect to the time distance be-
tween examined samples (depending on the coding method, we obtained from 3% to 14% of degradation of
the average genuine scores). As the highest degradation of matching scores was observed for the most accu-
rate matcher, this may suggest that the iris pattern ages to some extent. This work answers the call for iris
ageing-related experiments, presently not numerous due to serious difficulties with collection of sufficiently
large databases suitable for ageing research, and limited access to adequate number of iris matchers.
1 INTRODUCTION
The statement of a high temporal stability of iris fea-
tures, in the context of personal identification, ap-
peared as early as in the Flom’s and Safir’s US patent
granted in 1987 (Flom and Safir, 1987). A claim,
drawn from a clinical evidence, said that ‘significant
features of the iris remain extremely stable and do not
change over a period of many years’. Although these
‘significant features’ were not clearly specified in the
patent, its context (i.e., recognition of one’s identify)
suggests that said features should relate to all the iris
characteristics having a power to individualize a hu-
man within a population. The pioneering work by
John Daugman (Daugman, 1993) includes more pre-
cise suggestion and relates to the high stability of the
iris trabecular pattern (as the iris texture is used di-
rectly to calculate an iris code). The stability of the
iris meshwork is put in contrast to possible changes of
other characteristics of the eye, not commonly used in
iris recognition, e.g., a melanin concentration respon-
sible for an eye color. Flom’s and Daugman’s state-
ments are thus very often cited in the iris recognition
literature, fueling a common belief that iris templates,
ones determined, are useful for unspecified, yet very
long time periods.
Recently this highly desired attribute of biometrics
seems to be undermined for iris modality by exper-
imental results revealing an increasing deterioration
of a recognition accuracy when the time distance be-
tween capturing the gallery and probe images extends
significantly, e.g., to a few years. This suggests that
the initial claim related to the stability of iris texture
might be inaccurate.
However, one should aware that the stability of
iris texture only partially contributes to the stability
of the iris templates, and many factors may influence
the template lifespan. Iris is not exposed to the ex-
ternal environment and it is covered by a transparent
fluid (an aqueous humor) that fills the space (an ante-
rior chamber) between the cornea and the iris. Hence,
capturing the iris image relies on registering this com-
plicated, three-dimensional structure constituting the
frontal, visible part of the eye. Although an iris is
the most apparent element of this structure, the age-
ing related to the aqueous humor or the cornea may
also influence the ageing of iris templates, even if the
iris tissue is immune to a flow of time. Moreover, the
equipment flux should be considered as an influen-
tial element of the template ageing phenomenon. This
may relate to replacement of the camera between the
gallery and probe image capture, or wearing the cam-
70
Czajka A..
Template Ageing in Iris Recognition.
DOI: 10.5220/0004245800700078
In Proceedings of the International Conference on Bio-inspired Systems and Signal Processing (BIOSIGNALS-2013), pages 70-78
ISBN: 978-989-8565-36-5
Copyright
c
2013 SCITEPRESS (Science and Technology Publications, Lda.)

era components out. Next, the consequences of the
template ageing should be distinguished from effects
related to inter- and intra-session matching scores.
Intra-session comparison scores will typically exhibit
a better match among images when compared to the
corresponding inter-session results. However, the
inter-session changes in imaging conditions, e.g., en-
vironmental parameters or subject’s interaction with
the equipment, usually blur more subtle ageing ef-
fects related to the eye biology. From the technolog-
ical point of view, the iris biometric features, not im-
ages, are used to finally judge on the extent to which
the ageing occurs, as we are interested in how this
phenomenon transforms from the image space (pos-
sible to inspect visually) to the feature space (natural
for biometric matching). However, the transforma-
tion between these spaces is always proprietary to an
iris coding method, and the strength of the template
ageing effect may depend on the feature extraction
methodology. Last but not least, we have no guar-
antee that the ageing effect will be evenly observed
across the subjects of different populations. Exper-
iment results obtained with a particular database of
images may be a weak predictor of this phenomenon
for people of different race, health or dietary culture.
The expected stability of the iris pattern may also
be regarded (in a broader sense) as a demand for sta-
tionarity. Stationary time series is characterized by
temporal stability of its statistical properties. How-
ever, stability of one property (e.g., the average value)
does not guarantee the stationarity, as other proper-
ties (e.g., sample variance) may still vary over time.
This makes the research of the ageing phenomenon
even more complicated, as the judgment should not
be based solely on properties of a single statistics (e.g.
monotonic behavior of the average matching score).
Above aspects related to discovering the truth
about the iris ageing urgently call for experiments car-
ried out for different populations across the world,
performed in different environments, for as many fea-
ture extraction methods as possible and for the longest
possible time lapse between measurements. Answer-
ing this call, we present the iris ageing analysis based
on comparison results obtained for three iris match-
ers and the biometric samples captured even eight
years apart. To our best knowledge, eight years is the
longest time interval characterizing samples used in
the iris ageing analysis up to date worldwide.
2 RELATED WORK
Iris recognition is relatively young discipline, and
thus there is still a shortage of databases of iris images
collected with adequate time intervals to observe the
template ageing phenomenon. This is why the litera-
ture devoted to the iris template ageing is still limited.
Gonzalez et al. first addressed a possibility of in-
fluence of the time lapse onto iris recognition accu-
racy, and presented own experimental study (Tome-
Gonzalez et al., 2008). Theyestimated coding method
parameters using a part of the multimodal BioSec
database, containing samples of 200 subjects. Final
results were generated with the use of the BioSe-
curID database containing iris images captured for
more than 250 volunteers. Although the databases
used were reasonably large, the time lapse between
image captures in the test database was very short
(one to four weeks). As the observation of the age-
ing effects in such a short time period may be diffi-
cult, the authors focused on inter- vs. intra-session
recognition accuracy analysis. According to the ex-
pectations, the genuine intra-session comparisons re-
vealed a better match (e.g. FNMR∈ (0.085, 0.113)
@FMR=0.01)
1
when compared to the inter-session
results (e.g. FNMR∈ (0.224, 0.258) @FMR=0.01).
No significant differences in comparison scores can
be observed for inter-session results with respect to
these very short time intervals. Thus any conclusions
on the iris ageing cannot be drawn based on this work,
yet it supports the intuition related to the importance
of the enrollment procedure that should produce the
enrollment samples predicting, to the maximum pos-
sible extent, the inter-session variations.
The intra- vs. inter-session variations in iris
matching scores were also studied by Rankin et al.,
who used a database of images captured for 238 sub-
jects (Rankin et al., 2012). The sessions were sepa-
rated by three and six months time periods. Results
are presented separately for irises grouped in classes
depending on the iris texture density, and support a
claim on the increase of false rejections when time
interval between samples increases. However, this
study lies slightly next to the main course of biomet-
rics technology, as the images were captured in visi-
ble, not near-infrared light and by a specialized biomi-
croscope, not typically used in iris recognition.
Baker et al. presents the first known to us analy-
sis of the iris ageing under long, four-year time lapse
(Baker et al., 2009). A small database consisted of im-
ages captured for 13 volunteers was used in the anal-
ysis with the iris segmentation inspected manually
(this excludes the segmentation errors from the source
1
FNMR (False Non-Match Rate) is an empirical esti-
mate of the recognition method error relying on falsely re-
jecting a genuine sample; FMR (False Match Rate) is an
empirical estimate of the recognition method error relying
on falsely accepting an impostor sample.
TemplateAgeinginIrisRecognition
71

of matching score deterioration). As opposed to
Gonzalez et al., they eliminated intra-session scores,
and the analysis was focused on comparison between
short-time-lapse matches (i.e., for images taken a few
months apart) and long-time-lapse-matches (i.e., for
images taken four years apart). The authors found a
statistically significant difference in the average com-
parison scores between short-time-lapse matches and
long-time-lapse matches, namely the genuine com-
parison scores (based on the Hamming Distance) in-
creased by 3-4% for long-time-lapse-matches, and the
simultaneous change in the impostor scores was not
observed. Bowyer et al. continue Baker’s work pre-
senting the results for slightly enlarged database of
iris images captured for 26 subjects (Bowyer et al.,
2009). Again, the comparisons between short-time-
lapse matches (i.e. for images separated by less than
100 days) and long-time-lapse-matches (i.e. for im-
ages taken at least 1000 days apart) are analyzed, and
statistically significant deterioration in the genuine
comparison scores is reported (increase of the Ham-
ming Distance by approximately 4%). Later, Baker
et al. expand their initial work by the use of addi-
tional matcher submitted by the University of Cam-
bridge to the Iris Challenge Evaluation 2006 (Baker
et al., 2012). The authors report an increase in false
rejection rate for longer time lapse between images,
supporting an evidence of an iris template ageing ef-
fect. Simultaneously, they concluded that pupil di-
lation, contact lenses and amount of iris occlusions
were not significant factors influencing the ageing-
related results.
Fenker and Bowyer (Fenker and Bowyer, 2011)
presented the first study based on comparison results
obtained by more than one coding method, with one
being a well-recognized commercial product (Veri-
Eye; used also in this paper). The database, con-
sisted of images separated by two years interval, was
built for 43 volunteers. The authors, similarly to the
previous studies, generated short-time-lapse (from 5
to 51 days) comparisons and long-time-lapse (from
665 to 737 days) comparisons, and the ageing ef-
fect is studied through observation of the increase of
false rejections as a function of time interval. Al-
though we expected an increase of FNMR when the
time interval grows, the reported numbers are sur-
prisingly large and alarming. Namely, FNMR in-
creased by 157% to 305% for the authors’ matcher,
and by 195% to 457% for a commercial matcher,
depending on the acceptance threshold set optimally
for short-time-lapse comparison scores. The authors
created data subsets with images presenting homoge-
neous pupil dilation and captured for eyes not wearing
contact lenses, yet the results obtained for these data
subsets did not show a clear evidence of the signifi-
cant influence that these factors might have onto the
original conclusions. The same authors have broad-
ened their research and used images separated by one-
, two- and three-year time intervals captured for 322
subjects (Fenker and Bowyer, 2012). They evaluated
four different matchers to select the most accurate
one, used finally in their evaluations. Similarly to the
prior work, the reduction in the recognition accuracy
was observed, as the average false non-match rate in-
creased by 27%, 82% and 153% for one-, two- and
three-year intervals between compared samples, re-
spectively.
Current literature delivers also a claim that the
iris ageing – if exists – is of a negligible signifi-
cance (Shchegrova, 2012). However, one should be
careful as the linear regression models used in this
work explain only partially possible sources and na-
ture of matching scores non-stationarity, as they try
to find monotonic deterioration in the selected sta-
tistical property (the average matching score). The
lack of linear trend in one statistics does not guar-
antee the statistical stationarity, as still the remaining
(and important) statistical properties (e.g. score vari-
ance) may vary. Moreover, non-monotonic changes
of statistical properties may also be a consequence of
ageing and might be interesting to the biometric com-
munity.
3 AGEING DATABASE
3.1 Database Summary
BioBase-Ageing-Iris database prepared for this work
is a part of a larger set – BioBase. The BioBase
contains biometric samples of five characteristics col-
lected for the same persons, namely: iris, finger-
prints, hand geometry and face images, as well as on-
line handwritten signatures registered on the graph-
ical tablet. The BioBase was collected mostly in
2003 and 2004 for more than 200 volunteers. We
had repeated in 2010 and 2011 the data collection
process for all biometric characteristics a few times
for 31 individuals, who agreed to participate in the
re-enrollment, building five BioBase-Ageing datasets,
separately for each biometric characteristics. Cer-
tainly, we had frozen our database collection environ-
ment to use exactly the same equipment and the soft-
ware, configured identically to minimize the influence
of environmentalfactors onto the biology-related age-
ing effects. To capture samples for all five character-
istics, a single measurement session lasted approxi-
mately 30 minutes. In particular, during each session,
BIOSIGNALS2013-InternationalConferenceonBio-inspiredSystemsandSignalProcessing
72
we realized three iris capture attempts, and each at-
tempt consisted of as many presentations as it was
necessary to capture two iris images (per eye). We
intentionally did not capture the iris images in imme-
diate series, to introduce some between-attempt vari-
ability in intra-session samples. This scenario yields
to six iris images for each eye obtained in each mea-
surement session.
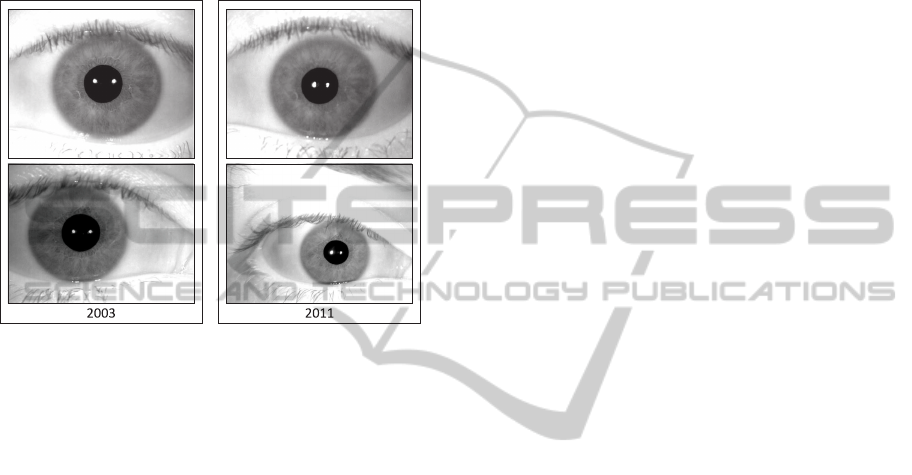
Figure 1: Example iris images captured in 2003 (left) and
the corresponding images of the same eyes captured in 2011
(right). Visual inspection of the upper samples reveal no
serious differences within the iris pattern, yet the bottom
samples show slight differences in the iris size and in the
distribution of illumination. These possible differences may
also influence the matching scores, incorrectly obscuring an
ageing phenomenon resulted from the biology. Images orig-
inate from BioBase-Ageing-Iris database.
The iris images were captured for both subject’s
eyes. To minimize the influence of poor image
quality on the ageing-related conclusions, we de-
cided to manually remove poor quality samples, e.g.
those showing less than 50% unoccluded iris texture.
Hence, the BioBase-Ageing-Iris contains 571 iris im-
ages for 58 different eyes. The shortest time inter-
val between sessions is 30 days while the longest is
2960 days (i.e., more than 8 years). The resolution
of the resulting iris images is 768× 576 pixels, and
the image quality highly exceeds minimum require-
ments suggested by the ISO/IEC 19794-6:2011 and
ISO/IEC 29794-6 standards, Fig. 1.
3.2 Equipment used
Limited availability of commercial cameras offering
raw iris images in 2003, when the experiment was
initiated, encouraged us to construct a complete hard-
ware setup for the iris capture: the IrisCUBE cam-
era. This prototype equipment captures the iris from a
convenient distance of approximately 30 cm with the
desired speed and quality. The camera was equipped
with optics that actively compensates for small depth-
of-field, typical in iris recognition systems, through
an automatic focus adjustment. Two illuminants
of near infrared light (with maximum power set at
850 nm) are placed horizontally and equidistantly
to the lens, what guarantees consistent and suffi-
cient scene illumination. IrisCUBE uses TheImag-
ingSource DMK 4002-IR B/W camera that embeds
SONY ICX249AL 1/2” CCD interline sensor with en-
larged sensitivity to infraredlight. Camera parameters
such as shutter speed and gain may be adjusted man-
ually or automatically.
During lifespan of the database collection project,
new equipment with iris capture capability emerged
on the market, and nowadays we may select among
dozen of iris capture devices. However, due to
high quality of the images captured by the con-
structed camera and due to the aim of guaranty-
ing homogeneous data collection environment, we
used IrisCUBE to capture all the images in BioBase-
Ageing-Iris, thus also in 2010 and 2011 re-captures.
3.3 Database Variants
We observed that iris images captured after a few
years might have different iris diameters when com-
pared to these captured at the beginning of this
project. Although each recognition methodology
should be iris-diameter agnostic and normalize its size
prior to feature extraction, we prepare a second vari-
ant of the database with iris diameters normalized to
the intra-class average using bicubic interpolation.
Images with iris diameter smaller that the intra-
class average diameter are enlarged and cropped to
the original resolution (768 × 576 pixels). If the iris
diameter is larger that the average, the image resolu-
tion is decreased and the missing parts at the image
borders are filled up with a mirror copy of the neigh-
boring parts, again to keep the original resolution. We
use the iris segmentation parameters which were cal-
culated at this stage, and the cropping or filling up the
image are realized to to center the iris within the im-
age (Fig. 2). Further in the paper we refer to these
two variants as the raw and resampled versions.
4 IRIS CODING METHODS
We use three different, commercially available iris
matchers in this work, namely Neurotechnology Ver-
iEye SDK (Neurotechnology, 2012), SmartSensors
MIRLIN SDK (SmartSensors, 2012), as well as the
TemplateAgeinginIrisRecognition
73
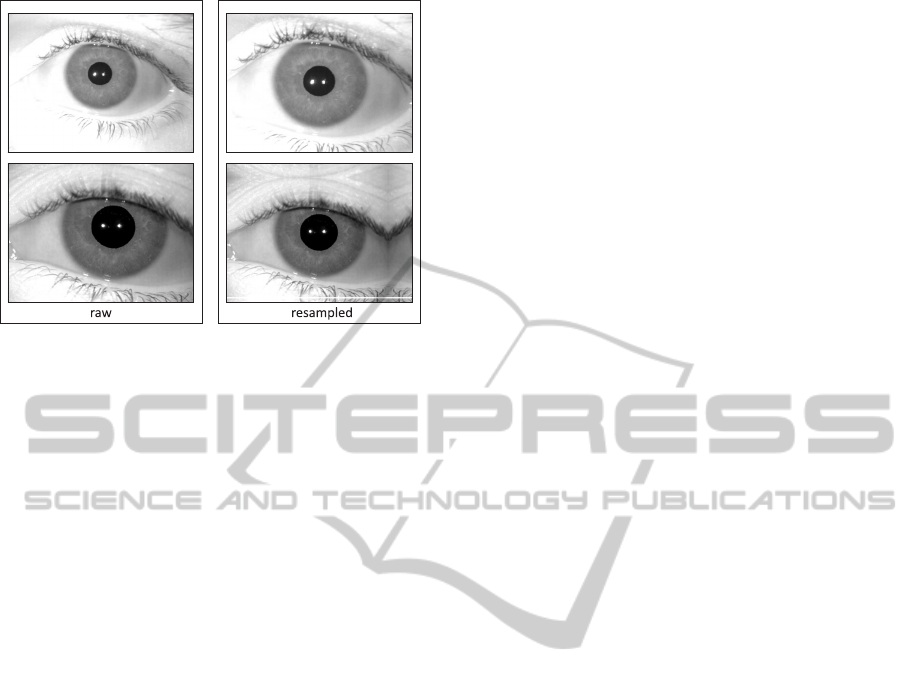
Figure 2: Examples of raw database images (left) and the
corresponding size normalization results (right) after an in-
crease (top) and a decrease (bottom) of the image resolution
through bicubic interpolation. We may observe the effects
of cropping and filling up with neighboring elements when
changing the image resolution. Normalization is performed
to center the iris within the image, what should help the
matchers in correct data segmentation.
BiomIrisSDK, which is based on the methodologyde-
veloped by this author (Czajka and Pacut, 2010).
The first product, VeriEye, employs a proprietary
and not published iris coding methodology. The man-
ufacturer claims a correct off-axis iris segmentation
with the use of active shape modeling, in contrast
to typical circular approximation of the iris bound-
aries. VeriEye was tested for a few standard iris image
databases and was used in the NIST IREX project.
The resulting score corresponds to the similarity of
samples, i.e. a higher score denotes a better match.
For the sake of simplicity, we use further the NT
acronym for the VeriEye matcher.
The second product used, MIRLIN, derives the
iris features from the zero-crossings of the differences
between Discrete Cosine Transform (DCT) calculated
in rectangular iris image subregions (Monro et al.,
2007). The coding method yields to binary iris codes,
thus the comparison requires to calculate a Hamming
Distance (a lower score denotes a smaller distance be-
tween samples, i.e. a better match). The ML acronym
is used for the MIRLIN matcher further in the paper.
The third matcher used in this work employs the
Zak-Gabor wavelet packets and the binary iris fea-
ture vectors are derived by one-bit coding of the Zak-
Gabor transform coefficients’ signs. The uniqueness
of this method relies on the fact, that it does not em-
ploy image filtering, popular in iris recognition, and
produces iris features that reveal global character with
respect to the iris regions used in coding. As for the
MIRLIN matcher, a Hamming Distance is used to cal-
culate the matching score. We use the ZG acronym
further in the paper when referring to the Zak-Gabor-
based matcher.
This is noteworthy that we had a full control over
the ZG method, and in particular we ensured cor-
rectness of the segmentation results for all images in
BioBase-Ageing-Iris. This yields to results that de-
pend only on the properties of iris pattern fluctuations,
what is highly desired in the assessments of ageing ef-
fects. We had no chance to separate the segmentation
and the coding procedures in the remaining commer-
cial matchers, thus this part of the ageing assessment
encompasses the entire performance of the methods
(i.e., eventual segmentation errors and changes in the
iris tissue).
5 RESULTS
5.1 Matching Score Generation
We inspected the BioBase-Ageing-Iris database to
construct a distribution of all possible pairs of the
same-eye images with respect to the time lapse be-
tween image captures, Fig. 3. The number of possi-
ble genuine comparisons is equal to twice the number
of possible iris image pairs, as the matchers may not
return a symmetrical scores (i.e., the score between
the iris image A and the iris image B may be un-
equal to the score between B and A). We may gen-
erate 3 244 image pairs in BioBase-Ageing-Iris, thus
the total number of all genuine comparison is 6 488.
Among these comparisons, we have 2 468 results of
comparing the iris images captured in the same ses-
sion, and 4 020 scores of matching inter-session im-
ages. BioBase-Ageing-Iris allows to construct 51 654
impostor comparisons for all the time intervals ob-
served during genuine comparison generation.
NT and ZG matchers allow to generate all the
above mentioned genuine and impostor scores for
both database variants (raw and resampled). The ML
matcher generated a smaller number of scores (5 948
and 44 514 of genuine and impostor scores, respec-
tively) due to the template generation errors, yet the
numbers of scores for resampled database is slightly
greater (6 328 and 49 162 of genuine and impostor
scores, respectively), what may mean that normaliza-
tion of the iris size increases the accuracy of the ML
matcher for this database.
5.2 Matching Score Grouping
It was impossible to encourage all volunteers to par-
ticipate in the experiment on each day we organized
the re-capture, thus the number of sample pairs with
BIOSIGNALS2013-InternationalConferenceonBio-inspiredSystemsandSignalProcessing
74
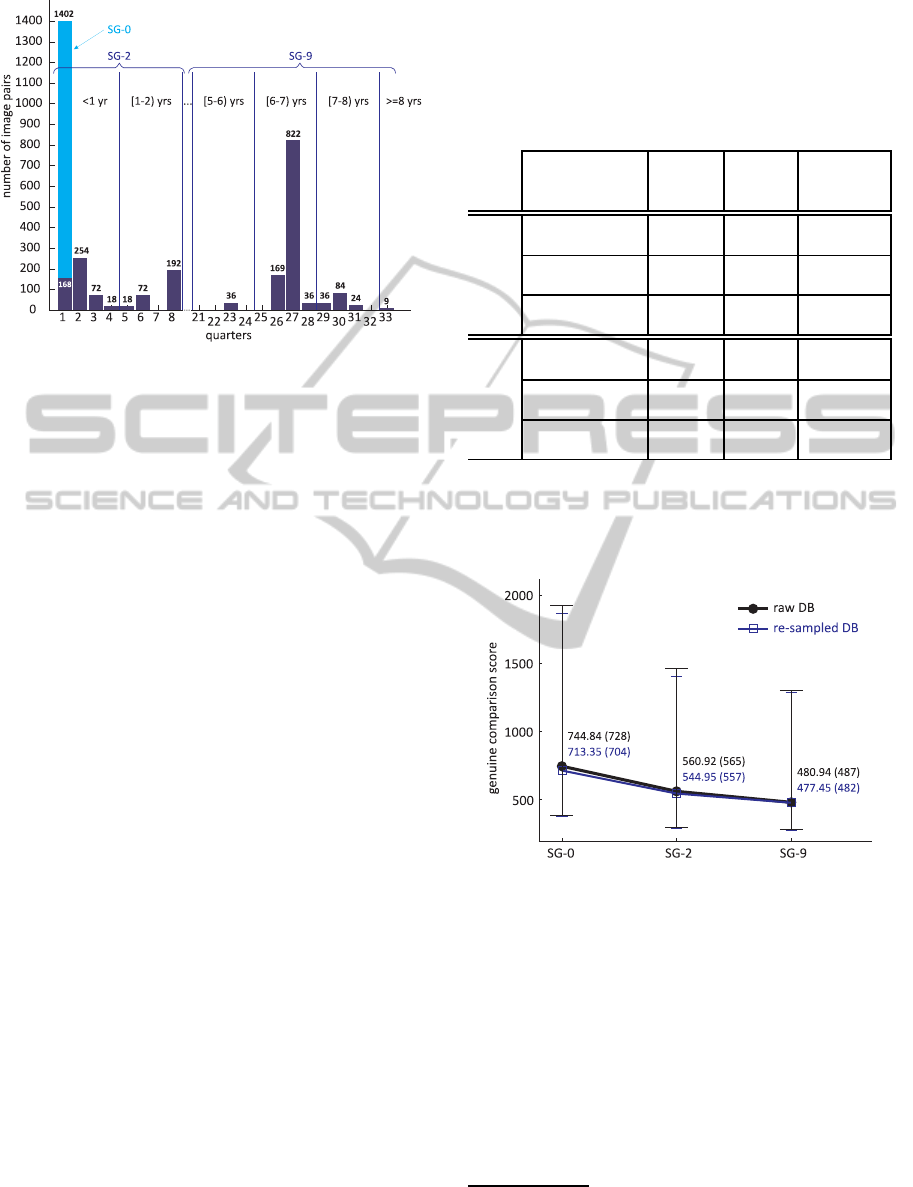
Figure 3: Numbers of possible genuine pairs that can
be constructed with the images of BioBase-Ageing-Iris
database plotted as a function of time lapse between the
samples (gathered in quarters, i.e., three-month periods).
Different-session pairs are marked with dark blue color, and
the light blue color shows the number of pairs including
same-session ones. Segmentation of pairs into three groups
(SG-0, SG-2 and SG-9) is also shown, where SG-0 contains
all the scores for intra-session comparisons, SG-2 groups all
the scores generated for time lapse not greater than 2 year
(excluding the intra-session scores) and SG-9 gathers all the
scores calculated for samples distant by at least 5 years.
respect to the time interval is uneven, Fig. 3, yielding
highly uneven numbers of comparison scores possible
to be generated in short periods. To obtain statistically
significant results, we decided to gather comparison
scores into three groups that can be identified when
observing the distribution of sample pairs shown in
Fig. 3. The first score group, denoted by SG-0, con-
tains all the genuine and impostor scores for intra-
session comparisons. The second – inter-session –
subset, denoted by SG-2, groups all the scores gener-
ated for the samples with time lapse not greater than 2
year, certainly excluding the intra-session scores. The
third subset, referred to as SG-9, gathers all the scores
calculated for samples distant by at least 5 years and
up to 2960 days, i.e. more than eight years. Table
1 details the numbers of genuine and impostor scores
obtained for all the matchers used in this work with
respect to all three score groups.
5.3 Evaluation Results
To answer the question related to the existence of age-
ing effects in iris recognition, we present the aver-
age genuine and impostor scores calculated for each
score group: SG-0, SG-2 and SG-9. Note that the
conclusions related to ageing should be based solely
on inter-session comparisons (i.e. scores classified as
SG-2 and SG-9), and the intra-session results are pre-
Table 1: Number of genuine ξ
g
and impostor ξ
i
scores in
score groups (SG-0, SG-2 and SG-9) for three iris recogni-
tion methods used in this work, namely VeriEye (NT), Zak-
Gabor-based (ZG) and MIRLIN (ML). As the latter matcher
(ML) behaves differently for raw and resampled data, num-
bers for ML are presented separately for these database vari-
ants.
Score group → Same ≤ 2 From 5
Coding session years to 9 years
method ↓ (SG-0) (SG-2) (SG-9)
NT & ZG 2468 1588 2432
for each DB
||ξ
g
|| ML for 2292 1548 2108
raw DB
ML for re- 2394 1588 2346
sampled DB
NT & ZG 7988 10 186 33 480
for each DB
||ξ
i
|| ML for 7188 9362 27 964
raw DB
ML for re- 7690 9646 31 826
sampled DB
sented only for a completeness to show the potential
influence of intra- vs. inter-session captures on the
recognition accuracy.
Figure 4: Average and median scores (in brackets) for raw
(circles, black color) and resampled (rectangles, blue color)
database variants, shown with respect to the score groups
for NT matcher. The whiskers show the 95% boundaries of
the sample distributions in each combination of the SG and
database variant. A higher score denotes a better match.
The NT matcher was the most accurate for images
in BioBase-Ageing-Iris as it reached zero EER
2
for
samples of raw database variant, and only for one time
period a non-zero EER was observed after resampling
the data. We may clearly observe a deterioration in
the average genuine scores within the SG-2 and SG-
9 subsets, Fig. 4. The genuine scores are approxi-
2
EER (Equal Error Rate) is the value of FNMR (or
FMR) at the operating point of Receiver Operating Curve
yielding equal values of FMR and FNMR.
TemplateAgeinginIrisRecognition
75
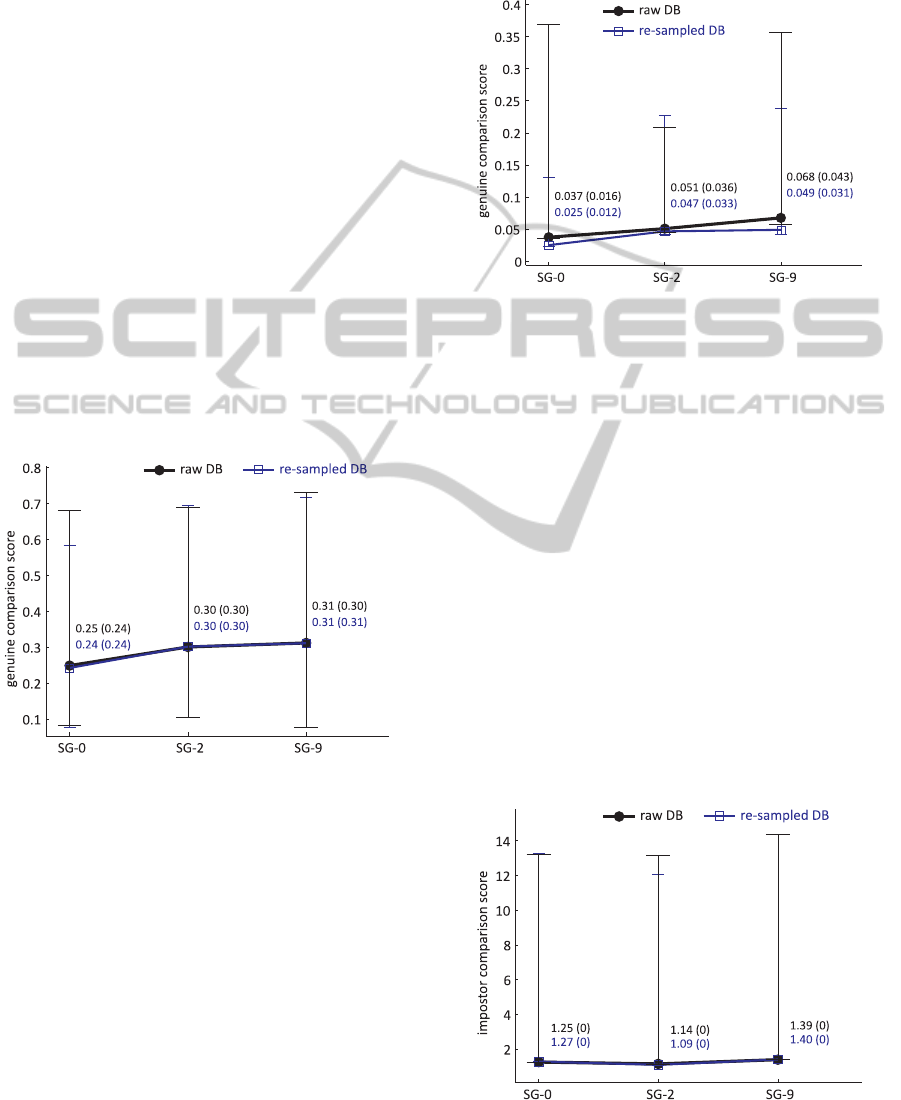
mately 14% lower when the time lapse between sam-
ples starts from 5 years and reaches more than 8 years,
and this observation is supported by the outcome of
one-way unbalanced analysis of variance (ANOVA).
Namely, we cannot accept the null hypothesis that all
samples in SG-2 and SG-9 subsets are drawn from
populations with the same mean, as the obtained p-
value is near to zero (p < 10
−47
for raw database
variant and p < 10
−37
for resampled database vari-
ant). When comparing the intra- vs. inter-session
scores, we encounter even higher accuracy deteriora-
tion, namely 25% decrease of average score in SG-2
when compared to the SG-0 average, and a decrease
by 35% of SG-9 scores when compared to the SG-
0 average. Certainly, also in these cases the analysis
of variance casts doubt on the null hypothesis, as the
obtained p-values are below machine accuracy when
compared SG-0 vs. SG-2 and SG-0 vs. SG-9 scores
for both variants of the database. Note that resampling
of the iris images has a little influence on the average
genuine scores, what may suggest that NT matcher is
iris-size agnostic and the ageing of the NT templates
seems to occur independently of this factor.
Figure 5: Same as in Fig. 4 for the ZG matcher. A lower
score denotes a better match.
Analogously to the presentation of the NT
matcher results, we show the average genuine scores
for ZG method, Fig. 5. The intra- vs. inter-session
scores show 16% and 19% increase in the average
Hamming Distance for raw datasets (20% and 22%
increase for resampled datasets) when compared SG-
0 average score with the SG-2 and SG-9 averages, re-
spectively. These changes are statistically significant,
as obtained p-values are below machine accuracy (for
all combinations of a database variant and a time pe-
riod). Comparing SG-2 and SG-9 scores show only
3% of the average score increase, yet still p < 10
−8
that suggests rejecting of the null hypothesis on equal
means. We may observe that the ZG matcher is robust
to the absolute iris size, as the genuine scores for raw
and resampled database variants do not differ signifi-
cantly.
Figure 6: Same as in Fig. 4 for the ML matcher. As for ZG
matcher, a lower score denotes a better match.
The ML matcher average genuine scores are pre-
sented in Fig. 6. As for NT and ZG methods, we may
encounter statistically significant differences where
comparing average intra- vs. inter-session compari-
son scores (p-value not exceeding 10
−10
for all com-
binations of SG and a database variant), namely the
decrease reaches 27% and even 45% when compared
SG-0 vs. SG-2 and SG-0 vs. SG-9 average scores,
respectively. However, when compared the average
scores between SG-2 and SG-9 we obtain a low p-
value (p < 10
−15
) only for the raw database variant,
and p = 0.19 for the resampled data, although the in-
crease of the average score in the latter case reaches
4%. This may suggest, that the ageing effect re-
lated to the ML templates is somehow compensated
by the unifying of the iris diameters inside the iris
classes (but in a sense of statistical significance of the
ANOVA test).
Figure 7: Same as in Fig. 4 except the result for impostor
scores are shown.
BIOSIGNALS2013-InternationalConferenceonBio-inspiredSystemsandSignalProcessing
76
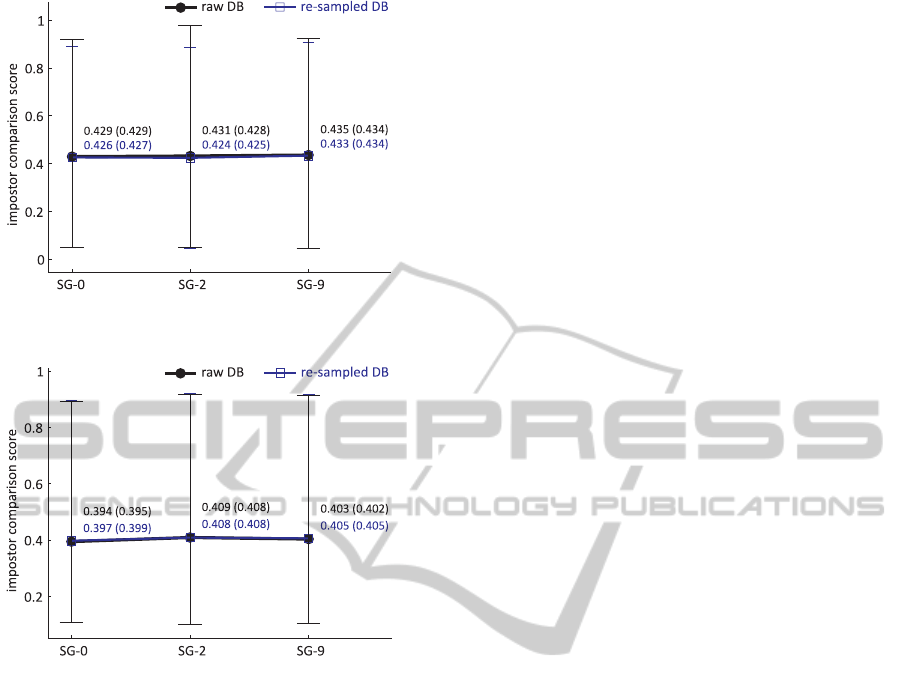
Figure 8: Same as in Fig. 5 except the result for impostor
scores are shown.
Figure 9: Same as in Fig. 6 except the result for impostor
scores are shown.
Figures 7, 8 and 9 present the average impostor
scores for NT, ZG and ML matchers, respectively.
As it was already suggested in the literature related
to the iris ageing effect, we may observe lower dif-
ferences in average scores in groups when compared
to the result of genuine comparisons. Namely, the
changes range from 0.5% for ZG matcher (intra- vs.
inter-session averages for raw samples) to 22% for
NT matcher (inter-session averages for resampled im-
ages). The ANOVA test casts doubt on accepting the
hypothesis that investigated sample subsets are drawn
from populations with the same mean (p < 0.021 for
all combinations of SG and database variant). We
may also see that iris absolute diameter size has no
influence on the impostor scores.
6 DISCUSSION
Average values of the genuine scores obtained for all
the tested matchers may suggest that iris templates
age, what partially supports earlier findings deter-
mined for different matchers and different databases,
yet collecting samples with a shorter time lapse be-
tween captures than in this work. The extent to which
the template ageing phenomenon is observed is how-
ever uneven across different matchers, in particular
we observe a higher influence of the time flow for
more accurate methods. This observation may be ex-
plained in two ways. On the one hand, less accurate
matcher may encounter a higher number of segmen-
tation errors, or improper iris image mapping, when
comparing irises with different pupil dilation, iris di-
ameter or occlusion extent. These factors may be
classified as ‘ageing factors’ (as the resulting template
‘ages’, independently of the ‘ageing’ source), yet we
rather would like to answer the question if the age-
ing relates also (or first of all) to the iris texture, i.e.
a direct donor of the biometric features. If the an-
swer is affirmative, then assessment to what extent
it tackles the elements of the complicated iris tissue
would be of a great value. So, on the other hand,
we may assume that high accuracy of the matcher re-
lates to a higher accuracy of the segmentation process.
If so, more comparison scores result from an appro-
priate matching of the iris patterns (with occlusions
appropriately removed and iris texture appropriately
mapped), which – according to the experimental re-
sults – exhibits significantly different nature after a
few year time lapse. Note that the aim of each coding
method is to be sensitive for iris features which guar-
antee individualization of subjects (e.g., frequency
bands in wavelet-based coding routines). Collecting
these thoughts, we would hazard a guess that the iris
ageing relates also to the iris characteristics that are
responsible for our individual biometric features, i.e.
the iris pattern. Simultaneously, we stress again that
difference in average comparison scores is only one
indicator of the inter-session variability, suggesting
the non-stationarity in iris recognition.
The fact of iris ageing, if finally confirmed by
a series of additional experiments exploiting a large
number of matchers and big, heterogeneous datasets,
should under no circumstances devalue the strength
of the iris recognition. Next research step should
be focused on the assessment of the extent to which
the ageing phenomenon deteriorates the accuracy of
this modality, allowing for introducing precise rules
of template usage, in particular adequate time periods
which call for re-enrollment, what may only increase
an accuracy of this prominent and very accurate au-
thentication technology.
TemplateAgeinginIrisRecognition
77

ACKNOWLEDGEMENTS
The author would like to thank Mr. Mateusz Trok-
ielewicz for initial validation of the segmentation re-
sults calculated for the BioBase-Ageing-Iris samples.
The author is also cordially indebted Dr. Joanna Putz-
Leszczyska, Dr. ukasz Stasiak, Mr. Marcin Cho-
chowski and Mr. Rafa Brize, with whom he had col-
lectively built the BioBase-Ageing-Iris database. The
author also appreciates anonymous reviewers for their
valuable remarks. This work was partially funded by
The National Centre for Research and Development
(grant No. OR0B002701: “Biometrics and PKI tech-
niques for modern identity documents and protection
of information systems – BIOPKI”).
REFERENCES
Baker, S., Bowyer, K. W., and Flynn, P. J. (2009). Empir-
ical evidence for correct iris match score degradation
with increased time lapse between gallery and probe
images. In International Conference on Biometrics,
pages 1170–1179.
Baker, S., Bowyer, K. W., Flynn, P. J., and Phillips, P. J.
(2012). Template aging in iris biometrics: Evidence of
increased false reject rate in ICE 2006. In Burge, M.
and Bowyer, K. W., editors, Handbook of Iris Recog-
nition. Springer.
Bowyer, K. W., Baker, S. E., Hentz, A., Hollingsworth, K.,
Peters, T., and Flynn, P. J. (2009). Factors that degrade
the match distribution in iris biometrics. In Identity
in the Information Society, volume 2, pages 327–343.
Springer.
Czajka, A. and Pacut, A. (2010). Iris recognition sys-
tem based on Zak-Gabor wavelet packets. Journal
of Telecommunications and Information Technology,
4:10–18.
Daugman, J. (1993). High confidence visual recognition of
persons by a test of statistical independence. IEEE
Transactions on Pattern Analysis and Machine Intel-
ligence, 15(11):1148–1161.
Fenker, S. P. and Bowyer, K. W. (2011). Experimental evi-
dence of a template aging effect in iris biometrics. In
IEEE Computer Society Workshop on Applications of
Computer Vision, pages 232–239.
Fenker, S. P. and Bowyer, K. W. (2012). Analysis of tem-
plate aging in iris biometrics. In CVPR Biometrics
Workshop, pages 1–7.
Flom, L. and Safir, A. (1987). Iris recognition system.
Patent. US 4,641,349.
Monro, D. M., Rakshit, S., and Zhang, D. (2007). DCT-
based iris recognition. IEEE Transactions on Pattern
Analysis and Machine Intelligence – Special Issue on
Biometrics: Progress and Directions, 29(4):586–595.
Neurotechnology (2012). VeriEye SDK, version 4.3, revi-
sion 87298.
Rankin, D., Scotney, B., Morrow, P., and Pierscionek, B.
(2012). Iris recognition failure over time: The effects
of texture. Pattern Recognition, 45:145–150.
Shchegrova, S. (2012). Analysis of iris stability over time
using statistical regression modeling. In Biometric
Consortium Conference & Technology Expo, Septem-
ber 18-20, 2012, Tampa, Florida USA.
SmartSensors (2012). MIRLIN SDK, version 2.23.2.
Tome-Gonzalez, P., Alonso-Fernandez, F., and Ortega-
Garcia, J. (2008). On the effects of time variability in
iris recognition. In IEEE Conference on Biometrics:
Theory, Applications and Systems, pages 1–6. IEEE.
BIOSIGNALS2013-InternationalConferenceonBio-inspiredSystemsandSignalProcessing
78
