
Reusability and Sustainability in Operations Dashboard
Comparative Study
Noor Nashriq Ramly and Mohd Haris Aziz
InfoStructure Lab, MIMOS Berhad, Kuala Lumpur, Malaysia
Keywords: Paperless, Green It, Paper-like Interface, Sustainability, Operations Dashboard, Monitoring.
Abstract: In managing IT data centers and critical operations, it is imperative for companies to be able to rely on
specific mechanism in order to have visibility of overall infrastructure health. Failure to act proactively
against any disaster that could happen in future would bring major losses to companies that depended
greatly on their IT operation. However, looking at the current trends and technologies, these tools can come
in various forms; from manually collecting data and offline paper reports to some astounding paperless
operations dashboard that everyone in the company would be able to see and rely for any critical operation
decision-making. While focusing only for real-time monitoring activities, there is an urgent need for
companies to embed tactical and strategic function in their operations dashboard. Companies can no longer
relying on manual analyzing critical operation to proactively improve their IT operation business. Thus, this
paper discuss on the four reasons that of companies starting to change to paperless operations dashboard as
well as three principles that we need to adhere in order to implement an effective paperless dashboard
initiatives in a critical operation company. Apart from that, several criteria for choosing the best paperless
operation dashboard for specific company derived from previous research are discussed in detail. A
comparative study is then carried out between five off-the-shelf dashboards and one in-house developed
dashboard against the researched criteria. With this, it is hoped that this paper would be a useful guide to
companies when venturing in paperless operations dashboard arena.
1 INTRODUCTION
The idea of paperless operations dashboard started
when people started to be aware that they need to
take into account time, effort and criticality of
managing IT operation. By relying more on paper
and offline dashboard, people tends to spend more
time in gathering and constructing repetitive data and
report before they could have time to analyze them.
By the time they even finish the analysis; the result
may not be even the latest reflection of current status
and cannot be the accurate baseline for decision in
future. Before it becomes too late, companies are
willing to spend more and more on the gadgets and
widgets to help them minimize time and effort to
overcome potential issues and address them
proactively through dashboard visualization.
The term dashboard refers to the art of displaying
multiple of information in various forms and styles
from different sources into one screen [Wikipedia,
2001], [Matt, 2005] and [Maarten, 2010]. According
to Eckerson (2006), performance dashboard can be
categorized into three types; operational, tactical and
strategic.
Operational dashboards usually focus on real-time
data that comes from actions triggers by opportunity
or issue. The dashboard will have to provide real-
time or instantaneous status or near real-time of any
possible occurrence of downtime. Normally it will
serve as detailed or summarized data pulled directly
from infrastructure. Tactical dashboards on the other
hand are not all real-time data and normally used to
guide user to make decision on certain areas. It is
useful in decision support activities by relying on the
historical data along with business intelligence
feature through trend prediction. The focus is to
analyze performance over time and what is displayed
in the past and how to improve them. The last type of
dashboards; strategic dashboard is used while dealing
with measuring performance against the high-level
objectives. This dashboard is normally associated
with data on company goals or requirements versus
performance data during some specific interval.
For IT operation companies, dashboard is used to
89
Ramly N. and Aziz M. (2012).
Reusability and Sustainability in Operations DashboardComparative Study.
In Proceedings of the Sixth International Symposium on e-Health Services and Technologies and the Third International Conference on Green IT
Solutions, pages 89-96
DOI: 10.5220/0004475000890096
Copyright
c
SciTePress

help to project current performance and health of
infrastructure as well to support decision making
against any disaster in future. This mechanism is
crucial to the organization in minimizing disaster
impact on the core business. While there is
increasing needs for IT critical operation to monitor
and measuring performance real-time in line with
tactical and strategic initiatives, companies now are
looking for any other alternative operations
dashboard that could meet all these functions in one
platform. It is believe that while technology
advanced, people will start to look at high technology
equipment and gadgets rather than relying on
traditional paper and offline methods as means of
monitoring, predicting and analyzing (Steurbaut, et
al., 2010). It is predicted to be the inevitable result of
technology evolution to match with emerging risks of
critical IT operation.
However, given varieties of operations dashboard
in the market, people might face problem to choose
the perfectly matched dashboard for their company.
Balancing between needs and cost of the dashboard,
this paper is designed to help the companies to
choose the best paperless operations dashboard while
at the same time utilizing the paperless features for
managing their mission critical operation.
For that reason, a comparative study was
conducted on a few several top operations
dashboards in the market. However, we limit our
discussion on dashboard known as Nagios, Zenoss,
Ganglia, OpManager and Cacti to avoid lengthy a
discussion.
Section 2 in this paper discusses briefly on the
principles that company need to adhere and conform
to ensure a successful paperless dashboard
implementation. In Section 3, we will cover a few
criteria that one should search for a successful
paperless dashboard which will later be used in
section 4 for our comparative studies. The last
section describes briefly our future work based on
this study.
2 WHY PAPERLESS
OPERATIONS DASHBOARD?
There are a few reasons people starts to move to
paperless dashboard rather than working with paper
and offline data. According to Seelan and Harper
(2003), there are three problems rises while dealing
with paper reports.
The first point is paper symbolize an old-
fashioned past technology (Steurbaut, et al., 2010)
and (Eckerson, 2006). People tend to relate masses of
paper on the desk as ‘outdated’ and not representing
futuristic technologies, especially when dealing with
IT critical operation center.
The cost of paper storage and maintenance also
remains the core problem of IT operation business
nowadays (Gormish, Piersol, Gudan, and Barrus,
2009), (Steurbaut, et al., 2010) and (Bassignani,
Dierolf, Roberts and Lee, 2010) Companies are more
willing to spend more on the high technology gadgets
to do all the automated monitoring that can guarantee
IT improvement and saves more time as well as
minimizing human error in the process rather than
traditional paper trails and reports that would require
more time to prepare and generate when needed.
Moreover, cost of paper disposal remains one of the
crucial items that companies need to provide while
dealing with paper reports (Webber and Wallace,
2009). Although the individual cost might be small,
but the aggregate cost of overall process is
reasonable high and can help companies to save
some operation cost.
As paperless dashboard is web-based application,
it is self-maintained and do not require any paper
throughout the process and in that context, it should
be considered environmentally safe (Webber and
Wallace, 2009). However, it is still open for debate
as paperless dashboard requires hardware
infrastructure and capacity planning need to be
arranged so that energy can be use efficiently.
Apart from that, IT personnel tend to realize that
there are limitation and interactional problem dealing
with paper (Steurbaut, et al., 2010), (Eckerson, 2006)
and (Petrakis and Engiles, 2000). This includes
physical space, physical delivery, and versioning
process throughout IT operations reviewing,
analyzing and cross-reference process. By having
paperless operation dashboard, people can use the
dashboard as tool for easy monitoring and predicting
trends of infrastructure health efficiently rather than
manual data collection and data analysis. This will
help to save time and efforts as well as avoiding
frustration among the technical personnel while
dealing with this repetitive task.
3 PRINCIPLES OF EFFECTIVE
PAPERLESS DASHBOARD
IMPLEMENTATION
There are three principles that we need to adhere to
guarantee an effective paperless operations
dashboard implementation.
EHST/ICGREEN 2012
90
3.1 Role of Paper
The first principle is, before going deep in paperless
area, one need to understand the role of paper reports
that will be replaced or minimized. We need to
determine the functions and characteristics of
documents that we want to replace in the first place
(Gormish, Piersol, Gudan, and Barrus, 2009) and
(Sellan and Harper, 2003). In order to do this, we will
need to recognize the people and process workflow
involved in those specific activities (Bos, Blanken,
Huisman, 2011), ( Noor Nashriq, Ahmad Zuhairi,
Mohd Haris, Nurul Haszeli, 2011), (Plimmer, 2010),
(Zhu, Nii, Fernando, Cheok, 2011) and (Plimmer,
Mason, 2006). This might be derived from the
dashboard angle or perspectives – whether it is meant
solely for operational, tactical, strategic or
combination of all [4]. After we have defined that, we
are now able to determine which area and function
that we want to focus on with these paperless
initiatives.
3.2 Technology Must Support Paperless
Environment
The next point is paperless technology must be
developed to support the same paper environment
(Gormish, Piersol, Gudan, and Barrus, 2009) and
(Sellan and Harper, 2003).Computer system needs to
be able to adapt to existing human system.
Insufficient understanding of IT activities involved
will result to false interpretation that could bring IT
disaster when we want to replicate it into a system
(Bassignani, Dierolf, Roberts and Lee, 2010) and
(Eckerson, 2006), Translating all the processes just
for the sake of transforming a paper process to
paperless would not bring any good but would bring
down the organization motivation in the long run.
The dashboard need be better crafted so that people
would not have the tendency to change to old paper
process in future.
3.3 Paperless Initiatives Must Be
Supported by Top Level
Management Direction
The final point that organization should think about
is whether the paper office initiatives comes from
significant organization change to match computer
system or it is superficial desire to not use paper
(Steurbaut, et al., 2010). When one organization
chooses the latter to start move on the paperless
office initiative, they can be sure that the use of paper
will totally fade out in certain tasks in future.
4 CRITERIA OF WELL-DEFINED
PAPERLESS OPERATION
DASHBOARD
There are many criteria that contribute to good
paperless operational dashboard for particular
environment. Based on studies, the important criteria
are summarized and tabulated in Table 1.
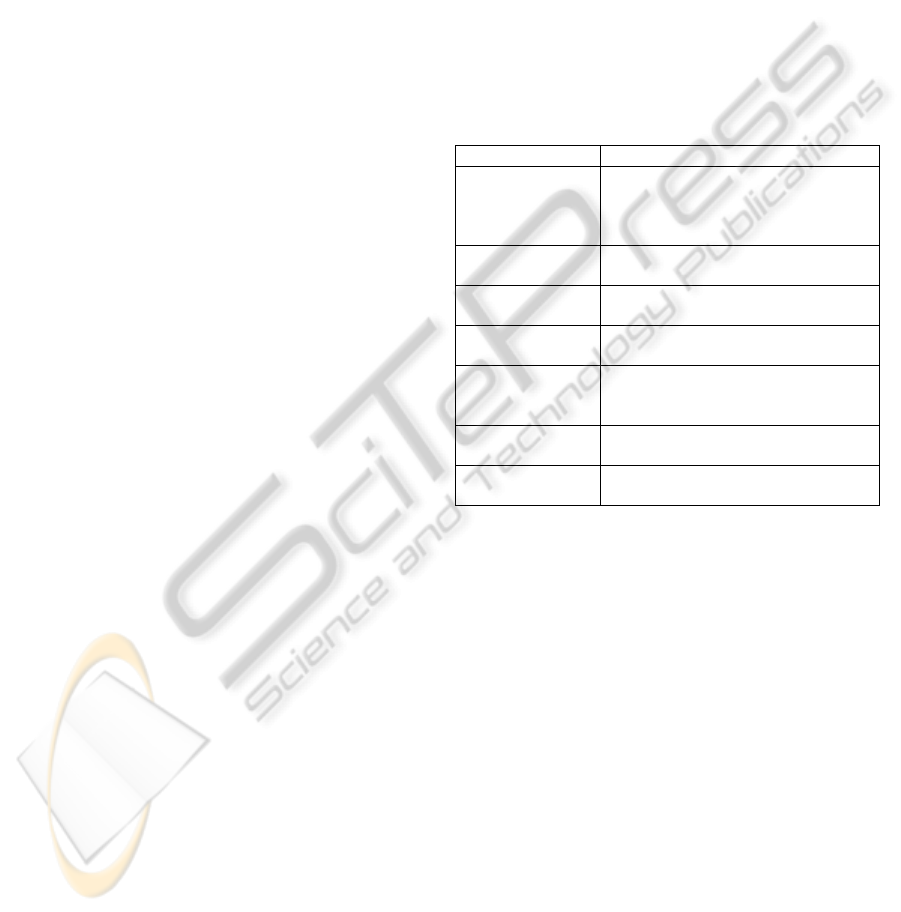
Table 1: Criteria of paperless well- defined operation
dashboard.
Criteria Description
Comprehensive Completeness - cover only what key
business and system needs while
ensuring all performance indicators
included.
Process mapping Ability to adapt and replicate current
paper process to paperless
Automation Ability to automate repetitive
dashboard activity
Real-time &
accurate data
Current, instantaneous and precise
data available to view.
Personalization Distinguish dashboard according to
viewers – operational, tactical,
strategic
Audit capability Ability to store log events for
analysis and comparison purpose.
Alert /
Notification
Action trigger based on specific
rules.
As tabulated in Table 1, these five criteria are the
main contribution towards having a good paperless
operation dashboard.
The first criterion is the dashboard must possess
comprehensive coverage according to purpose of the
dashboard (Petrakis and Engiles, 2000) and (Noor
Nashriq, Ahmad Zuhairi, Mohd Haris, Nurul Haszeli,
2011). The selected performance indicator must be
able to show business performance and real-time
status according what business and system needs
(Bharosa, Meijer, Janssen, and Brave, 2010). A good
information organization and flow can help users to
highlight critical data that we can want to convey
(Marshall, 2009) and (Triola, Feldman, Pearlman and
Kalet, 2004).
The paperless dashboard must be able to map
current paper process to its new paperless system
(Sellan and Harper, 2003), (Bos, Blanken, Huisman,
2011), (Petrakis and Engiles, 2000) and (Zhu, Nii,
Fernando, Cheok, 2011). The technology that the
paperless dashboard has should be able to support
current paper environment in order to make it work
Reusability and Sustainability in Operations Dashboard - Comparative Study
91

(Gormish, Piersol, Gudan, and Barrus, 2009) and
(Noor Nashriq, Ahmad Zuhairi, Mohd Haris and
Nurul Haszeli, 2011). The paperless operations
dashboard must be able to accommodate offline
process mapping of operational, tactical as well as
strategic process as needed in order to succeed in
meeting this criteria. If people are kept coming back
and forth from paper to paperless dashboard, this
initiative will eventually be washed-out in the near
future.
The third criterion is job automation that we
wanted to capture over time. Ability to generate
automatic data and reports would be the most
important feature of paperless dashboard. With this
feature, user would not be wasting time generating
data and reports that turns out to be repetitive job
over time (Eckerson, 2006), (Petrakis and Engiles,
2000), (Bos, Blanken and Huisman, 2011), (Jain,
Arim, and Li, 2008). By automatically running
scripts through the back end of the dashboard, this
feature definitely is an added advantage to any
paperless dashboard. This feature will help the user
to focus and concentrate more on monitoring,
analyzing and prediction of the data.
The fourth criterion is real-time and accurate data
available for analysis whenever users needed for
either analysis or reviewing current performance
(Noor Nashriq, Ahmad Zuhairi, Mohd Haris and
Nurul Haszeli, 2011) and (Plimmer, 2010). By using
scheduled task, monitoring scripts can be done
automatically while eliminating any human errors
thus; can help to guarantee data accuracy of the
dashboard especially when dealing with operation,
tactical and as well as for strategic purposes.
With dashboard personalization, users are able to
customize dashboard page and look and feels
according to their job roles (Bharosa, Meijer,
Janssen, and Brave, 2010), (Marshall, 2009) and
(Triola, Feldman, Pearlman and Kalet, 2004) and
(Nagios, n.d.) The most important point is the
dashboard is able to customize according to user
technical and management background – whether it
is operational, tactical and strategic. This feature will
help user to utilize the dashboard functionality thus
improve business and operation management.
When there is analyzing data process involved,
system admin will have to rely on audit capability of
our dashboard (Steurbaut, et al., 2010), (Sellen and
Harper, 2003) and (Triola, Feldman, Pearlman and
Kalet, 2004). By storing historical data and retrieving
for auditing past data, user will be able to conduct an
in-depth review analysis for find root cause of certain
problem.
The
last but not least is alert and notification
messages. This is the capability of the dashboard to
alert and notify the admin for any possible issues so
that they can take action before a huge disaster could
happen (Eckerson, 2006) and (Gormish, Piersol,
Gudan, and Barrus, 2009). System will be 100%
responsible to monitor the system using generated
scripts without having human intervention.
5 COMPARATIVE STUDY
We had briefly discussed seven criteria which
contribute to the success of paperless operational
dashboard. A comparative study was conducted on a
few dashboards based on seven criteria of well-
defined paperless operations dashboard. For this, the
study is limited to dashboards commonly used such
as Nagios, Zenoss, Ganglia, Cognos, OpManager and
Cacti and MIMOS Operations Dashboard.
5.1 Comprehensive
Zenoss offers cataloged view state of managed
servers and services (Zenoss, n.d.) This means that
the services can be grouped according to their classes
and functions. Nagios on the other hand, can only
handle medium size infrastructure. Hence it would be
very suitable for small to company with medium IT
operations (Cacti, n.d.). For complete end-to-end IT
network and infrastructure monitoring with advanced
fault and performance management, Opmanager
would be the best choice to implement (Opmanager,
n.d.). Cacti and Ganglia provide RRDTool charting
of industry standard with high performance data
logging and graphing system for time series data
(Cacti, n.d.) and (Ganglia, n.d.). On the contrary,
MIMOS Operations dashboard offers high level view
of networked diagrams for critical servers and
services as well network connectivity of the whole
infrastructure in one page (Plimmer, 2010)
Cacti and Zenoss can monitor most of the basic
information of servers and services (Cacti, n.d.) and
(Zenoss, n.d.). This includes system heartbeat or
availability of the servers and services. Nagios, Cacti
and Opmanager offer more performance indicators to
monitor especially for advanced monitoring e.g.
outages or performance degradations for CPU,
memory and disk space, network traffic, temperature
of host of the servers (Nagios, n.d.), (Cacti, n.d.) and
(Opmanager, n.d.). Compare to others, Ganglia can
only monitor physical information on particular
nodes (Ganglia, n.d.). For MIMOS Operations
Dashboard, there three sets of performance indicators
that are monitored – server uptime and availability as
EHST/ICGREEN 2012
92
well as disaster recovery status (Noor Nashriq,
Ahmad Zuhairi, Mohd Haris and Nurul Haszeli,
2011).
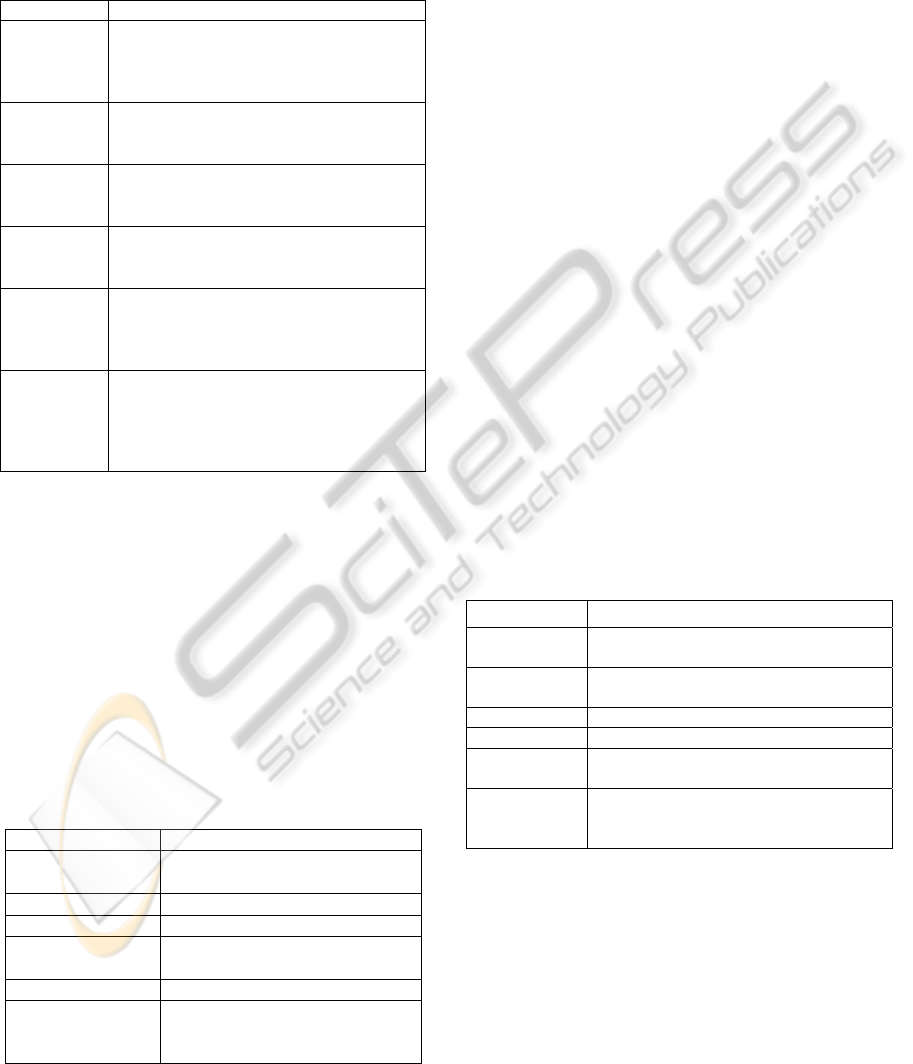
Result of comprehensive criteria is tabulated in
Table 2.
Table 2: Comparison on comprehensive criterion.
Dashboard Comprehensive
Zenoss
• Offers catalogued view of servers and
services involved
• Monitor most of the basic information
of server and services
Nagios
• Handle small to medium
infrastructure
• More advanced monitoring provided
Opmanager
• Complete end to end monitoring with
fault management
• More advanced monitoring provided
Cacti
• High performance data logging for
time series data
• More advanced monitoring provided
Ganglia
• High performance data logging for
time series data
• Monitor physical information on
particular notes
MIMOS
Operations
Dashboard
• High level networked diagram of
infrastructure
• Three sets of performance indicator –
uptime, availability and disaster
recovery status
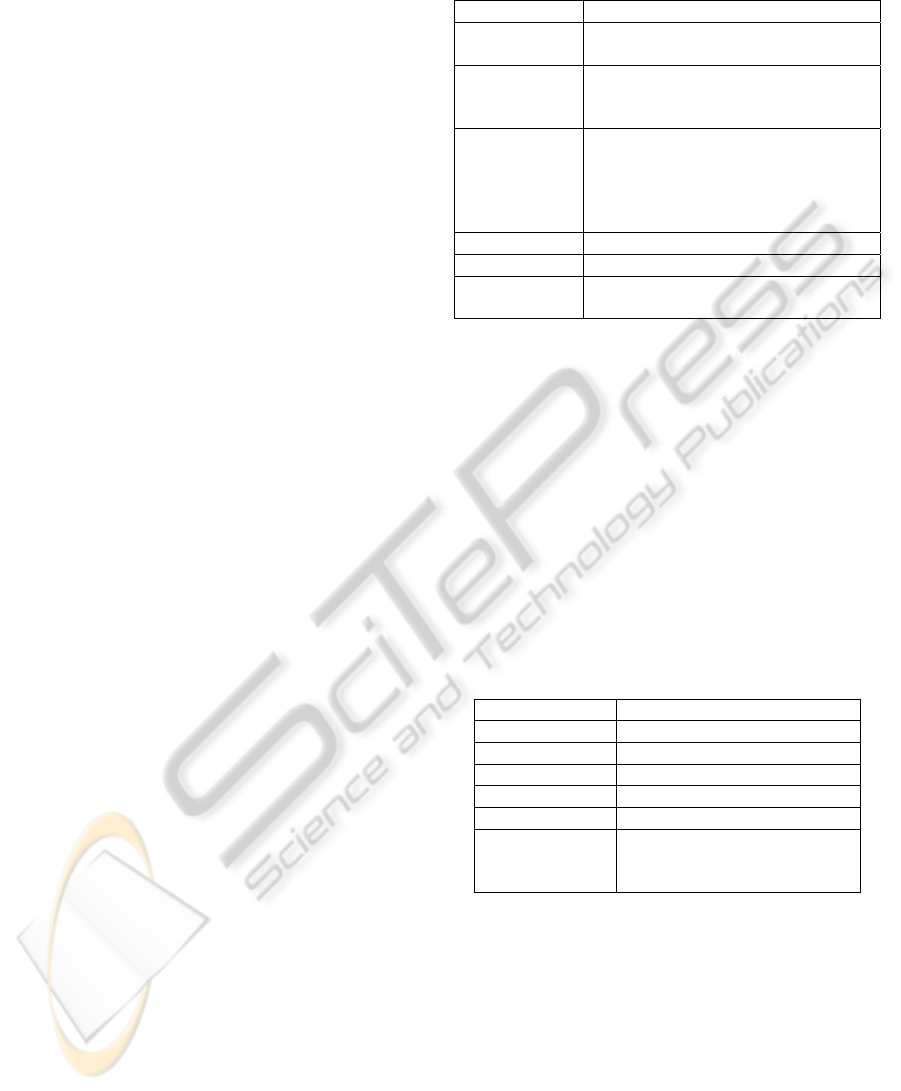
5.2 Process Mapping
As listed in Table 3, among the six dashboards, only
Zenoss (Zenoss, n.d.) and Cacti (Cacti, n.d.) are
capable to conduct trend prediction even though it is
still minimal activities at the moment. Nagios
(Nagios, n.d.), Ganglia (Ganglia, n.d.) and
(Opmanager, n.d.). and MIMOS Operation dashboard
only provides real-time monitoring and manual trends
analysis on the historical logs and events provided.
None of the dashboards serves strategic functions in
their dashboard.
Table 3: Comparison on process mapping criteria.
Dashboard Process Mapping
Zenoss Operational, tactical with trend
prediction
Nagios Operational and tactical
Opmanager Operational and tactical
Cacti Operational, tactical with trend
prediction
Ganglia Operational and tactical
MIMOS
Operations
Dashboard
Operational
5.3 Automation
All of the dashboards have specific automation
scripts designated for every application and system.
The users only need to key in the respective IPs and
other information before the scripts will go and
retrieve the needed status and return it to the dash
board.
Zenoss automatically build and maintain service
dependency mappings with real-time discovery and
topology modeling in one single click (Zenoss, n.d.).
Nagios uses external plugins that runs intermittent
checks on hosts and services in some predetermined
interval (Cacti, n.d.). Similar with Zenoss,
Opmanager also depended on its automated network
discovery to scan the network, servers and services
status (Zenoss, n.d.). Cacti possess a mechanism
which allows users to generate custom scripts that
can be used to gather data before dumping it on the
dashboard (Cacti, n.d.). Ganglia comprises of three
daemons that together they will run on each cluster
nodes being monitored and collect states of the result
(
Josephsen, 2007). The web-based frontend will
ensure that the collected data will be presented in
real-time dynamic web pages graphs. MIMOS
Operation Dashboard backend engine will run
custom scripts every 2 minutes to collect
performance indicator data and validating them with
some specific validation rules before sending it for
visualization. The summarized findings are tabulated
in Table 4.
Table 4: Comparison on automation criteria.
Dashboard Automation
Zenoss With real-time discovery and topology
modeling
Nagios Runs intermittent checks some
predetermined interval
Opmanager Automated network discovery
Cacti Generate custom script for data gathering
Ganglia Daemons run checking and collect states
in predefined time
MIMOS
Operations
Dashboard
Backend engine runs scripts to collect
performance
5.4 Real-time and Data Accuracy
As tabulated in Table 5, all dashboards provide real-
time data with probability lagged status of maximum
five minutes. However this interval can be
configured depending on business needs. For
accuracy purposes, respective dashboards will set
specific rules to send repeated scripts to validate the
status if negative status is passed during the first
Reusability and Sustainability in Operations Dashboard - Comparative Study
93
result. This is crucial to IT operations as they do not
want to focus their effort into some false alarm of
respective devices.
For Zenoss, the network and devices will be
checked by ping collector (Citrix, 2012). By default,
ping timeout will be 1.5 seconds and if it fails to
response, collector will send out 2 retries. If the
devices or network fails to responds in 1.5 seconds in
three tries, an event will be created and highlighted in
the dashboard.
Scheduling for check events for Nagios is
customizable. By default the interval length for every
check is 1 minute. There is a retry check option that
can help to double check any negative result and
validate them (Josephsen, 2007). This is to ensure
that the service is down for certain amount of time
before notifying the technical people. Max check
attempt option will help to limit the attempt checking
the services in any negative cases. However, these
options only applicable to services monitoring. Host
checks will be only carried out when needed, usually
when services on that specific host failed to respond
in the predefined time (Josephsen, 2007).
For OpManager, ICMP ping will be push over to
the monitored devices every 2 minutes (Manage
Engine, 2012). If there is no response after two
consecutive pings, then OpManager will consider the
device as unavailable. The number of pings and their
time interval can be assigned depending on our
business needs. Opmanager will use Telnet to
monitor non-ICMP environment. The default polling
interval is 5 minutes and this can be customizable.
Moreover, Opmanager also has mechanism of alarm
propagation that rely on a few negative consecutive
polls namely attention, warning and critical state.
Color coded label will be also used to differentiate
these alarm state (Manage Engine, 2012).
Cacti and Ganglia both are using RRDTool
charting for in their dashboard. Cacti graphs usually
will take two or three polling intervals to show up
with 5 minutes of default polling interval (Nuryani
Arisal, Suwarningsih, Wirahman, 2007). Ganglia on
the other hand, sets 15 seconds of polling interval by
the default (Ganglia, n.d.). However, this value can
be reconfigured according to its data source –
whether it is grid or cluster.
MIMOS Operation Dashboard provides custom
scripts of ping for every critical hosts and telnet for
services check. The interval length of every check is
about 2 minutes and the system will poll three
consecutive checks before releasing ‘DOWN’ status
to the dashboard. In between the three consecutive
checks, the dashboard will display ‘WARNING’
status to pre-notify the technical people to stand by.
Table 5: Comparison on real time and data accuracy
criterion.
Dashboard Real-Time & Data Accuracy
Zenoss Ping timeout is 1.5 seconds with 2
retries
Nagios Check interval length is 60 seconds
with retry check option and max
check attempt
Opmanager ICMP ping interval length is 2
minutes with 2 retries
Telnet polling interval is 5 minutes
Has alarm propagation and color
coded label.
Cacti Polling interval is 5 minutes
Ganglia Polling interval is 15 seconds
MIMOS
Operations
Polling interval is 2 minutes and 3
retries
5.5 Personalization
This feature is useful when people are from different
background and expertise wants to use the paperless
operation dashboard to their advantage. Since users
may come from operational, tactical or strategic
functions, dashboard may need to be customized
according user needs. However, Zenoss (Zenoss,
n.d.) and Cacti (Cacti, n.d.) are the only dashboard
that provides this features embedded by default. The
other dashboard will need to be customized to add
this feature. Result of personalization criteria is
tabulated in Table 2.
Table 6: Comparison on personalization criterion.
Dashboard Personalization
Zenoss Possess this feature
Nagios Do not possess this feature
Opmanager Do not possess this feature
Cacti Possess this feature
Ganglia Do not possess this feature
MIMOS
Operations
Dashboard
Do not possess this feature
5.6 Audit Capability
By default, all dashboards have the audit features
although the presentation of logs events may varies
between them. Users are able to see historical events
of any opportunity or issues especially tactical and
strategic teams. However, MIMOS Operation
dashboard does need to rely on other tools in order to
process and analyze past data (Noor Nashriq, Ahmad
Zuhairi, Mohd Haris, Nurul Haszeli, 2011). Table 7
briefly summarized this finding.
EHST/ICGREEN 2012
94

Table 7: Comparison on audit capability criterion.
Dashboard Audit Capability
Zenoss Possess this feature
Nagios Possess this feature
Opmanager Possess this feature
Cacti Possess this feature
Ganglia Possess this feature
MIMOS
Operations
Dashboard
Do not possess this feature
5.7 Alert and Notification
When there is a server or services outage, a paperless
operation dashboard should be able to trigger and
send a notification to the technical team for them to
act on. The normal alerts or notifications are email,
SMS or telephone. As listed in Table 8, among the
six dashboards, Ganglia are not able to send to send
notification to their respective standby team
(Ganglia, n.d.) by default. Other dashboards can use
either email or SMS for outage notification [Zenoss,
n.d.), (Nagios, n.d.), (Opmanager, n.d.), (Cacti, n.d.)
whereas MIMOS Operations Dashboard depends on
other plugin to send alerts and notification. The
summarized findings are tabulated in Table 8.
Table 8: Comparison on audit capability criterion.
Dashboard Alert and Notification
Zenoss Email, SMS or telephone.
Nagios Email, SMS or telephone.
Opmanager Email, SMS or telephone.
Cacti Email, SMS or telephone.
Ganglia Do not possess this feature
MIMOS
Operations
Dashboard
Email, SMS or telephone.
6 CONCLUSIONS AND FUTURE
WORKS
Based on the above discussion, we have summarized
seven criteria that a paperless operations dashboard
should have in order to ensure that these paperless
initiatives will be carried out successfully in an
organization. We have compared five off-the-shelf
operations dashboards and one in-house developed
dashboard and briefly listed the features related to
these criteria in the later section. However to make
these initiatives a success, understanding of the
principles and reason of carrying out this initiatives is
imperative. It is hoped that this paper can assist in
deciding the best paperless operations dashboard for
their organization as well as ensuring that the
initiatives last, usable and sustainable throughout the
years.
We plan to improve MIMOS Operations
dashboard to include historical logs and events for
trends analysis as well as incorporate some business
intelligence feature for trend predictions. Moreover,
there is a need to come out with at least one
mechanism to minimize energy savings through
scripts and automation that we listed above. Lastly,
our dashboard will be equipped with intuitive
approach for strategic teams to rely on.
REFERENCES
Wikipedia. 2001. Dasboard (Software). [Online]. Availa-
ble: http://en.wikipedia.org/wiki/Dashboard_%28soft
ware%29
Sorenson, M. 2005. What is Dashboard [Online].
Available: http://searchcio.techtarget.com/definition/
dashboard.
Maarten, M. 2001. Digital Dashboard: Web Parts
Integrate with Internet Explorer and Outlook to Build
Personal Portals [Online]. Available: http://msdn.
microsoft.com/en-us/magazine/cc301617.aspx
Plimmer, B., Apperley, M. 2007. Making Paperless Work.
In Proceedings of the 7th ACM SIGCHI New Zealand
chapters international conference on Computer Human
interaction design centered HCI. ACM Press, pp. 1-8.
Steurbaut, K., Colpaert, K., Van Hoecke, S., Steurbaut, S.,
Danneels, C., Decruyenaere, J., De Turck, F. 2010.
Design and Evaluation of a Service Oriented
Architecture for Paperless ICU Tarification. Journal of
Medical Systems. pp. 1-14
Wayne W. Eckerson. 2006. Performance Dashboards:
Measuring, Monitoring, and Managing Your Business.
John Wiley and Sons.
Gormish, M., Piersol, K., Gudan, K., and Barrus, J. 2009.
An E-Writer For Documents Plus Strokes.
In Proceedings of the 9th ACM symposium on
Document engineering (DocEng '09). ACM, New
York, NY, USA, 157-160.
Matthew J. Bassignani, David A. Dierolf, David L. Roberts
and Steven Lee. 2010. Paperless Protocoling of CT
and MRI Requests at an Outpatient Imaging Center.
JOURNAL OF DIGITAL IMAGING, Volume 23,
Number 2, 203-210.
John M. Petrakis and Michael J. Engiles. 2000. Creating A
Paperless Municipal Court. In Proceedings of the 32nd
conference on Winter simulation (WSC '00). Society
for Computer Simulation International, San Diego, CA,
USA, 2029-2035.
Abigail J. Sellen and Richard H.R. Harper. 2003. The Myth
of the Paperless Office. MIT Press, Cambridge, MA,
USA.
Bos, T., Blanken, M., Huisman, H. 2011. Towards A
Paperless Air Traffic Control Tower. In Proceedings of
Reusability and Sustainability in Operations Dashboard - Comparative Study
95

the 2nd international conference on Human centered
design (HCD'11), Masaaki Kurosu (Ed.). Springer-
Verlag, Berlin, Heidelberg, 360-368.
Noor Nashriq, R., Ahmad Zuhairi, I., Mohd Haris, A.,
Nurul Haszeli, A. 2011. Operations Dashboard:
Comparative Study. International Conference on
Graphic and Image Processing [ICGIP 2011], 2011.
Plimmer B. 2010. A Comparative Evaluation Of
Annotation Software For Grading Programming
Assignments. In Proceedings of the Eleventh
Australasian Conference on User Interface - Volume
106 (AUIC '10), Christof Lutteroth and Paul Calder
(Eds.), Vol. 106. Australian Computer Society, Inc.,
Darlinghurst, Australia, Australia, 14-22.
Zhu, K., Nii, H., Fernando, O., Cheok, A. 2011. E-Letter:
A Paper-Based Instant Messaging System Using
Selective Wireless Power Transfer. In ACM
SIGGRAPH 2011 Posters (SIGGRAPH '11). ACM,
New York, NY, USA, Article 43, 1 pages.
Plimmer B., Mason P. 2006. A Pen-Based Paperless
Environment For Annotating And Marking Student
Assignments. In Proceedings of the 7th Australasian
User interface conference - Volume 50 (AUIC '06),
Wayne Piekarski (Ed.), Vol. 50. Australian Computer
Society, Inc., Darlinghurst, Australia, Australia, 37-44
Bharosa, N., Meijer, S., Janssen, M., Brave, F. 2010. Are
We Prepared? Experience From Developing
Dashboards For Disaster Preparation. 2010. In:
Proceedings of 7th International ISCRAM Conference,
Seattle, USA.
Marshall, C.C. 2009. Reading And Interactivity In The
Digital Library: Creating An Experience That
Transcends Paper. In: Proceedings of the
CLIR/Kanazawa Institute of Technology Roundtable.
Triola, M., Feldman, H., Pearlman, E., Kalet, A. 2004.
Meeting Requirements And Changing Culture: The
Development Of A Web-Based Clinical Skills
Evaluation System. J Gen Intern Med 2004; 19:490-
493.
Jain, J., Arim, I., Li, J. 2008.Designing Dashboards For
Managing Model Lifecycle. In: CHiMiT ‘08
Proceedings of the 2nd ACM Symposium on Computer
Human Interaction for Management of Information
Technology.
Nagios. [Online]. Available: http://nagios.com/ [Assessed:
Apr 20, 2012]
Cacti [Online]. Available: http://www.cacti.net/ [Assessed:
Apr 20, 2012]
Ganglia. [Online]. Available: http://ganglia.Source
forge.net/. [Assessed: Apr 20, 2012]
Opmanager. [Online]. Available: http://www.manage
engine.com/network-monitoring/ [Assessed: Apr 20,
2012]
Zenoss. [Online]. Available: http://www.zenoss.com/
[Assessed: Apr 20, 2012]
Zenoss Community. [Online] Available: http://community.
zenoss.org [Assessed: Apr 20, 2012]
Citrix. 2012. How to Manage NetScaler 9.2 Using SNMP
by Cacti. [Online]. Available: http://support.citrix.com/
article/CTX125187. [Assessed: Apr 20, 2012]
Nuryani Arisal, A., Suwarningsih, W., Wirahman, T. 2007.
Monitoring Cluster On Online Compiler With Ganglia.
Whitepaper in EEPIS Repository.
Josephsen, D. 2007. Building A Monitoring Infrastructure
With Nagios. Prentice Hall. 23-26.
Manage Engine. 2012. Availability Monitoring. [Online]
Available: http://www.manageengine.com/network-
monitoring/availability-monitoring.html. [Assessed:
Apr 20, 2012]
Bowling, J. 2008. Zenoss And The Art Of Network
Monitoring. Whitepaper. Linux Journal, Aug 01, 2008.
Webber, L., Michael Wallace. 2009. Green Tech: How To
Plan And Implement Sustainable IT Solutions.
AMACOM.
EHST/ICGREEN 2012
96
