
Single Input Single Output Time Series Artificial Neural Network
Models for Free Residual Chlorine Forecasting in Water Distribution
Networks
Selcuk Soyupak
1
, Hurevren Kilic
2
, Ibrahim Ethem Karadirek
3
and Habib Muhammetoglu
3
1
Civil Engineering Dept., KTO Karatay University,
Akabe Mah. Alaaddin Kap Cad. No:130, 42020, Karatay, Konya, Turkey
2
Department of Computer Engineering, Gediz University, Seyrek Kampusu, 35665, Menemen, Izmir, Turkey
3
Environmental Engineering Department, Akdeniz University, Dumlupinar Bulvari, 07058, Kampus, Antalya, Turkey
Keywords: Single Input Single Output Artificial Neural Networks, Time Series, Water Distribution Networks.
Abstract: The aim of this study is to investigate the utilization of Single Input Single Output Time Series Artificial
Neural Networks models as a forecasting tool for estimating Free Residual Chlorine levels at critical
locations of fairly complex Water Distribution Systems. The response surface methodology was adopted in
identifying performance and precision trends as a function of number of steps used as inputs and number of
steps ahead to predict (Horizons). The utilized response surfaces were for coefficient of determination and
mean absolute error. The creation of response surfaces was achieved by developing Artificial Neural
Network models for several combinations of number of steps used as inputs and number of steps ahead to
predict that enable the calculations of coefficient of determination and mean absolute error for the selected
combinations. Then these results have been assembled to obtain contour maps by distance weighted least
square technique. The maximum attained coefficient of determination levels were within the range 0.656 to
0.974, while minimum achievable mean absolute error levels were within the range 0.0080 to 0.0284 ppm.
The achieved mean absolute error is very low when compared with the followings: a) the applied Free
Residual Chlorine levels from the source which is about 0.5 ppm and b) the minimum detection limit of the
chlorine analyzers given as 0.01 ppm.
1 INTRODUCTION
Data driven artificial intelligence techniques provide
alternative solutions to deterministic approaches for
controlling and providing acceptable levels of Free
Residual Chlorine (FRC) levels in Water
Distribution Systems (WDSs). The reason for
shifting to data driven approaches from deterministic
approaches lies in the following facts: i) decay
kinetics of chlorine within water is nonlinear and it
is very complex to formulate while it is being
transported to consumption points (Gibbs et al.,
2003; May et al., 2004; Bowden et al., 2006; May et
al., 2008), ii) because of the mentioned complexity,
the dynamics of decay kinetics are usually
oversimplified by modelers to obtain solutions, that
reduce predictive powers of deterministic models
and consequently guarantees only low levels of
precision. One additional weakness of deterministic
models is the problem of unnecessary computational
efforts even for small WDSs (Polycarpou et al.,
2002). Finally, a major drawback of deterministic
models lies in the difficulties of accurately
predicting the future water demands as emphasized
by (May et al., 2008).
Milestone research within this field goes back to
the beginning of last decade (Rodriguez and
Serodes, 1999; Serodes et al., 2001). The data
requirement of Artificial Neural Network (ANN)
approach by these investigators includes the past
records of FRC levels at critical points, and at
chlorine dosing and application locations. They also
needed the past records of variables at dosing points
that were expected to influence chlorine decay in
WDSs. The literature indicates adoption of a variety
of data driven approaches under different application
conditions. A control oriented model using ANN
methodology has been developed and compared
with autoregressive moving average (ARMA)
588
Soyupak S., Kilic H., Karadirek I. and Muhammetoglu H..
Single Input Single Output Time Series Artificial Neural Network Models for Free Residual Chlorine Forecasting in Water Distribution Networks.
DOI: 10.5220/0004171105880593
In Proceedings of the 4th International Joint Conference on Computational Intelligence (NCTA-2012), pages 588-593
ISBN: 978-989-8565-33-4
Copyright
c
2012 SCITEPRESS (Science and Technology Publications, Lda.)

approaches as forecasters; ANN gave better results
(May et al., 2004). A multi-layer perceptron (MLP)
ANN with back-propagation has been developed by
selecting the inputs required with adoption of three
different techniques (Gibbs et al., 2003, Sharma,
2000). The MLP model performed better than
traditional linear regression (Gibbs et al., 2003).
Further MLP ANN was indicated to be implemented
as an online tool to aid in the determination of
chlorine levels (Gibbs et al., 2003). A general
regression neural network (GRNN) model for
forecasting FRC levels within a WDS has also been
developed (Bowden et al., 2006). The GRNN model
was shown to perform better than a multiple linear
regression (MLR) model as a forecaster. Some
investigators have emphasized the importance of the
Input Variable Selection (IVS) for modeling and
forecasting the residual chlorine dynamics within
WDSs (Serodes et al., 2001; Gibbs et al., 2006). In
recent years, some progress has been achieved as
related to solving IVS problem. Wrapping and
filtering are two basic classes of approaches to IVS
problem (May et al. 2008 b). The wrapping
methodology as a search process has the objective of
obtaining best performance of the calibrated model
(Serodes et al., 2001). Filtering methodology is a
model-free approach where linear correlation
coefficient and mutual information have been
proposed as two measures of dependence for input
variable selection (Sharma, 2000; May et al. 2008
b). A recent study has shown that multiple input
ANN models with high predictive power and
precision can be developed for WDSs supplied with
high quality waters; however, these models can be
utilized only for forecasting purposes. The study has
further questioned the applicability and validity of
multiple input ANN models as control instruments
for FRC levels for systems similar in nature to the
system investigated within the scope of this earlier
work (TUBITAK, 2009).
In this particular research, we have investigated
the possibility of developing Single Input Single
Output Time Series Artificial Neural Networks
(SISO-TS-ANN) that utilize appropriate Number of
Steps Used As Inputs (NSUAI) and number of steps
ahead to predict (H), so that the developed models
can be utilized as an efficient and economical
forecasting instrument. The question of selecting
appropriate NSUAI and appropriate number of H
has been answered by utilizing response surfaces for
coefficient of determination (R
2
) and Mean Absolute
Error (MAE). The coefficient of determination (R
2
)
and mean absolute error (MAE) are commonly
utilized statistical entities for judging model validity
or quality of fit (StatSoft’s STATISTICA Electronic
Statistics Textbook, 2012). R
2
values are calculated
using model predictions and measurements as
variables. In order to realize the goals of the
research, a WDS operated by ASAT (Antalya Water
and Wastewater Administration, Turkey) has been
selected as pilot. The following sections first present
the properties of the studied WDS and monitoring
program, as a summary. Secondly, the details of the
adopted SISO-TS-ANN modeling approach and the
adopted response surface methodology are given.
The methodology gives general guidelines to select
the best location specific NSUAI and H
combinations for models with high predictive power
and precision. Finally, results are presented and
discussed in detail.
2 METHOD
2.1 Antalya Konyaalti WDS
The SISO-TSS-ANN models have been developed
for Antalya Konyaalti Water Distribution System
(KWDS) operated by ASAT, as depicted in Figure
1. The pilot network is one of the major sub-
networks of Antalya water supply system. The area
that being served by KWDS has the following
properties: i) It can be operated independently, ii)
The area has supervisory control and data
acquisition system (SCADA) infrastructure, iii) The
WDS is relatively new. The raw water source is
groundwater which is pumped to the network after
chlorination at Bogacay Pumping Station and
Reservoir. Chlorination is not applied at any other
location within KWDS. There is one balancing
reservoir and eight monitoring stations operated with
the existing SCADA system to collect on-line data
to achieve the goals of this specific research.
Figure 1: Map showing KWDS and Antalya WDS with
monitoring stations, reservoirs and pumping station.
SingleInputSingleOutputTimeSeriesArtificialNeuralNetworkModelsforFreeResidualChlorineForecastinginWater
DistributionNetworks
589

The established monitoring stations can collect on-
line water quality data sets for FRC, temperature
(T), electrical conductivity (EC), pH and turbidity
(Turb). Pressure (P) and water flow rates (Q) are
also being recorded on-line and continuously for the
monitoring stations: Bogacay Pumping Station and
Reservoir, ON 67, ON 68, ON 70, ON 71, ON 72,
ON 73 , ON 74 and Hurma Balancing Reservoir
(Figure 1). These parameters are expected to
influence FRC levels and its decay kinetics in WDS.
Data sets from the analyzers were recorded and
stored at five-minute intervals at SCADA center. For
this study, these data sets were converted into
quarterly averaged values. We have utilized the
water quality and operational data provided by
ASAT for the months September 2009 and October
2009 for the above mentioned monitoring stations.
There was some missing data within time series for
some of the parameters due to short time power
failures and due to unavoidable operational
problems. Missing data points were generated
synthetically by averaging the earlier and following
values. The number of missing information was
relatively few.
2.2 Selection of Input Variables
The purpose of ANN modeling in WDS field of
water resources engineering is in general to obtain a
mathematical tool to calculate the necessary input
levels at control points to satisfy the desired levels of
chlorine in future at the critical points of WDS. In
this study, the control point is Bogacay Pumping
Station and Reservoir and the critical points are the
other monitoring stations namely ON 67, ON 68,
ON 70, ON 71, ON 72, ON 73, ON 74 and Hurma
Balancing Reservoir (Figure 1). An earlier study
(TUBITAK, 2009) has suggested that in cases where
supplied water quality is high and where the chlorine
decay rates are very low, tools other than classical
ANN methodology with multiple inputs should be
investigated and adopted for more simplified
modeling. Because of this observation, in this
research only single controllable input, namely Free
Residual Chlorine at Bogacay Pumping Station and
Reservoir (FRC
Bogacay
), has been utilized. Further,
the collection of data for model building has been
realized in such a way that the specifically created
FRC perturbations within control point has created
FRC time series at monitoring points that are
suitable to develop SISO-TS-ANN models for
control purposes as consistent with (TUBITAK,
2009).
2.3 Model Building
Through this research we wanted to investigate the
applicability of SISO-TS-ANN models developed as
a FRC control tool and as a forecaster for a fairly
complex WDS with high quality raw water input.
The selected single input was FRC
Bogacay
. In order to
initiate ANN modeling one has to decide about
selecting NSUAI and H. In order to establish criteria
to select the best combinations of NSUAI and H for
different monitoring stations, we have adopted
response surface methodology for R
2
and MAE. The
creation of response surfaces required selection of
experimental matrix that covers reasonable and
practical combinations of (NSUAI,H), including
(8,2), (8,4), (8,8), (12,2), (12,4), (12,8), (24,2),
(24,4), (24,8), (48,2), (48,4), (48,8), (72,2), (72,4),
(72,8), (96,2), (96,4), (96,8). The tested NSUAI
values were 8, 12, 24, 48, 72 and 96. The tested H
values were 2, 4 and 8. The R
2
and MAE values have
been estimated for each combination of NSUAI and
H; then the contour plots were prepared by using
STATISTICA (SANN, 2008). SISO-TS-ANN
models for forecasting FRC levels at monitoring
stations have been developed utilizing the software
SANN ANS (Statistica Automated Neural Network-
Automated Network Search) package (SANN,
2008). Modeling constraints were as follows: 1)
Minimum and maximum numbers of hidden neurons
were 3 and 11 respectively, 2) 20 candidate
structures have been tested for each data set and only
the one with best performance and precision was
requested to be retained. MLP approach has been
instructed to be utilized.
The best SISO-TS- ANN for each monitoring
station has been found by examining the response
surfaces developed for that station. Several different
combinations of types of hidden and output
activation functions, number of neurons, number of
steps used as inputs (NSUAI) and number of steps
ahead to predict (H) have been tested and the one
that minimizes MAE and maximizes R
2
has been
selected and listed in Table 1.
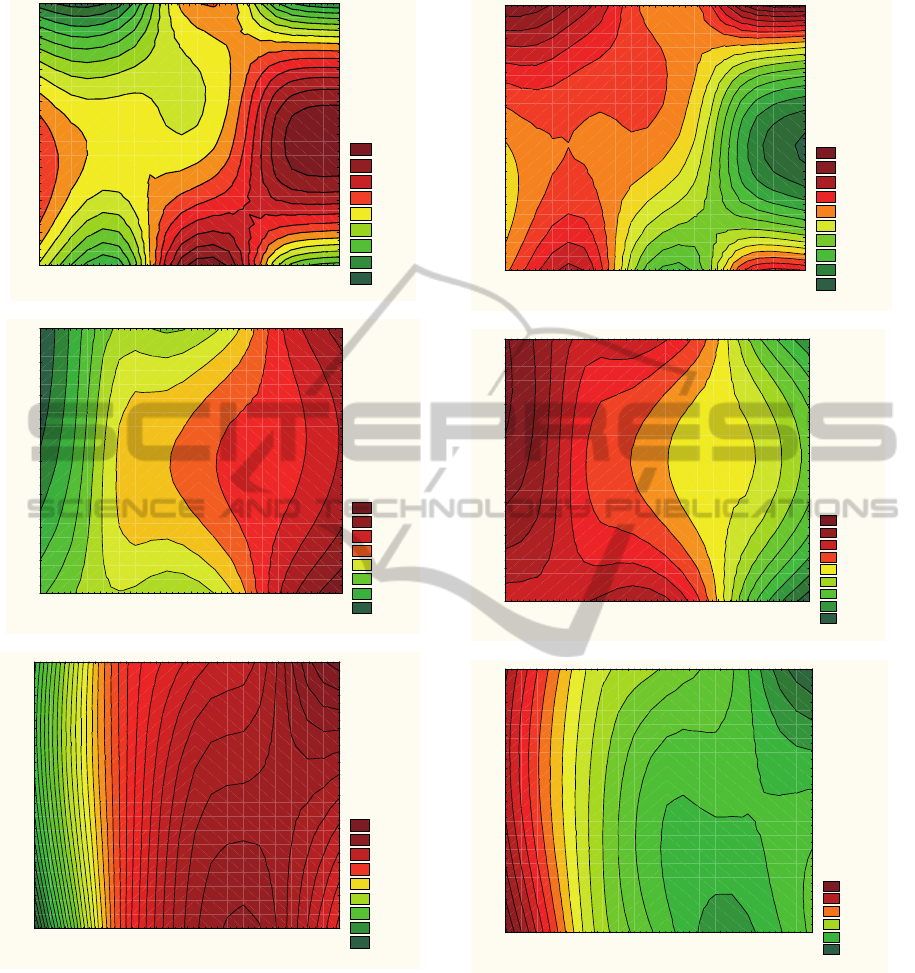
3 RESULTS AND DISCUSSIONS
The developed response surfaces as contour plots for
R
2
and MAE are given in Figures 2 and 3
respectively. These figures cover response surfaces
for monitoring stations ON69, ON71 and Hurma
balancing reservoir only. Similar response surfaces
are obtained for other monitoring stations as well. In
order to save space, only the response surfaces of
IJCCI2012-InternationalJointConferenceonComputationalIntelligence
590
> 0.94
< 0.94
< 0.92
< 0.9
< 0.88
< 0.86
< 0.84
< 0.82
< 0.8
0 102030405060708090100
NSUAI
1
2
3
4
5
6
7
8
9
H
(a) ON-69
> 0.98
< 0.98
< 0.96
< 0.94
< 0.92
< 0.9
< 0.88
< 0.86
0 102030405060708090100
NSUAI
1
2
3
4
5
6
7
8
9
H
(b) ON-71
> 0.85
< 0.83
< 0.78
< 0.73
< 0.68
< 0.63
< 0.58
< 0.53
< 0.48
0 102030405060708090100
NSUAI
1
2
3
4
5
6
7
8
9
H
(c) Hurma Balancing Reservoir
Figure 2: Contour plots for R
2
against number of steps
used as inputs (NSUAI) and number of steps ahead to
predict (horizons).
three stations are presented here. If we examine the
response surfaces for different stations, the
following strategies for selecting NSUAI and H
combinations can be reached:
1) The suggested NSUAI and H levels for
monitoring station ON69: The dynamics of
KWDS
dictate to utilize as much past data as
> 0.032
< 0.032
< 0.03
< 0.028
< 0.026
< 0.024
< 0.022
< 0.02
< 0.018
< 0.016
0 102030405060708090100
NSUAI
1
2
3
4
5
6
7
8
9
H
(a) ON-69
> 0.02
< 0.02
< 0.018
< 0.016
< 0.014
< 0.012
< 0.01
< 0.008
< 0.006
0 102030405060708090100
NSUAI
1
2
3
4
5
6
7
8
9
H
(b) ON-71
> 0.036
< 0.034
< 0.03
< 0.026
< 0.022
< 0.018
0 102030405060708090100
NSUAI
1
2
3
4
5
6
7
8
9
H
(c) Hurma Balancing Reservoir
Figure 3: Contour plots for MAE against number of steps
used as inputs (NSUAI) and number of steps ahead to
predict H (horizons).
possible for this station; however the forecasting
horizon should be kept about 4 to 6 (1 to 1.5
hours) so that maximum R2 and minimum MAE
values can be attained (Please refer Figures 2-a
and 3-a).
2) The suggested NSUAI and H levels for
monitoring station ON71: The general trend is to
SingleInputSingleOutputTimeSeriesArtificialNeuralNetworkModelsforFreeResidualChlorineForecastinginWater
DistributionNetworks
591
utilize as many past data as possible for this
station since Figure 2-b indicates that as NSUAI
reaches to 96 (= 1 day) , R
2
values is about 96 %.
The same trend is also obvious from Figure 3-b
that indicates the reduction and minimization of
MAE as NSUAI increases. Both Figures 2-b and
3-b indicate to keep forecasting horizon either
lowest or highest for the studied range.
3) The suggested NSUAI and H levels for
monitoring station Hurma Balancing Reservoir:
The general trend suggests the utilization of as
many past data as possible for this station since
Figure 2-c indicates that as NSUAI reaches to 96
(= 1 day) , R
2
values is more than 85 %. Figure
3-c indicates the reduction and minimization of
MAE as NSUAI increases. Figure 3-c further
suggests keeping forecasting horizon as large as
possible to minimize MAE.
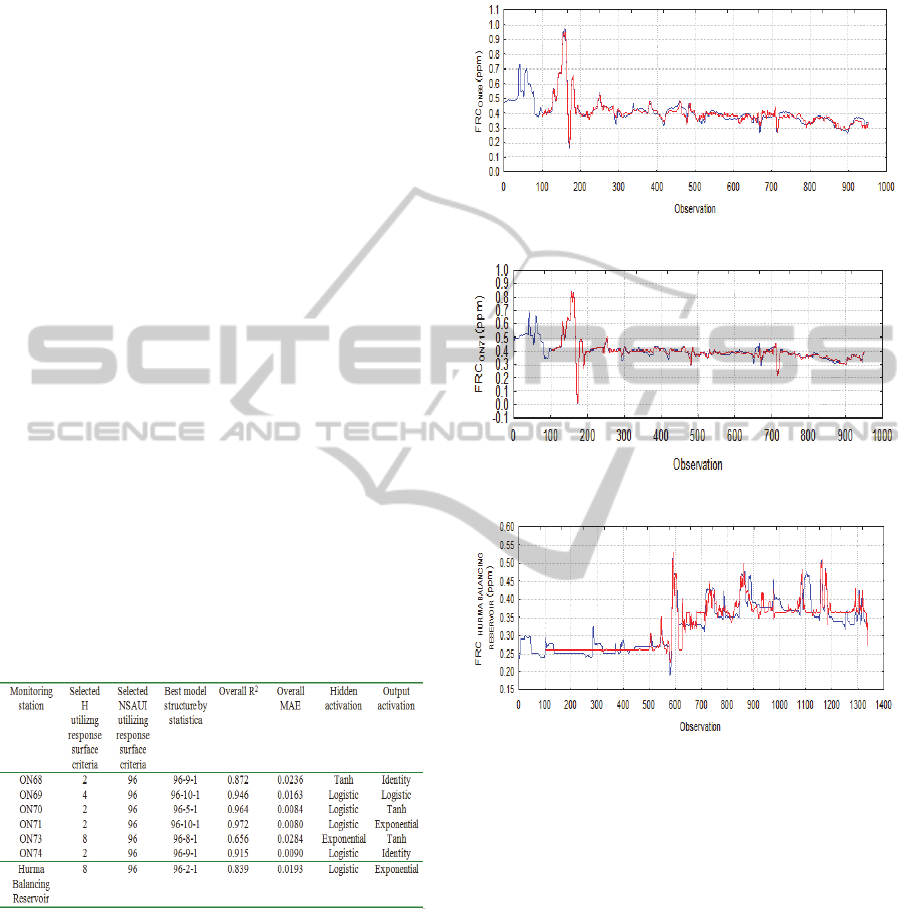
The best SISO-TS-ANN models for these
monitoring stations as suggested by response
surfaces are summarized in Table 1. For ON 69,
maximum attainable R
2
was very high (0.946) and
MAE value was less than 0.02 ppm (0.0163 ppm).
For ON 71, maximum attainable R
2
was even higher
(0.972) and the corresponding minimum MAE was
0.008 ppm. For Hurma balancing reservoir, the
attainable performance and precision levels were
also satisfactory with 0.839 and 0.0193 ppm values
of R
2
and MAE levels respectively.
Table 1: The performance levels of SISO-TS-ANN model
structures as suggested by R
2
and MAE response surfaces.
Figure 4 summarizes the model predictions and
measurements as comparative time series.
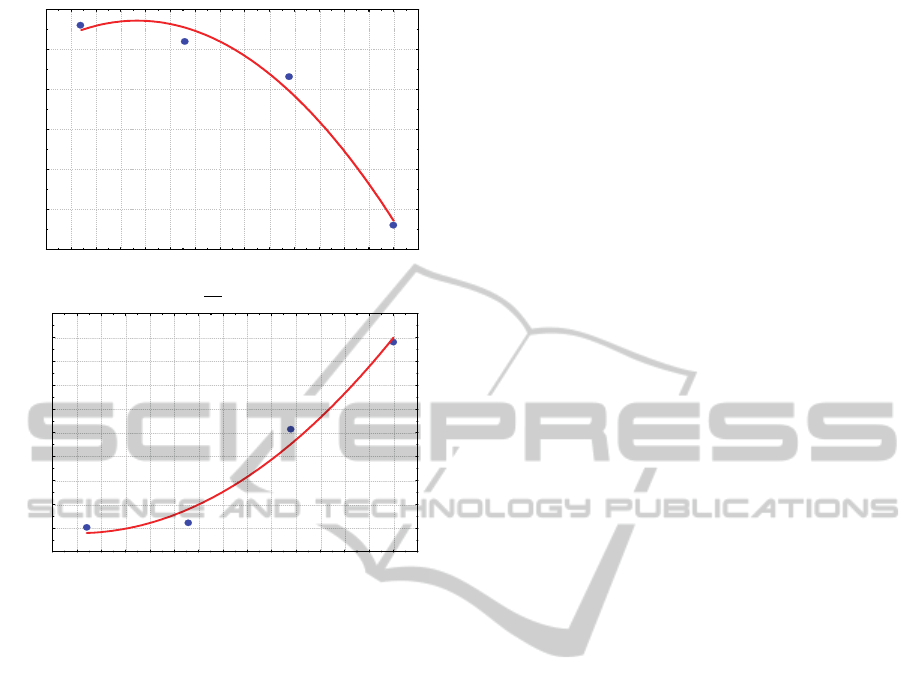
Note that one may not still observe the impact of
traveling time from the figured out results because
of dynamically changing complex nature of the
network under study. However, we can at least say
that as the distance from major source of chlorine
water supply increases, R
2
values decrease in a
nonlinear fashion and MAE values increase again in
non-linear fashion.
One of the major concerns was to establish
trends for precision and performance levels as a
function
of distance from major source of chlorine.
(a) Measured FRC (Blue) and MLP 96-10-1 Model (Red)
results for ON-69.
(b) Measured FRC (Blue) and MLP 96-10-1 Model (Red)
results for ON-71.
(c) Measured FRC (Blue) and MLP 96-10-1 Model (Red)
results for Hurma Balancing Reservoir.
Figure 4: SISO-TS-ANN model predictions and
measurements for ON69, ON71 and Hurma Balancing
Reservoir monitoring stations.
This was achieved by preparing non-linear plots of
maximum attainable R
2
and MAE as a function of
distance from chlorine feeding station, Bogacay
Pumping Station and Reservoir, see Figure 5.
4 CONCLUSIONS
Modelers prefer simple structures that give highest
precision and performance. This study has shown
that SISO-TSS-ANN models that have only single
input and single output can be efficiently utilized as
FRC forecasting tools in complex WDSs that are
IJCCI2012-InternationalJointConferenceonComputationalIntelligence
592
1.4 1.6 1.8 2.0 2.2 2.4 2.6 2.8 3.0 3.2 3.4 3.6 3.8 4.0 4.2 4.4
Distance from chlorine feeding location (km)
0.86
0.88
0.90
0.92
0.94
0.96
0.98
Maximu m a t t ain a b le R
2
(a)
1.41.61.82.02.22.42.62.83.03.23.43.63.84.04.24.4
Distance from chlorine feeding location (km)
0.006
0.008
0.010
0.012
0.014
0.016
0.018
0.020
0.022
0.024
0.026
Min imum at t a in a ble MAE(p pm)
(b)
Figure 5: Maximum attainable R
2
and minimum attainable
MAE as a function of distance from source of chlorine
supply.
supplied with raw waters of low FRC decay rates.
This may bring the possibility of reduction of
monitored variables in future that will create the
minimization of cost of monitoring. One of the
major conclusions is: irrespective of the locations of
the monitoring stations, utilization of maximum past
information for the single input has yielded best
results. We could not create any generalized rule for
the number of forecasting horizons that will yield
the best results. The number of forecasting horizons
should be specifically determined for each station by
examining its response surfaces. Therefore,
preparation of response surfaces for R
2
and MAE is
very useful in selecting best combinations of NSUAI
and H for developing forecasting tools.
REFERENCES
Bowden, G. J., Nixon, J. B., Dandy, G. C., Maier, H. R.,
Holmes, M., 2006. Forecasting chlorine residuals in a
water distribution system using a general regression
neural network. Mathematical and Computer
Modelling, 44, 469-484.
EPANET 2, 2000. Users’ Manual. Lewis A. Rossman,
Cincinnati, OH, USA.
Gibbs, M. S., Morgan, N., Maier, H. R., Dandy, G. C.,
Holmes, M., Nixon, J.B., 2003. Use of artificial neural
networks for modelling chlorine residuals in water
distribution systems. Modsim 2003 - International
Congress on Modelling and Simulation, Townsville.,
Australia, Part 2, 789-794.
May, R. J., Maier, H. R., Dandy, G. C., Nixon, J. B., 2004.
Control-oriented water quality modelling using
artificial neural networks. Proceedings on CD-ROM,
Enviro '04, Sydney, Australia.
May, R. J., Dandy, G. C., Maier, H. R., Nixon, J. B., 2008.
Application of partial mutual information variable
selection to ANN forecasting of water quality in water
distribution systems, Environmental Modelling and
Software 23, 1289–1299.
May, R. J., Maier, H. R., Dandy, G. C., Fernando,
T.M.K.G., 2008b. Non-linear variable selection for
artificial neural networks using partial mutual
information. Environmental Modelling and Software,
23, 1312-1326.
Polycarpou, M. M., Uber, J. G., Wang, Z., Shang, F.,
Brdys, M. A., 2002. Feed-back control of water
quality. In: IEEE Control Systems Magazine, pp. 68–
84.
Rodriguez, M. J., Sérodes, J. B., 1999. Assessing
empirical linear and non-linear modelling of residual
chlorine in urban drinking water systems.
Environmental Modelling and Software, 14, 93-102.
SANN (Statistica Automated Neural Network Software),
Stat Com, 2008.
Sharma, A., 2000. Seasonal to inter-annual rainfall
probabilistic forecasts for improved water supply
management: Part 1 – a strategy for system predictor
identification. Journal of Hydrology, 239 (1-4), 232 –
239.
Sérodes, J. B., Rodriguez, M. J., Ponton, A., 2001.
Chlorcast(c): a methodology for developing decision-
making tools for chlorine disinfection control.
Environmental Modelling and Software 16, 53-62.
Statsoft, 2012, Statistica Electronic Statistics Text book.
TUBITAK Proje Gelişme Raporu, 2009. İçme suyu
dağıtım sebekelerinde optimum klorlama
uygulamalarının matematiksel modeller kullan
ılarak
gerçekleştirilmesi ve dezenfeksiyon sistemlerinin
Yönetimi, Proje No:107G088, Antalya (Turkey) (In
Turkish).
SingleInputSingleOutputTimeSeriesArtificialNeuralNetworkModelsforFreeResidualChlorineForecastinginWater
DistributionNetworks
593
