
Prediction of the Behaviours by the Prismatic Beams
with Polypropylene Fibers under High Temperature Effects
through Artificial Neural Networks
Fatih Altun and Tamer Dirikgil
Department of Civil Engineering, Erciyes University, Kayseri, Turkey
Keywords: Polypropylene Fiber, Concrete, High Temperature, Flexure Strength, Multilayer Perceptron, Radial Basis
Function Neural Network.
Abstract: In order to improve the mechanical qualities of a concrete, various kinds of fibers are added to the concrete.
In the studies, polypropylene (PP) fibers are employed as a fiber type. It has a significant place in the
researches that PP fibers not only improve the mechanical qualities of the concrete under normal
temperatures, but also prevents the bursting of the concrete with the internal vapour compression under high
temperatures. The distributions and locations of the fibers in the concrete and the variables employed for
experimental proceedings affect the mechanical results. This makes it difficult to link the obtained results to
each other. In order to establish a complicated link, it is inevitable to create a learning mechanism. In this
study, multilayered perceptrons (MLP) and radial basis function artificial neural network (RBFNN) models
were used and their flexure strengths were sought to be predicted. Both of the neural network models put in
a successful performance and enabled the prediction of the experimental results with a satisfying
approximation.
1 INTRODUCTION
It is practically not possible to empirically state the
effects of locations of the fibers, homogeneity of the
fibers and the different temperatures on the
mechanical qualities of a concrete. Therefore, it is
complicated to predict the behaviours of the concrete
with similar qualities by the data in hand. To model
and anticipate the complicated systems depending
on the input-output data and/or unknown behaviours,
methods to develop mathematical models in various
fields of civil engineering have been employed
(Astrom and Eykhoff, 1971).
In this study, bending tensile strengths of the
concrete with PP fiber addition are predicted using
the multilayered perceptron neural network and
radial basis function artificial neural network
models. For both of the models, the same input,
validation, and testing data were used. Addition of
split tensile strength obtained through experimental
studies to the variables on which experimental
proceedings were applied in the entry parameters
made it more difficult to link between the input-
output data. Ultimately, the performance of the two
different artificial neural network models was found
to be satisfying.
2 EXPERIMENTAL PROCEDURE
The samples produced during the experimental study
comprised of members with 40 MPa characteristic
compressive strength and in the C35/45 concrete
class (
TS EN 206/1, 2002). Samples were cured in
periods of 7,28 and 90 days and made ready. In
addition to the room temperature (24.5 ºC), five
more temperature effects of 100 ºC, 200 ºC, 400 ºC,
600 ºC and 800 ºC were employed. The samples
under the room temperature were assessed as the
reference samples for the other temperature effects.
Following the heating period, the temperature in the
oven was left to cool by itself with its lid closed until
it decreased to room temperature in order to keep the
experimental samples from exposing to the effects of
abrupt temperature changes. Table 1 and Table 2
shows the 216 cylinder and prismatic samples
according to each fiber type, volumetric fiber ratio,
and cure period and temperature value.
611
Altun F. and Dirikgil T..
Prediction of the Behaviours by the Prismatic Beams with Polypropylene Fibers under High Temperature Effects through Artificial Neural Networks.
DOI: 10.5220/0004114006110615
In Proceedings of the 4th International Joint Conference on Computational Intelligence (NCTA-2012), pages 611-615
ISBN: 978-989-8565-33-4
Copyright
c
2012 SCITEPRESS (Science and Technology Publications, Lda.)
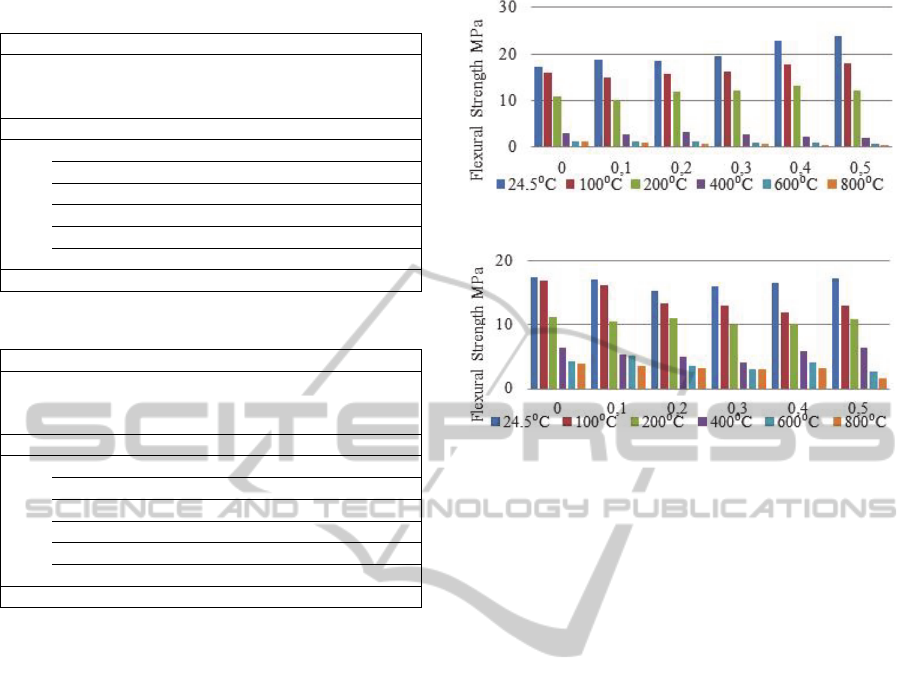
Table 1: Cyclindrical Samples.
Cyclindrical Samples (150x300mm)
Day
Temp.
(°C)
Polypropylene Fiber Ratio
(% Volumetrical)
FP ; MFP
0.0 0.1 0.2 0.3 0.4 0.5
7,
28,
90
24.5 1 1 1 1 1 1
100 1 1 1 1 1 1
200 1 1 1 1 1 1
400 1 1 1 1 1 1
600 1 1 1 1 1 1
800 1 1 1 1 1 1
Total 2x6x3x6=216
Table 2: Prismatic Samples.
Prismatic Samples (150x150x750mm)
Day
Temp.
(°C)
Polypropylene Fiber Ratio
(% Volumetrical)
FP ; MFP
0.0 0.1 0.2 0.3 0.4 0.5
7,
28,
90
24.5 1 1 1 1 1 1
100 1 1 1 1 1 1
200 1 1 1 1 1 1
400 1 1 1 1 1 1
600 1 1 1 1 1 1
800 1 1 1 1 1 1
Total 2x6x3x6=216
3 EXPERIMENTAL RESULTS
Addition of polypropylene fibers improved the
bending strength of the sample until 200ºC, but in
the samples that had been exposed to higher
temperatures, the change in the fiber ratio had no
contribution. With the increase in the cure period of
the sample, bending strength of the samples
increased. In the Figures 1-3 the bending strengths
of the prismatic samples for 7, 28 and 90 days are
given respectively.
Under high temperature values, bending strength
decreased also together with the increase in the fiber
ratio. Therefore, it can be stated that the local
caverns created by the melting PP fibers in the
sample adversely affect the behaviour of a member
when bending. The Multifilament Polypropylene
(MFP) fibers did not contribute to the bending
strengths of the samples under the room temperature
and 100 ºC as much as the Flament (FP) fibers did.
As the MFB fiber ratio increased, the bending
strength was observed to decrease. However, the
bending strength of the samples with MFP above
200ºC temperature values was measured to be higher
than those with FP fibers.
Figure 1: Flexural Strength of Prismatic Samples-7 Days.
Figure 2: Flexural Strength of Prismatic Samples-28 Days.
4 ARTIFICIAL NEURAL
NETWORK MODELS
For the prediction of the experimental data obtained
from the study, MLP artificial neural network model
and RBF neural network models were used.
Considering the error values and determination
coefficients between the observed and predicted
data, the performance of the models were evaluated
together.
In the first place, the experimental parameters to
be used in the models were identified and then the
training, validation and testing data were classified.
A total of 512 samples with different fiber types,
fiber ratios, and cure periods and which were
exposed to different temperature effects were
evaluated. Of the 512 samples, 216 were cylinder
samples with a size of 150x150x300 each and the
other 216 were prismatic samples with a size of
150x150x300mm each produced with the same
concrete mixture. Therefore, in the applications,
evaluations were made for the compression strengths
of 216 cylinder samples and the bending tensile
strength of the prismatic samples with the same
materialistic qualities.
In each model, considering the same input
parameters, 5 input parameters were used. Under the
light of these data, the prediction for 1 output
parameter was made and its error ratio and
correlations were evaluated. The input parameters
were set as the fiber type used to prepare the sample
IJCCI2012-InternationalJointConferenceonComputationalIntelligence
612
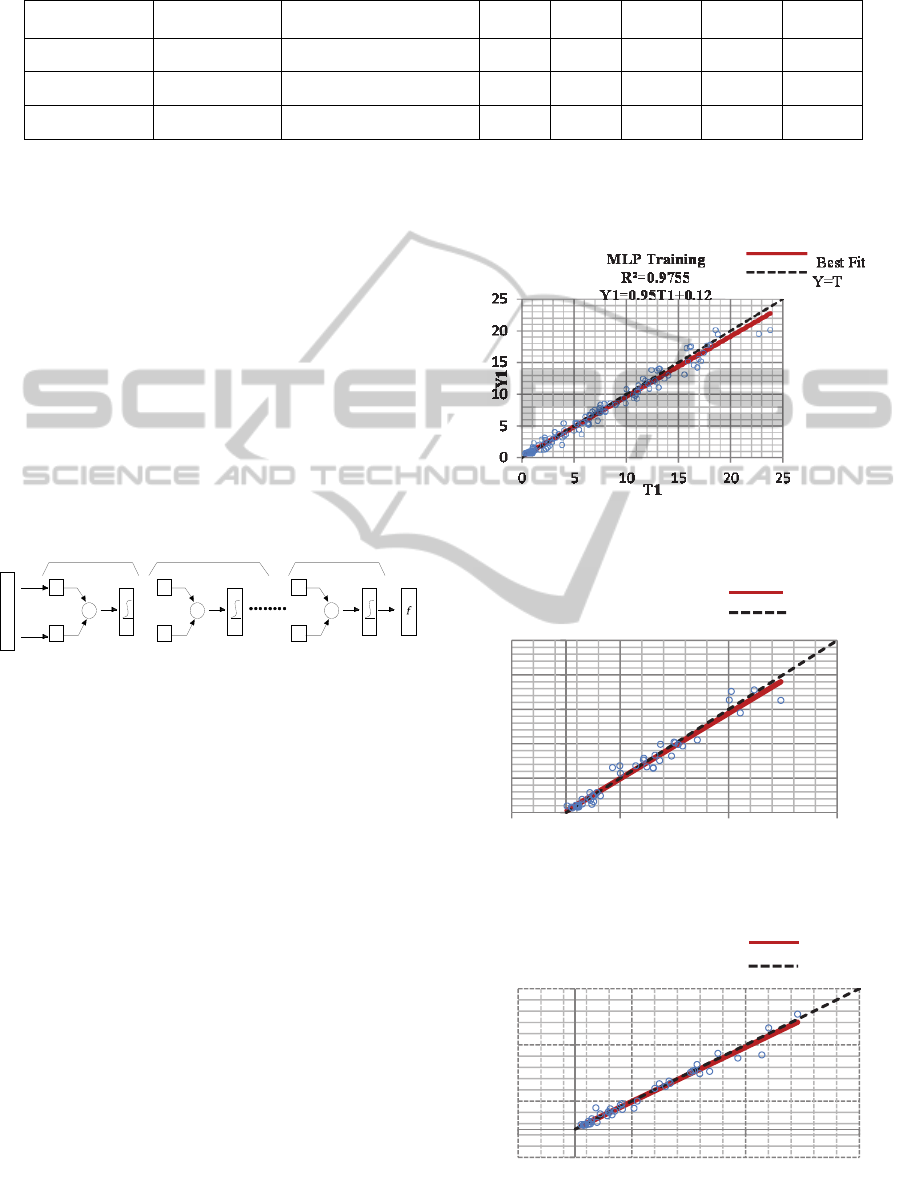
Table 5: Error values for MLP performance.
Hidden Layer
Number of first
layer neuron
Transfer Function
R
2
MSE RMSE MAE MARE
3 6 tansig-logsig-logsig-tansig 0.9734 0.6990 0.8361 0.5594 14.7446
2
5 logsig-logsig-tansig 0.9804 0.5099 0.7140 0.5063 14.6786
1 6 tansig- logsig 0.9826 0.4614 0.6793 0.5095 18.4026
mixtures (Ft), the split tensile strength of the
cylinder samples (sfc), volumetric fiber ratio in the
mixture (FR), temperature (T), and cure period (Cp).
The output parameter is the bending strength of
the prismatic samples (Md). The 216 data used in
themodel were classified with random selection 60%
reserved for training, 20% for validation and 20%
for testing phases. In order to make the models learn
the same data and predict the same test data, the
same training, validation and testing data were used
in both models.
The data used in the artificial Neural networks
were normalized first and then scaled.
4.1 Multilayer Perceptron (MLP)
Figure 3: Example architecture for one of the MLP
models.
For the design of MLP model, the number of
neurons in the hidden layer, activation (transfer)
function and the learning algorithm are of
importance. In the study, the MLP neural network
model was created in three forms using 3,2 and 1
hidden layers (Figure 4). The table 5 shows the
transfer function between the input layer and first
two hidden layers and the transfer functions whereby
the best prediction results were obtained between the
input layer and hidden layers. The transfer function
for the output layer is called “purelin”. As for the
learning function, it is the “trainlm” function which
updates its tendency values and weights according to
Levenberg-Marquart optimization. “Trainlm” is a
very quick learning function but needs a great deal
of memory for analysis (Matlab Software, R2009b).
The Figures 4, 5, and 6 show the performance of
the model depending on the values predicted during
the training, verifying and testing phases and the
correlation between the targeted values
The Figure 7 presents the fluctuation graph
between the values obtained during the testing phase
and the targeted values.
Figure 4: MLP correlation of training.
Figure 5: MLP correlation of validation.
Figure 6: MLP correlation of testing.
a1=logsig(IW1,1p¹+b1)
IW1,1
b1
+
IW2,1
b2
LW5,1
b5
INPUTLAYER
HIDDENLAYER(x3)
OUTPUTLAYER
P1
1
+
a2=logsig(IW2,1q¹+b2)
R=5
log‐sigmoid log‐sigmoid log‐sigmoid
R
0
5
10
15
20
25
‐5 5 15 25
Y2
T2
MLP Validation
R²=0.9552
Y2=0.95T2+0.18
‐5
5
15
25
‐5 5 15 25
Y3
T3
MLP Testing
R²=0.9734
Y3=0.97T3+0.056
Best Fit
Y=T
Best Fit
Y=T
PredictionoftheBehavioursbythePrismaticBeamswithPolypropyleneFibersunderHighTemperatureEffectsthrough
ArtificialNeuralNetworks
613
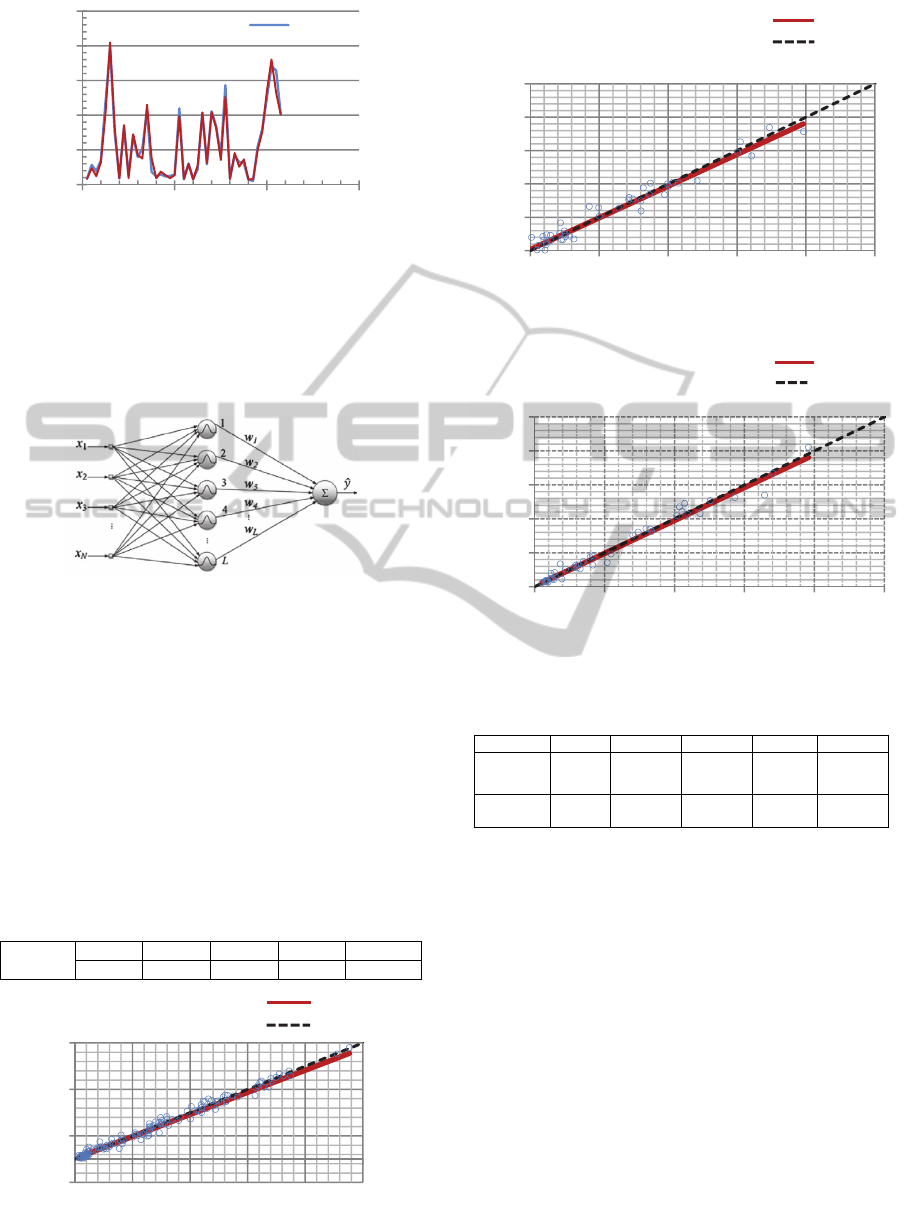
Figure 7: Coherence between target and predicted values
for MLP.
4.2 Radial Basis Function ANN
(RBFNN)
30 neurons have been used in this model.
Figure 8: Typical Radial Basis Function ANN
(Alexandridis et al., 2012).
Table 6 shows the error values obtained from the
radial basis neural networks
Figures 9, 10 and 11 present the performance
depending on the correlation between the values
predicted during the training, verifying and testing
phases and targeted values.
Table 7 states the obtained results from the
models and experimental data. Moreover, Table 8
states the mean absolute errors between the real and
predicted values for each data.
Table 6: Error values for RBFNN performance.
RBFNN
Testing
R
2
MSE RMSE MAE MARE
0.9581 0.6456 0.8035 0.5572 14.5678
Figure 9: RBFNN correlation of training.
Figure 10: RBFNN correlation of validation
Figure 11: RBFNN correlation of testing.
Table 7: Obtained results from the models and
experimental data.
Model R
2
MSE RMSE MAE MARE
MLP
Testing
0.9734 0.5099 0.7140 0.5063 14.6786
RBFNN
Testing
0.9581 0.6456 0.8035 0.5572 14.5678
5 CONCLUSIONS
This study followed the transformations in the
mechanical qualities of the concrete with
polypropylene fiber addition when exposed to
temperature and evaluated this transformation via
artificial neural networks. The link between the
transformation in the split tensile strength, cure
period, fiber type and temperature parameters and
bending strength has been provided.
Both of the models performed well in predicting
the experimental data of the bending strength. The
single hidden layer used in the multi layered model
created a fairly good correlation between the data.
However, as the error margin for predicting the
small values within the target values was wide, mean
0
5
10
15
20
25
0204060
Target…
SizeofTestin
g
Flexural
Strength
‐5
5
15
25
0 5 10 15 20 25
Y1
T1
RBFNNTraining
R²=0.9855
0
5
10
15
20
25
0 5 10 15 20 25
Y2
T2
RBFNNValidation
R²=0.9750
Y2=0.98T2+0.13
0
5
10
15
20
25
0 5 10 15 20 25
Y3
T3
RBFNNTesting
R²=0.9581
Y3=0.94T3+0.46
Best Fit
Y=T
Best Fit
Y=T
Best Fit
Y=T
IJCCI2012-InternationalJointConferenceonComputationalIntelligence
614

absolute relative error was found to be relatively
higher. When two hidden layers were used, smaller
MARE and MAE values were obtained. Three
hidden layers led to a decrease in the correlation and
to an additional increase in the errors. However,
error values were smaller than those in the single
hidden layered model. As the number of the hidden
layers increased, it caused the predictions to diverge
from the target as it increased the amount of weight
coefficients.
The mean absolute relative error values obtained
from the radial basis function neural network model
were lower. As such, it can be said that the model is
more successful in predicting the small target values
with less errors. However, the higher numbers of
mean absolute and square errors implicates that the
performance of the model was a little bit worse. As
the data to be predicted by the models were
randomly arrayed, there occurred an abrupt increase
or decrease between the previous values and the
following values. These changes led to a decrease in
the prediction performance and an increase in the
model errors. The error ratios of the radial basis
network resulting from these abrupt data changes
were lower than the multilayered network.
Both of the neural network models used in this
study performed successfully and enabled the
prediction of experimental values with satisfying
approximation.
ACKNOWLEDGEMENTS
Experimental part of this study was supported by
Scientific Research Project Units of Erciyes
University. (FBY-471)
Some part of this study was supported by
Scientific Research Project Units of Erciyes
University. (FBA-11-3462)
REFERENCES
Alexandridis, A., Triantis, D., Stavrakas, I., Stergiopoulos,
C., 2012. A neural network approach for compressive
strength prediction in cement-based materials through
the study of pressure-stimulated electrical signals.
Construction and Building Materials, vol. 30, pp.
294–300.
Astrom, K. J., Eykhoff, P., 1971. Automatica 7, pp. 123–
162.
Matlab R2009b, 2009. The Mathwork Inc. Company,
Massachusetts, U.S.A
TSI. TS EN 206/1, 2002. Concrete. Turkish Standards
Ankara. In Turkish.
PredictionoftheBehavioursbythePrismaticBeamswithPolypropyleneFibersunderHighTemperatureEffectsthrough
ArtificialNeuralNetworks
615
