
Computational Intelligence Applied to Monitor Bird Behaviour
D. F. Larios
1
, C. Rodríguez², J. Barbancho
1
, M. Baena
3
, F. Simón¹,
J. Marín
2
, C. León
1
and J. Bustamante
2
1
Department of Electronic Technology, University of Seville, Seville, Spain
2
Department of Wetland Ecology, Doñana Biological Station (EDB-CSIC), Seville, Spain
3
ICTS, Singular Scientific and Technological Infrastructure, Doñana Biological Station, Seville, Spain
Keywords: Neuronal Network, Computational Intelligence, Data Fusion, Environmental Monitoring, Sensor Networks.
Abstract: The best way to obtain relevant information about the behaviour of animals is direct observation (of
individuals). However, traditional close-up observations can interfere on the behaviour, and taking
biometric measurements requires the capture of individuals, which also causes stress. This paper describes
an automatic motoring system for birds breeding in nest boxes. The main goal is to significantly increase the
amount and quality of data acquired on bird behaviour without stressing the individuals or interfering. This
system is based in an interconnected embedded sensor network, which permits sharing this valuable
information with researchers all over the world through the internet. Each device of the network is a smart
nest-box that allows a cross-validation of sensor information and data quality. This system has been
evaluated for the specific case of a lesser kestrel breeding colony in Southern Spain. The lesser kestrel is an
insectivorous migratory falcon that readily accepts nest-boxes. The system has been named HORUS and the
results obtained from a year experiment demonstrate the efficiency of this approach.
1 INTRODUCTION
For zoologists, one of the most important periods for
a bird is the breeding period, being this period one of
the most frequently studied. Mate acquisition, nest
defence, mate feeding, incubation, and chick rearing
(including provisioning flights) are studied in the
surroundings of the nest. Many of these aspects help
us understand key topics in ecology, such as what
factors influencing lifetime reproductive success
(LRS: Newton, 1992), the parent-offspring conflict
(Trivers, 1974; Schlomer et al., 2010), or evolutive
stable strategies (ESS: Maynard-Smith and Price,
1973) regarding sex roles in reproduction (Kokko
and Wong, 2007).
Classic monitoring methods that require the
capturing of individuals or close-up observations
limit the amount and quality of data that can be
obtained. Therefore, in this paper a remote
monitoring system based on smart nest-boxes is
proposed. These smart nest-boxes allow acquiring
high amount of data without stressing the animals,
gathering long-term and highly reliable information
on the species.
The proposed system, called HORUS, permits
gathering basic information on the identity of
individuals, studying its behaviour and the temporal
changes in individual body mass. All this
information can be made accessible through the
internet to scientist all over the world.
Some of the information recorded by the system
can be used to study, without interference, the
behaviour of species during the breeding period.
One of the most important biometric parameters in
birds is body mass. It allows us to measure the
impact of parental care on breeding individuals.
Manually, it is impossible to develop a continuous
monitoring of this parameter. Capturing causes too
much stress on the individual in its most sensitive
period. Another important parameter is the
measurement of the amount of food brought to the
nest by individuals to feed their offspring.
The proposed system allows us to perform a
continuous monitoring of the reproduction without
stressing the individuals, e.g. obtaining reliable body
mass measurements every time a bird enters or
leaves the nest. The main problem obtaining the
measurements is the movement of the animal, which
produces unstable values. These values have been
calibrated using a neuronal network processing,
23
F. Larios D., Rodríguez C., Barbancho J., Baena M., Simón F., Marín J., León C. and Bustamante J..
Computational Intelligence Applied to Monitor Bird Behaviour.
DOI: 10.5220/0004068100230032
In Proceedings of the International Conference on Data Communication Networking, e-Business and Optical Communication Systems (DCNET-2012),
pages 23-32
ISBN: 978-989-8565-23-5
Copyright
c
2012 SCITEPRESS (Science and Technology Publications, Lda.)

Figure 1: Picture automatically taken by the outside
camera of the monitored colony with the HORUS external
sensors. From top to down it shows a pigeon, a lesser
kestrel male and a female.
obtaining high accurate measurements.
The rest of the paper is organized as follows:
Section 2 focuses on the lesser kestrel behaviour
study, especially comparing a traditional approach
versus automated data reading. Section 3 briefly
describes the HORUS system infrastructure. A
detailed description of the information treatment
developed in this project can be found in section 4.
The results obtained with our system are shown in
section 5. Finally, section 6 sum-up conclusions and
provides remarks.
2 LESSER KESTREL BREEDING
BEHAVIOR STUDY
The lesser kestrel (Falco naumanni, figure 1) is a
small (body mass around 150 grams) migratory
falcon inhabiting open landscapes (Cramp and
Simmons, 1980). It is a colonial species that breeds
in old buildings, such as churches or castles within
urban areas in Western Europe. The species
experienced a marked decline in its Western
Palearctic breeding range in the middle of the 20th
century (Cramp and Simmons, 1980; Biber, 1990).
Considered previously one of the most abundant
raptors in Europe (Bijleveld, 1974) the lesser kestrel
became extinct in several countries (e.g. Austria,
Hungary, Poland) and practically disappeared in
others (e.g. France, Portugal, Bulgaria).
Mediterranean Spain constitutes its stronghold in
the Western Palearctic (Biber, 1990). However, the
Spanish population also suffered a precipitous
decline, as it dropped from an estimated 20,000–
50,000 pairs in the 1970s (Garzón, 1977) to 4,000–
5,000 breeding pairs in 1988 (González and Merino,
1990). This decline has been attributed to the
reduction in both the extent and quality of foraging
habitats (Peet and Gallo-Orsi, 2000). The species is
also sensitive to climate warming (Rodriguez and
Bustamante, 2003). So it makes for a good model
species to study the impact of global change on an
endangered species.
2.1 Traditional Monitoring
The “Estación Biológica de Doñana” (EDB-CSIC)
has been monitoring lesser kestrel colonies since
1988. It has been recording colony occupancy and
breeding success in terms of number of fledglings
and proportion of successful nests. Regarding
individual monitoring, birds have been marked with
metal and PVC rings with a unique alphanumeric
code that allows identifying individuals by using
telescopes. Biometric measures were taken
sporadically for all marked individuals when
captured. Due to ethical reasons, however, the
number of captures in the nest is limited (the capture
alters breeding behaviour and may jeopardize the
survival of the offspring) and the majority of
resightings were made with telescopes. This causes
high differences in the frequency of recaptures
among individuals mainly due to differences in
detectability. In a classic data base monitoring,
2,135 birds figured as recaptured (including
resightings with telescope). On average they were
captured 3 times on the same breeding season
(range: 1-70). In approximately 45% of cases, body
mass was measured and maximum number of
measurements per bird and year was 4.
Because of that, the pattern of body mass
variation of breeding adults from arrival to the
colony in mid-February to the end of the nestling
period in mid-July is not well known. Accordingly,
we have no information on the pattern of intraday
variation in body mass.
The proposed remote monitoring system aims to
bridge the above detailed logistic and ethic gaps,
thus allowing us to get enough information to
document both patterns.
2.2 Automated Data Reading
Habitat monitoring has evolved greatly evolution
due to the boom of sensor networks technology.
Several consequences have been caused due to
the increase of sensors: Firstly the quality of
information grows in time and on the spatial
domain; secondly the possibility of transmitting the
measured data through the network increases the
need of having high bandwidth communications;
and thirdly, it to the reduction of the cost of the data
DCNET 2012 - International Conference on Data Communication Networking
24
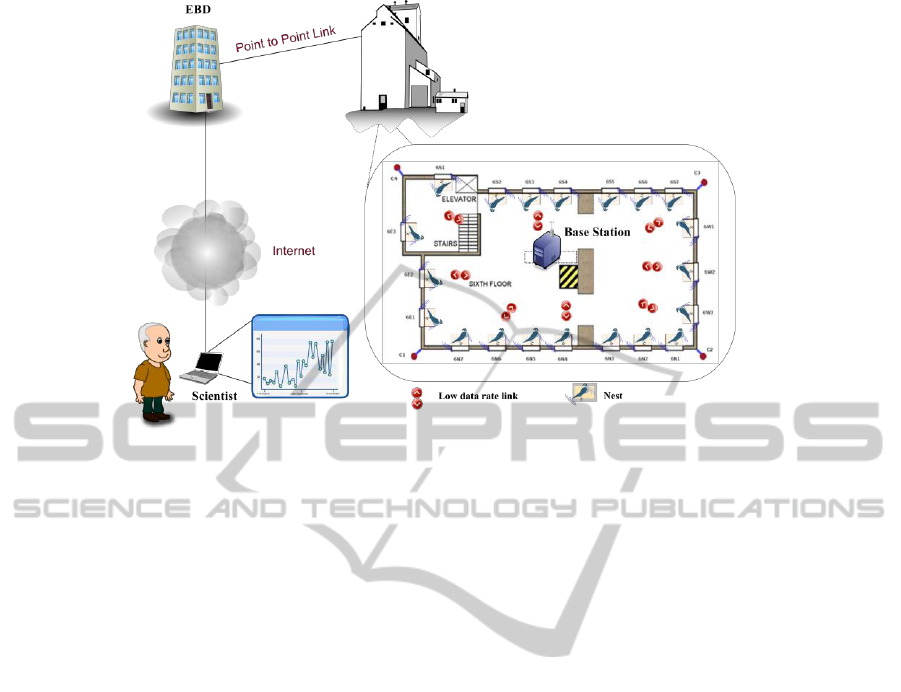
Figure 2: HORUS Network scheme.
storage makes possible to save huge amounts of
data.
All these consequences imply some negative
effects: an increase of data traffic and increase of
power consumption.
Some authors have taken these effects into
account (Cook, 2007; Sridhar, 2007) and have
expressed the need to employ processing techniques
in order to reduce these handicaps.
There are different approaches to habitat
monitoring. Some of them use wireless sensor
network technology in order to acquire and process
the physical information (García-Sánchez et al,
2010; Handcock et al, 2010; Valente et al, 2011;
Carullo et al, 2009). Others focus on the needed
middleware that allows access to the physical
information (Hwang et al., 2010; Farshchi et al.,
2007).
In our approach, both aspects are considered.
3 HORUS INFRAESTRUCTURE
The proposed infrastructure is a distributed system
as figure 2 depicts. This figure shows the most
important devices of the proposed architecture.
These devices will now bebriefly described.
3.1 Network Infrastructure
The HORUS infrastructure is made up of different
subsystems interconnected through a low data rate
communication network.
This network has been designed considering the
following restrictions:
The devices that provided information to the
network are deployed in a spread way without
any previous planning.
The data rate associated with the data sources is
low (< 250 kbps)
The system could be easily scalable.
The network used in HORUS can be accessible
through different physical media (wireless or wired
based).
Robustness of the network is very important, for
the proposed application: during the breeding period,
it is not possible to realize maintenance tasks,
because it can disturb and stress the colony. All
detected failures would be repaired in winter, after
the birds have left the colony.
3.2 Base Station
The process server is a system that offers the
following services:
Database server.
Monitoring and control system.
Remote control access.
The database stores all the historic sensors
information gathered from the system.
The monitoring control system is a program
responsible for adding additional valuable
information to the sensor measurements, such as
information about the nest sender, a time stamp
register or a control sequence, that permits
Computational Intelligence Applied to Monitor Bird Behaviour
25
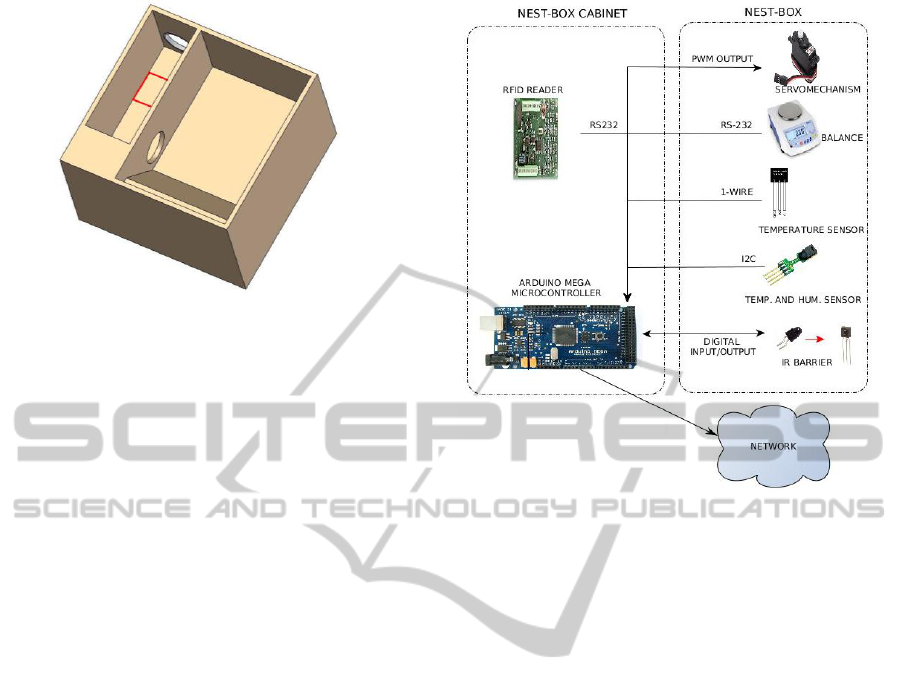
Figure 3: Nest cabinet.
determining the number of loss packets. This system
stores the information in the database.
Remote access control offers the cloud services
for remote users, such as biologists. These services
permit remote access to the sensors database.
3.3 Smart Nest-Boxes
The smart nest-boxes are the main components of
the monitoring systems. It consists of the next two
blocks:
The nest cabinet.
The electronic system
The nest cabinet (Figure 3) is divided into two
parts: a corridor and the incubation chamber. This
nest cabinet has a smart design to ensure that the
birds pass the corridor each time they enter or leave
the nest. The advantage of this is to allow the
distribution the sensors in a small area (the corridor)
where the animal is forced to pass and, therefore, it
ensures obtaining the sensor information.
The electronic system (Figure 4) of each smart
nest-box is accomplished with the next subsystems:
3.3.1 Microcontroller Board
This board is based on the ATmega2560, an
economic, low power and robust microcontroller. It
controls and processes the nest’s sensor information.
This board communicates with sensors and other
components, and processes the collected information
that is sent to the process server over the
communication interface.
The program implemented in the microcontroller
performs the following tasks:
Communicates with the process server over a
communication interface, and synchronize
clock time with this.
Figure 4: Architecture of the electronic system.
Checks infra-red barriers. Each nest-box has
two infra-red barriers at both extremes of the
corridor. The sequence in which they are
activated indicates whether birds enter or
leave the nest-box.
Checks if the RFID reader has read a code from
ringed kestrels.
Obtains the body mass measurement from a
digital balance.
Reads the temperature and humidity of the nest.
Controls the RFID reader to identify
individuals.
3.3.2 Sensors Board
A sensor board adapts the logic levels from the nest
sensors to the microcontroller board’s requirements.
All the nest’s sensors are spread onto the
corridor of the nest. Positions of sensors are
designed to ensure that every time the birds pass the
corridor the system registers at least one record per
sensor.
The deployed sensors are:
A digital balance. It allows a maximum weight
of 600 gr. and an accuracy of 0.01 gr, offering
16 measures per second. It permits getting an
estimate of the body mass of the individuals in
movement. Although the pan is round, it has
been modified to be rectangular in order to fit
the shape of the corridor.
DCNET 2012 - International Conference on Data Communication Networking
26
(a)
(b)
(c)
(d)
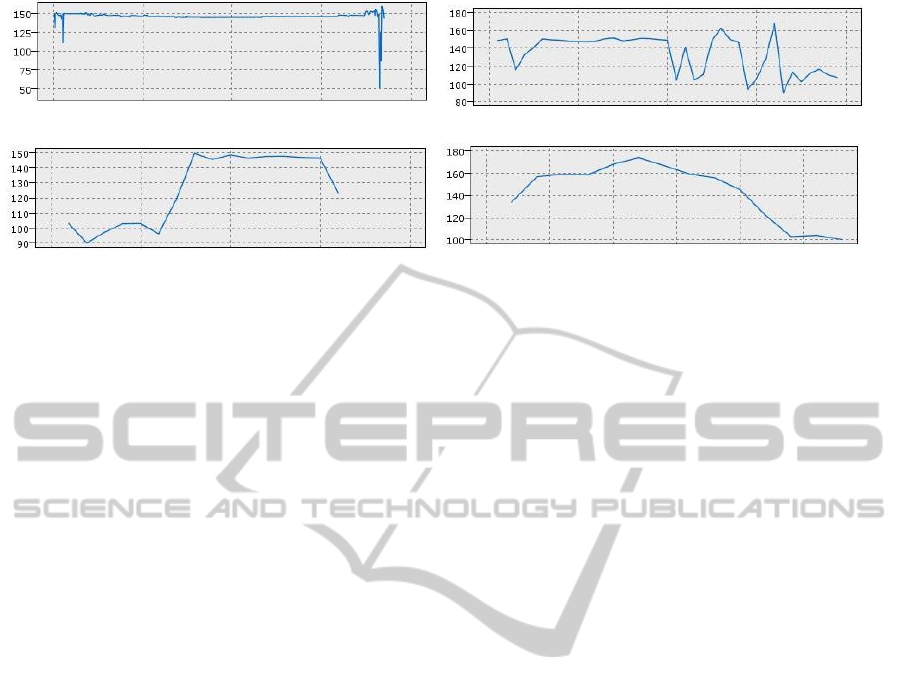
Figure 5: Different weight pattern Y-axis, weight in grams. X-axis, samples.
An integrated temperature sensor located in the
window. It is calibrated to operate in
environmental temperature range. It is used to
measure the nest temperature.
An integrated humidity sensor. It is used to
measure the nest humidity.
Two infra-red barriers, used to trace the
direction of birds’ movements.
A RFID reader. It communicates via RS-232C
and offers a reading on the unique ID of a
tagged bird, when it is passing through the nest
entrance. This system has mechanisms to avoid
collisions, permitting operation even when
there are several birds around the entrance.
A Servomechanism. It is used to remotely
capture birds when they enter in the nest-box.
4 TREATMENT OF THE
INFORMATION
As described before, every nest-box provides the
following information:
Measurements of body mass: The digital
balance used offers 16 measurements per
seconds without calibration and classifies
measurements as stable or unstable.
IR information: These sensors permit
determining if the birds go into or go out of the
nest.
RFID information: It permits attributing the
information of other sensors to an individual
bird.
All this information is obtained from the sensors
deployed in every nest-box. The sensors offer
relevant information on the individual breeding at
the colony to the biologists that study them. This
information, except the body mass, cannot be added,
as they inform about discrete events. Therefore, this
information is sent directly to the database without
any local processing or treatment.
On the other hand, the digital balance offers a
high amount of information. Its frequency of
measurement is much higher than the body mass
evolution of the animal. i.e., the animal body mass
evolution has more inertia than the weight provided
by the balance. Due to this, it is possible to perform
a data pre-processing about weight information,
reducing with that the amount of information send to
the central processing.
4.1 Weight Pre-processing
The algorithm described in this paper, is focused on
locally pre-processing the weight information, to
reduce the amount of unnecessary information and
increase its accuracy. It is designed to be executed in
each nest-box, in the microcontroller board. It has
been designed to fulfil the next goals:
To reduce the amount of useless information in
the database using local pre-processing.
To increase the accuracy of the measurements,
calibrating the results obtained.
To increase accuracy of the communication
network, reducing the amount of packet loss,
the delays and the collisions.
To increase the amount of useful information in
the database, estimating a body mass from
each pattern with non-stable measurements.
To permit its execution on devices with low
resources.
To increase the accuracy a tare calibration is
necessary. The balance used offers measurements
without a tare calibration. This calibration would be
obtained consulting the body mass measured by the
balance, when there is no animal on the pan i.e.,
when the measured weight is below a certain
Computational Intelligence Applied to Monitor Bird Behaviour
27

threshold. This threshold can be obtained as a
function of the body mass of the animals to monitor.
In our deployment for the Lesser Kestrel (with a
body mass range of 100-190 g) a threshold of 100
grams of has been used.
In the real deployment we have proven that the
tare does not change significantly during a year.
Therefore, measuring the tare only once per day
offers enough accuracy for the proposed system.
On the other hand, as described before, the
balance offers 16 weight measurements tagging
them every second by itself as stable (i.e.,
measurements that remain a same value during a
long period of time) or unstable. But birds usually
do not pass over the balance slow enough to obtain
stable measurements. This causes the database to
have a high amount of the information as unstable
measures. In the real prototype only about 15.25%
of the measured patterns had a stable measurement,
considering a pattern as the collection of
measurements obtained from the time the bird gets
on the balance (i.e., when the balance acquires a
weight over the threshold) until the animal gets out
of balance (i.e., when the balance acquires during 5
seconds weights below the threshold). Fig. 5 shows
different examples of weight patterns obtained in the
real deployment with these conditions.
This figure shows different real weight patterns
obtained from the same animal in different days.
Only pattern (a) has some stable measurement.
These stable measurements have been compared
with measurements of the animal done manually
capturing the bird. The stable tare measurements are
correct, but not frequent enough to obtain a long
term sequence of body mass temporal change of the
birds at the colony.
To solve this, a computational intelligence
algorithm to estimate the body mass of animals from
the patterns with non-stable weights has been
developed, increasing the amount of useful
information. This neuronal network algorithm is
described below.
Initially, the system has been designed to store,
in the central server, all weight measurements of the
pattern acquired by the balance, stable or unstable,
but it causes high bandwidth consumption in the
communications interface.
To reduce the amount of useless information, the
proposed algorithm only sends one estimated weight
to the database for each measured patterns. If the
pattern has some stable measurements, the estimated
weight sent to the central server will be the average
of the obtained stable measurements. If no
measurements of the pattern are stable, the weight is
estimated through a computational intelligence
algorithm. In both cases, only one selected weight
per pattern is sent to the database. These selected
weights are calibrated with the tare, before sending
them.
The proposed algorithm is summed-up in the
next pseudo-code:
while 1:
wait new(meas_weight);
if meas_weight>=threshold
weight[i]:=meas_weight–tare;
increase I;
if stable(meas_weight)==1
stable :=1;
end if
else
if i!=0
if stable==1
est_weight:=average(
stable_weight);
stable:=0;
else
est_weight:=model(weigth);
end if
send_server(est_weight);
i:=0;
else
new_tare:=meas_weight;
tare:=Iter_RMS(prev_tares,
new_tare);
end if
end if
end while
4.1.1 Applying Machine Learning for
Weight Recognition
For this application, an algorithm has been
evaluated. Initially, an algorithm without machine
learning based on the differences between
consecutives measurements has been considered.
This algorithm considers a weight stable if there are
more than a certain number of measurements of the
same weight. This is similar to the internal algorithm
of the balance for tagging measurements as stable or
unstable, but it is less restrictive: the balance
requires a high number of measurements with the
same value to consider a measurement stable. It
permits the retrieval of some weights from the
unstable patterns, but it fails with complex patterns.
Our proposal of using computational intelligence
(machine learning) increases the percentage of
success.
Machine learning is widely used in pattern
recognition, but its use in animal monitoring is less
widespread. Other supervised learning techniques
apart of the neuronal network have been considered.
DCNET 2012 - International Conference on Data Communication Networking
28

Non supervised techniques, such as Self-Organized
maps (SOM, Kohonen, 1990) or Support Vector
Machine (SVM, Cortes 1995) were discarded,
because we have some stable measurements that
permit performing training.
One example of the considered supervised
machine learning techniques is the use of Artificial
Neuro-Fuzzy Inference Systems (ANFIS; Jang,
1993). ANFIS has many applications in the
evaluation of complex systems, but it requires a
previous knowledge of the system to design the rules
and the initial system. This system was discarded;
due to the complex forms of the patterns that do not
easily permit acquire this initial system.
Expert systems or case based experts system
were not considered, due to the amount of previous
information gathered from the smart nest-box was
not sufficient for these kinds of systems.
For these reasons, a neuronal network model was
finally chosen. The variables used as inputs of the
model are as follows:
Max_1: The most repeated weight in a pattern
(the largest if multiple).
N_1: Number of repetitions of the previous
variable in a pattern.
Max_2: The second most repeated weight in a
pattern (the largest if multiple).
N_2: Number of repetitions, in a pattern, of the
previous variable.
Max_C1: The most consecutively repeated
weight in a pattern.
NC_1: Number of repetitions of the previous
variable in a pattern,
Max_C2: The second most repeated weight,
consecutively, in a pattern.
NC_2: Number of repetitions, in a pattern, of
the previous variable.
N_EL: Total number of weight measures in a
pattern.
In order to obtain these parameters, a pattern
with at least 5 weight measurements is needed. As
Table 1: Analysis of the database.
Caption
Value
Measurement weight
2583565
Number of pattern
51517
Patterns with stable weights
7856
Average pattern time
23,18 seconds
Days of test
399 days
an value output, the neuronal network model offers a
value, called “Output weight”. This output reflects
the estimated weight of the neuron model and it is
the information sent through the network to the
server database.
The steps execution of this neuronal network
model is summed-up in the next pseudo-code, where
the neuronal network is the execution of a three
layer network.
Neuronal network needs a set of parameters for
its training. These sets have been obtained for each
pattern with stable measures, by executing the
following steps:
Step 1: A variable name “Target weight” was
defined for every pattern. This variable stores the
average value of all stable weights. This is the target
result of the training of the neuronal network.
Step 2: For every pattern, a new pattern has been
created, eliminating all stable measurements.
Step 3: The inputs have been obtained from this
new pattern without stable values.
Step 4: The input values for each pattern were
stored, together with their respective Target weight
into a table, named “Training information”
With these tables two sets of information were
obtained, one for training and the other for
evaluating the accuracy of the system. In total, the
training information table has 1163 sets of values.
50% of these values (randomly selected) were used
for training, and the other 50 % were used for
validation.
5 SIMULATION, TESTS AND
RESULTS
The results obtained with this system can be
classified in two types: analysis of the network
performance and weight estimation accuracy
obtained with the real deployment.
This section summarizes these two types of
results.
5.1 Network Performance
During the first year of the deployment (2010), the
prototype was sending information from all sensors,
even the 16 records per second of the balance, to the
database of the central server. The main
characteristic of the gathered information in the
database is summarized in table 1.
After a year of deployment, the analysis of data
allowed us to detect some network conflicts. For
example, if different nest-boxes are acquiring
weights from individuals at the same time, they are
competing for control of the bus, causing data
collisions and delays in transmitting information.
Computational Intelligence Applied to Monitor Bird Behaviour
29
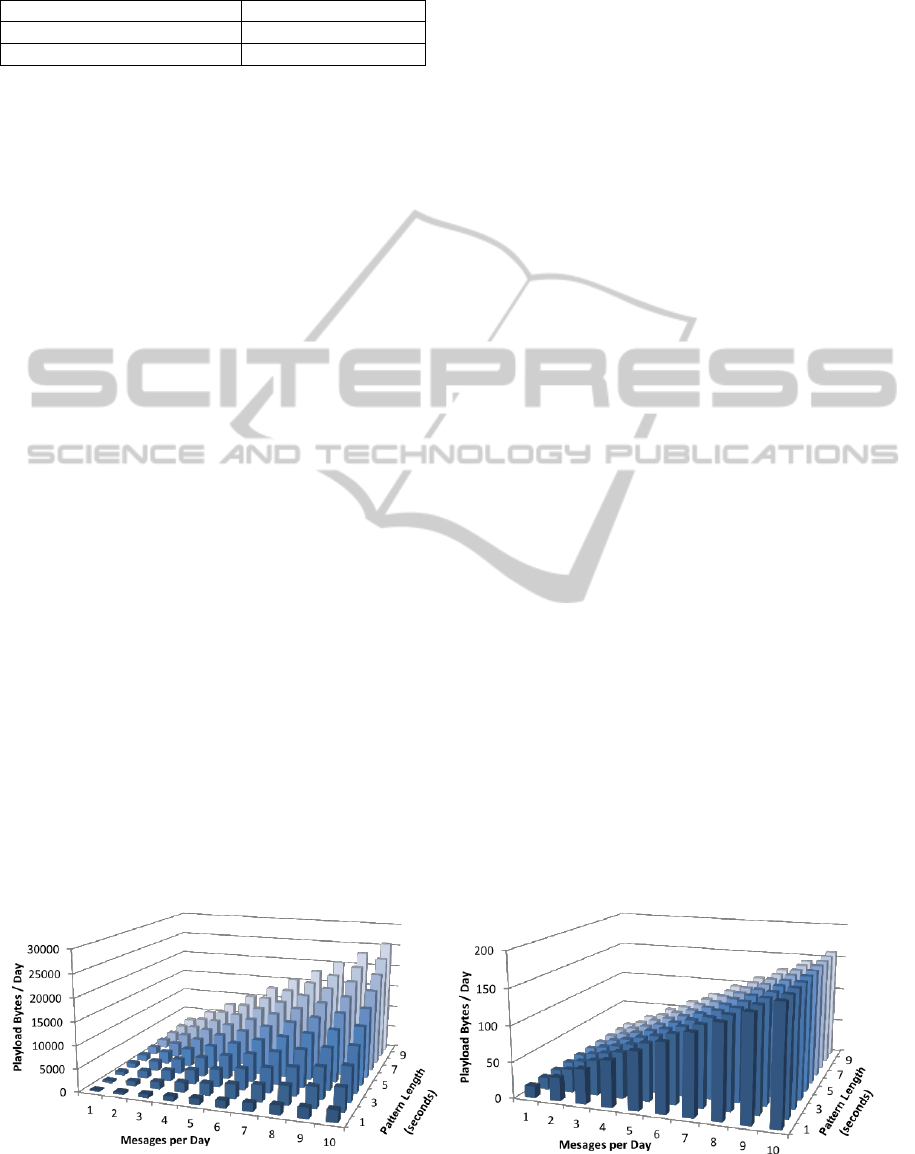
Table 2: Cost per message with CC2420 Radio
transceiver.
Caption
Energy (J)
Without data fusion
255.3
With data fusion
0.608
The proposed system allows avoiding these
conflicts, using the proposed data fusion.
In this section we are going to quantify the
advantage of data fusion against the classical
centralized systems. Due to that, in this kind of
applications it is important to reduce the use of
bandwidth as much as possible.
The analysis of database information has been
summed-up in the table 1. It shows that only a
15.25% of the acquired patterns have any stable
measurement.
Knowing that the balance offers 16 Samples Per
Second (SPS), the average payload of the
application layer per pattern of the system without
data fusion can be obtained with the equation 1.
,
16 · · ·
T raw SPS T Bytes msg
N P N N
(1)
Where
,T raw
N
is the number of bytes to send
per day at application layer;
T
P
is the length of the
pattern in seconds;
Bytes
N
is the number of bytes to
send. 16 bytes in this case and
msg
N
is the number
of messages per day.
On the other hand, with the proposed algorithm,
only one message per pattern is sent. In this case, the
payload per pattern can be obtained according to
equation 2.
,
·
T raw Bytes msg
N N N
(2)
This shows that the amount of information sent
to the database varies in function of the number of
patterns and the length (in time) of the pattern.
Figure 6 depicts these results.
Concluding, the local processing permits one to
drastically reduce the used throughput of the
network, especially in days with a high number of
patterns.
This data fusion and aggregation scheme is
especially important for its use in low bandwidth
systems, due to it permitting one to save energy.
With the proposed system, only one message per
pattern is sent, instead of 16 measurements per
second during the capture of the pattern. These
results are summed-up in table 2. They consider the
average pattern length of 23.18 seconds, i.e. the
average time while the bird is on the balance.
With these conditions and with the CC2420
radio transceiver, widely used in wireless sensor
network, permit saving 99.76 % of the energy used
in data transmissions, considering a power
consumption of 38mW in transmission mode
(Polastre et al, 2005.
Using all weight patterns obtained in the year
2010, the proposed body mass estimation algorithm
permits the retrieval of around 56.21% of the
patterns without stable measurements.
This is a good result that permits us to obtain an
average of 4 body mass estimations per day and
nest, which is 4 times higher than using only
patterns with stable measurements. It permits to
have a continuous tracing of body mass in
individuals.
As a conclusion, the local processing permits us
to drastically reduce the used throughput of the
network, especially in the days with a high number
of patterns.
5.2 Body Mass Estimation Accuracy
Based on the training and verification set described
in section 4.1.1, some analysis has been done to the
proposed algorithm for body mass estimation.
With the evaluation set, the system offers an
accuracy of 98.7%, i.e., an error in the order of 2
(a)
(b)
Figure 6: Bytes per day send, at application layer, to the central server. (a) Without data fusion. B) With data fusion.
DCNET 2012 - International Conference on Data Communication Networking
30
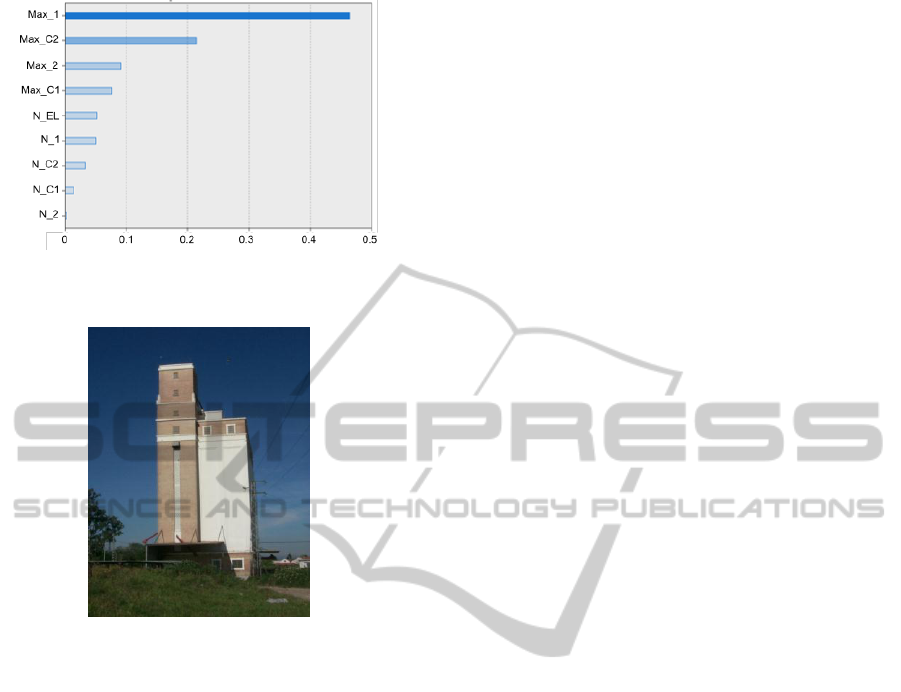
Figure 7: Neural network model: importance of the
variables in the calculation of the estimated weights.
Figure 8: Grain elevator used for the prototype
installation.
grams, which is quite small considering the typical
body mass of these animals (150 grams).
This accuracy permits analysis of a long series
for the evaluation of temporal changes in body mass,
and sometimes to determine the body mass of prey,
when birds bring medium-sized animals to the nest
to feed the nestlings.
From the training procedure, an analysis of the
importance of the input parameters in relationship
with the target body mass can be obtained. Figure 7
shows these results. This analysis concludes that the
selected parameters are valid to effectively estimate
the body mass of animals.
5.3 Real Deployment
A prototype, for a real validation of the proposed
system, has been deployed in the grain elevator of
“La Palma del Condado (Huelva Province, SW
Spain” (figure 8). At this site, researchers of the
Estación Biológica de Doñana have been studying
the lesser kestrel colony since 1994. At this colony,
kestrels nested on the windowsills of the grain
elevator that are sheltered and sufficiently enclosed
to make a suitable nesting site.
For the prototype installation we select the
windows on the 6th floor of the building where
smart nest-boxes were installed, and readily
accepted, by kestrels during preliminary checking (3
and 4 nest-boxes during 2008 and 2009,
respectively) and also when the definitive prototype
installation was made in 2010.
Nest-boxes are placed in all the windows along
the sixth floor. They are named “6XY”, where X
refers to the cardinal point and Y is an ordinal
number. Each box has two separate entrances and
two incubation chambers (I. left and D: right) in a
symmetrical distribution. Entrances are placed at the
extremes of the box to avoid potential aggressions
between neighbours, thus maximizing the number of
potential breeding pairs. Nonetheless, the right part
has not been opened yet.
The results provided by the system are still being
analysed by biologists. However, in its current state,
it is possible to obtain some conclusions:
18 of the 20 installed nests-boxes were used by
breeding kestrels. This leads to the conclusion
that the proposed system effectively allows one
to gather a high amount of information about
the behaviour of breeding individuals without
stressing them. If the nest and its sensors were
hostile, it would not have been chosen by lesser
kestrels breeding pairs.
A preliminary result of the continuous
weighting of individuals will allow the
researchers to estimate the cost of breeding in
terms of body mass. This cost is directly
associated with the foraging trips to feed the
nestlings.
The lesser kestrel mainly feeds on insects, but
sometimes can catch slightly bigger prey, such
as small rodents, birds or lizards (with around a
dozen of grams). The proposed system would
permit an analysis of the frequency of big prey
captures.
6 CONCLUSIONS
The main goal of the proposed system is to use
current technological advances in a real-world
application in the area of Biodiversity Conservation
to study how global climate change could affect a
colonial and endangered bird species.
The results obtained conclude that the proposed
system would permit its use in a system with low
resources and with a low bandwidth usage.
The prototype deployed in Spain for evaluation
Computational Intelligence Applied to Monitor Bird Behaviour
31

with the lesser Kestrel, has been demonstrated to be
a good method for studying these animals. The
proposed system permits us to do this evaluation
without stressing the animals and without the need
of a human observer. As a consequence, this
monitoring does not change the animal behaviour,
offering reliable information to researchers all over
the world that can access the information in real time
through the Internet.
The authors are currently working on several
improvements of the project: Increasing the number
of sensors, such as adding optical barriers over the
balance, with the goal of increasing robustness of the
body mass measurements; Studying the way to
increase the amount of pre-processing, using the rest
of the sensors, and looking for a simplification in the
use of the system information for the final user.
ACKNOWLEDGEMENTS
This work has been supported by the Consejería de
Innovación, Ciencia y Empresa, Junta de Andalucía,
Spain, through the excellence projects HORUS 2006
(reference number P06-RNM-01712), HORUS
2009 (reference number P06-RNM-04588) ARTICA
(reference number P07-TIC-02476), and eSAPIENS
(reference number TIC-5705). The authors would
like to thank the Cámara Agraria de La Palma del
Condado, Consejería de Agricultura y Pesca de la
Junta de Andalucía, Reserva Biológica de Doñana –
ICTS y Espacio Natural Doñana (Almonte, Huelva)
for their collaboration and support.
REFERENCES
Biber, J. P., 1990. Action plan for the conservation of
westernLlesser Kestrel Falco Naumanni Populations.
ICBP, Cambridge.
Bijleveld, M., 1974. Birds of prey in Europe. Macmillan
Press, London.
Carullo, A., Corbellini, S., Parvis, M., Vallan, A., 2009. A
Wireless Sensor Network for Cold-Chain Monitoring.
IEEE Trans. on Instrumentation and Measurement,
vol.58, no.5, pp.1405-1411, May 2009.
Cook, D. J., 2007. Making Sense of Sensor Data. IEEE
Pervasive Computing, pp. 105-108, April-June.
Cortes, C., Vapnik, V., 1995. Support-vector networks.
Machine Learning, Springer, vol. 20, pp. 273-297
Cramp, S. & Simmons, K. E. L. (1980) Handbook of the
Birds of Europe, the Middle East and North Africa.
Oxford University Press, Oxford
Farshchi, S., Pesterev, A., Nuyujukian, P. H., Mody, I.,
Judy, J. W., 2007. Bi-Fi: An Embedded
Sensor/System Architecture for Remote Biological
Monitoring. IEEE Transactions on Information Te-
chnology in Biomedicine, vol.11, no.6, pp.611-618,
Nov. 2007.
Garcia-Sanchez, A.-J., Garcia-Sanchez, F., Losilla, F.,
Kulakowski, P., Garcia-Haro, J., Rodríguez, A.,
López-Bao, J.-V., Palomares, F., 2010. Wireless
Sensor Network Deployment for Monitoring Wildlife
Passages. Sensors 2010, no. 10, pp. 7236-7262.
Garzón, J., 1977. Birds of prey in Spain. The present
situation. World Conference on Birds of Prey. Report
of Proceedings, International Council for Bird
Preservation, Cambridge, UK. pp. 159–170.
González, J. L. & Merino, M., 1990. El cernícalo primilla
(Falco naumanni) en la Península Ibérica. Situación,
Problemática Y Aspectos Biológicos. ICONA, Madrid.
Handcock, R. N., Swain, D. L., Bishop-Hurley, G. J.,
Patison, K. P., Wark, T., Valencia, P., Corke, P.,
O’Neill, C. J., 2009. Monitoring Animal Behaviour
and Environmental Interactions Using Wireless Sensor
Networks, GPS Collars and Satellite Remote Sensing.
Sensors no. 9, pp. 3586-3603.
Hwang, J., Shin, C., Yoe, H., 2010. Study on an
Agricultural Environment Monitoring Server System
using Wireless Sensor Networks. Sensors no. 10, pp.
11189-11211.
Jang, R. J-S., 1993. ANFIS: Adaptive-Network-Based
Fuzzy Inference System. IEEE Transactions on
Systems, Man, and Cybernetics, vol. 23, pp. 665-685.
Kohonen, T., 1990. The self-organizing map. Proceedings
of the IEEE, vol 78 (9), pp. 1464-1480.
Kokko, H., Wong, B. B. M., 2007. What determines sex
roles in mate searching? Evolution no. 61. pp. 1162-
1175.
Maynard Smith, J., Price, G. R., 1973. The logic of animal
conflict. Nature 246. pp.15–8
Newton, I., 1992. Lifetime reproduction in birds.
Academic Press, London.
Peet, N. B. and Gallo-Orsi, U., 2000. Action plan for the
Lesser Kestrel Falco naumanni. Council of Europe
and BirdLife International, Cambridge, U.K.
Polastre, J., Szewczyk, R. and Culler, D., 2005. Telos:
Enabling ultra-low power wireless research. 4th Int.
Symp. on Information Processing in Sensor Networks
(IPSN), Los Angeles, CA, April, pp. 364-369.
Rodríguez, C., and Bustamante, J., 2003. The effect of
weather on Lesser Kestrel breeding success: can
climate change explain historical population declines?
Journal of Animal Ecology no. 72. pp.793–810.
Schlomer, G. L., Ellis, B. J., Garber, J., 2010. Mother–
Child Conflict and Sibling Relatedness: A Test of
Hypotheses From Parent–Offspring Conflict Theory.
Journal of Research on Adolescence no. 20. pp. 287–
306.
Sridhar, P., 2007. Hierarchical aggregation and intelligent
monitoring and control in fault-tolerant wireless
sensor networks. University of New Mexico, 2007.
Trivers, R.L., 1974. Parent-offspring conflict. Am. Zool.
No. 14. pp 249–264.
Valente, J., Sanz, D., Barrientos, A., Cerro, J., Ribeiro, A.,
Rossi, C., 2011. An Air-Ground Wireless Sensor
Network for Crop Monitoring. Sensors no. 11, pp.
6088-6108.
DCNET 2012 - International Conference on Data Communication Networking
32
