
Automatic Design Optimisation of Pharmaceutical Tablets using
PDEs
Norhayati Ahmat
1,2
,
Gabriela González Castro
1
and
Hassan Ugail
1
1
Centre for Visual Computing, University of Bradford, BD7 1DP, U.K.
2
Faculty of Science and Mathematics, Universiti Pendidikan Sultan Idris, 35900 Tg. Malim, Perak, Malaysia
Keywords: PDE Method, Parametric Surfaces, Pharmaceutical Tablets, Automatic Optimisation.
Abstract: Pharmaceutical tablets and capsules are the dominant forms for drug delivery. Both types of dosage forms
need to be strong enough to handle different types of stress due to packaging and loading conditions before
use. Hence, it is important to produce these pharmaceutical forms with maximum mechanical strength while
conserving the properties of their active ingredients during the design process. The present work describes a
methodology for parametric design and optimisation of a solid cylindrical tablet and a soft spherical cap-
sule, which is based on the use of Partial Differential Equations (PDEs). The PDE-based formulation is ca-
pable of parameterising complex shapes using the information at some boundary curves that describe the
shape. It is shown that the optimal designs of both tablet and capsule can be obtained using an automatic de-
sign optimisation which is performed by combining the PDE method and a standard method for numerical
optimisation.
1 INTRODUCTION
In the past few decades, tablets and capsules have
become the important dosage form for drug delivery
in pharmaceutical industry. Tablets and capsules
have many advantages over other dosage forms.
They are convenient to use by patients and have long
storage stability. Additionally, they can hide the
unpleasant taste of their contents.
These types of dosage forms have been made in
many shapes, sizes and consistencies. This helps to
distinguish different medicines and is also useful for
product branding. The most common shapes for
tablets are round, oval and caplet whereas capsules
are divided into two types: hard-shelled capsules and
soft-shelled ones. The size of these dosage forms
varies from a few millimetres to about a centimetre.
The quality of both tablets and capsules are de-
scribed by several parameters such as hardness,
content uniformity, and accurate mass and height
(Elkhider et al., 2007).
Tablets are produced through three distinct stag-
es. These are die filling, compaction process and
ejection. It has been reported in Coube et al. (2005)
that the mechanical strength or disintegration of a
tablet depends on the behaviour of powder during all
stages of the tabletting process. The most important
stage of tablet production is the powder compaction
stage that involves compression and decompression
of the powder bed. During this stage, the compaction
properties (compressibility and compactibility) of
the pharmaceutical powder bed can be determined.
Compressibility, which is usually analysed using the
Heckel, Kawakita and Walker models (Ilić et al.,
2009), explains the mechanical properties of the bed
in terms of elasticity and plasticity (Ilić et al., 2009).
Meanwhile, compactibility refers to the ability of
powders as small particles to change into the coher-
ent solid dosage form (Sonnergaard, 2006). Com-
pactibility can be estimated by measuring the me-
chanical strength of the powder compact which is
generally characterised by the measurement of ten-
sile strength (Han et al., 2008).
The tensile strength of a solid dosage form
measures the ability of the object to resist forces
before it breaks. This can generally be determined
using the diametrical or axial compression tests (Han
et al., 2008). The measured force (F) obtained from
the test together with the diameter (D) and thickness
(h) of the dosage form are used to calculate the ten-
sile strength
=
2
ℎ
,
(1)
125
Ahmat N., González Castro G. and Ugail H..
Automatic Design Optimisation of Pharmaceutical Tablets using PDEs.
DOI: 10.5220/0004059601250130
In Proceedings of the 2nd International Conference on Simulation and Modeling Methodologies, Technologies and Applications (SIMULTECH-2012),
pages 125-130
ISBN: 978-989-8565-20-4
Copyright
c
2012 SCITEPRESS (Science and Technology Publications, Lda.)

and
=
4
,
(2)
where F
max
is the maximum crushing force and F
y
is
the force at the yield point. Equations (1) and (2)
represent the tensile strength of a dosage form ob-
tained from the diametrical and axial compression
test respectively. It has been reported in Elkhider et
al. (2007) that the properties of dosage forms such as
density and surface area can influence the tensile
strength of the form.
Given that the shape and size of dosage forms
play an important role in determining their mechani-
cal properties, this work proposes a method to model
solid shapes of cylindrical tablet and spherical cap-
sule interactively based on the use of parametric
surface representations. Additionally, a methodology
for automatic design optimisation within an interac-
tive environment for both dosage forms is also de-
scribed in this work. The objective is to obtain an
optimal shape for a tablet and also predicting the
optimal thickness of a spherical capsule’s shell.
Many authors have reported that the choice of the
design variables is important in shape optimisation.
Moreover, the number of design variables also needs
to be considered because too many variables may
increase the computational time (Ugail, 2003).
PDE method has been widely used as a surface-
modelling technique in many areas (González Castro
et al., 2010). This method can generate a smooth
surface of complex geometries from a few design
parameters. Furthermore, the PDE surface can be
manipulated intuitively by changing the boundary
curves or design parameters (Ugail, 2003). This
method also has been proven to be useful to address
optimisation problems including in biological (Ugail
and Wilson, 2003) and industrial applications
(Ugail, 2003). The PDE-based optimisation is per-
formed within a reasonable computational time by
combining engineering design criteria as constraints
into the geometric design of PDE surfaces (Ugail,
2003). Therefore, the PDE method is used in this
work to perform the automatic design optimisation
of pharmaceutical tablets and capsules.
2 THE PDE METHOD
The PDE method produces a parametric surface,
X
,
)
that is generated by solving the fourth order
elliptic PDE
+2
+
,
)
=0,
(3)
where u and v are the independent variables in do-
main [0, 1] and [0, 2π] respectively. Equation (3) is
known as the Biharmonic equation. The analytic
solution to Equation (3) is found using separation of
variables subject to four periodic boundary condi-
tions.
For the sake of brevity, the present work em-
ployed the approximated solution of Equation (3)
which has been truncated to N Fourier modes
,
)
=
+
)
cos
)
+
)
sin
)
+
,
)
,
(4)
where
=
+
+
+
,
(5
)
=
+
)
+
+
)
,
(6
)
=
+
)
+
+
)
,
(7
)
=
+
)
+
+
)
.
(8)
Given that
,
,⋯,
,
,⋯,
,⋯,
are
vector valued constants. Their value is determined
by the boundary conditions at u = 0 and u = 1. The
term
represents the spine of the patch which
brings out the symmetry of the patch while the re-
maining terms in Equation (4) define the position of
a point on the surface relative to the spine. The vec-
tor
is known as a remainder function which is
responsible for fully satisfying the original boundary
conditions. Thus, the vectors
,⋯,
and are
obtained from the difference between the original
boundary conditions and the one satisfied by the first
two terms in Equation (4).
As mentioned earlier in this section, four bound-
ary conditions are needed to solve the Biharmonic
PDE. Hence in this work, four periodic curves are
chosen as the boundary conditions to create a PDE
surface. These curves are shown in Figure 1(a)
where the positional boundary curves, P
1
and P
2
correspond to the boundary conditions on the edges
of the surface at u = 0 and u = 1 respectively while
d
1
and d
2
define the derivative boundary conditions.
Figure 1(b) illustrates the resulting shape of a fourth-
order PDE surface. Figure 1(d) shows the effect of
changing the derivatives boundary conditions (d
1
and d
2
) originally shown in Figure 1(a). These
boundary conditions have been resized and vertical-
ly translated from the corresponding positional
boundary curves. From this example, it is shown that
the shape of the surface can simply be controlled by
the shape of the boundary conditions.
SIMULTECH2012-2ndInternationalConferenceonSimulationandModelingMethodologies,Technologiesand
Applications
126

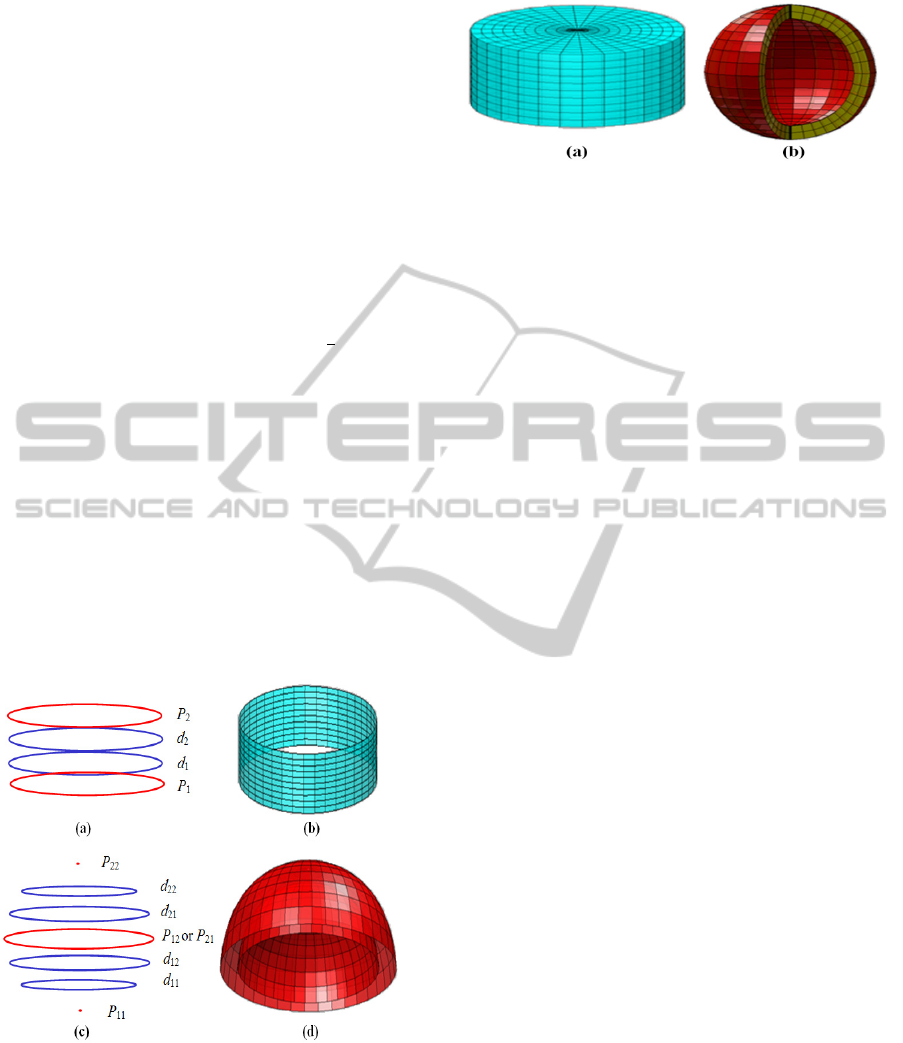
Figure 1: The boundary curves (a) and the corresponding
surface shape (b). The effect on the shape of the surface by
resizing and translating the derivative curves: the bounda-
ry curves (c) and the resulting manipulated surface shape
(d).
2.1 Geometry of Tablets and Capsules
This section discusses on how the geometry of a
cylindrical tablet and a spherical capsule can be
generated based on the analytic solution of the Ellip-
tic PDE. The geometric models representing both
objects have been obtained using a number of closed
curves. The number of boundary curves depends on
how many PDEs are required to produce the tablet
shape.
As a simple geometry, a flat-faced cylindrical
tablet is fully represented by the solution of one PDE
subject to four boundary curves. However, more
than one PDE is needed to generate the surface of
spherical capsule since the shape of this object is
considered as a complex geometry. The graphic
representation of such PDE is referred as patch and
therefore, complex geometries are represented by
several surface patches. Each of the patches is com-
posed of four boundary curves,
where c indicates
the type of curve, with the letter P denoting the posi-
tional curves and d denoting the derivative curves.
The index j (j = 1, ..., n) represents the patch; j = 1
for the first patch, j = 2 for the second patch and so
forth. The subscript k (k = 1, 2) corresponds to the
boundary edges of the surface.
Adjacent patches need to be blended together by
sharing one boundary curve with either one or two
different PDEs to guarantee the position continuity
along the generated surface. In this work, a spherical
capsule is generated from a surface composed of two
patches representing the outer surface of its hemi-
spheres (upper and lower). As it can be seen in Fig-
ure 2(d), the second positional boundary curve of the
lower hemisphere corresponds to u = 1 (marked as
P
12
) is used as the first positional curve of the upper
hemisphere (P
21
). Hence, only seven curves are
required to generate the outer surface of the capsule.
In order to create a hollow spherical capsule, another
two patches are needed to represent its inner surface.
Figure 2(a) shows the conditions in terms of the
curves to generate a flat-faced cylindrical tablet with
radius 4.91 mm and thickness 6 mm. In particular,
the four conditions are such that
0,
)
=
,
1
3
,=
,
2
3
,=
,
1,
)
=
.
It can be seen in Figure 2(b) that all curves lie on the
resulting surface. In case of generating the axisym-
metric spherical capsule, we only consider the upper
hemisphere since this object is symmetric. The size
(r
i
) and position in z-direction (z
i
)
for each boundary
curve representing the upper hemisphere are deter-
mined by
=cos
)
and
=sin
)
for=4,5,6,7
(9)
where i represents the number of curves, =0,
and R is the radius of the sphere (a and b denote the
outer and inner radius of the capsule respectively).
Generally, the coordinate of these boundary curves
can be written as
cos,
sin,
)
.
(10)
Therefore, the coordinate for all boundary curves
used to generate the outer surface of an upper hemi-
sphere with a centre (x
0
, y
0
, z
0
) and radius (a) 2.5
mm is such that
:
+2.5cos,
+2.5sin,
)
,
:
+2.17cos,
+2.17sin,
+1.25
)
,
:
+1.25cos,
+1.25sin,
+2.17
)
,
:
,
,
+2.5
)
.
(11)
The conditions in Equation (11) can be reflected to
obtain the conditions corresponding to the lower
hemisphere. The inner surface of the capsule with
radius (b) 2.0 mm is also created from boundary
curves generated using Equations (9) and (10).
Figure 2(d) illustrates the geometry of the upper
hemisphere of a spherical capsule generated using
the analytic solution of the Biharmonic PDE.
AutomaticDesignOptimisationofPharmaceuticalTabletsusingPDEs
127
Given that the analytic solution of the Elliptic
PDE only generates the surface of any given object,
a new parameter (w) has been introduced into Equa-
tion (4) in order to generate a solid representation of
the particular object
,,
)
=
+
,
)
+
)
cos
)
+
)
sin
)
(12)
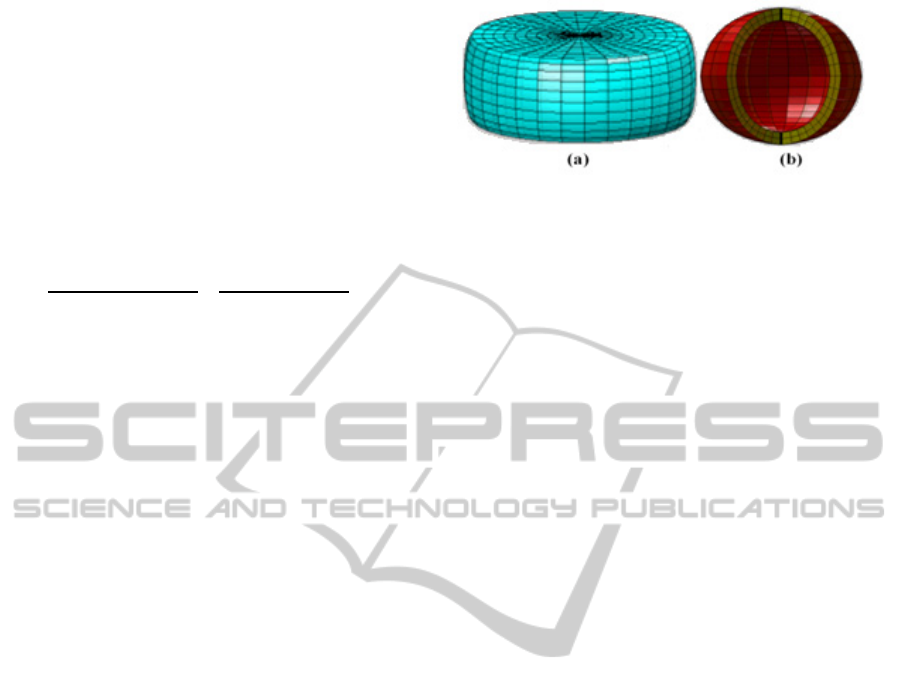
where 0≤≤1. This parameter describes the
volume inside the generated object. The solid cylin-
drical tablet and spherical capsule are shown in
Figures 3(a) and 3(b) respectively. The parametric
region of parameter v is set to be from
to 2 in
order to show the interior part of the PDE-based
representation of a spherical capsule.
3 DESIGN OPTIMISATION
This section shows how automatic design optimisa-
tion of a solid tablet and capsule can be carried out
using the parametric model discussed in Section 2. It
is assumed that both dosage forms are finite, homo-
geneous and isotropic. The design optimisation of
these objects is performed by solving a constrained
optimisation problem formulated based on the objec-
Figure 2: Generating curves in three-dimensional space for
tablet (a) and capsule (c). The resulting surface shape of
both objects in (b) and (d) respectively.
Figure 3: Solid PDE-based representation of cylindrical
tablet (a) and spherical capsule (b).
tive function together with the boundary conditions
(positional and derivatives curves) associated with
the geometry of the dosage form and the required
constraints.
The most important aspect of design optimisation
is the definition of a suitable objective function,
which has to be minimised or maximised. The gen-
eral mathematical formulation of an optimisation
problem to minimise a given objective function
under nonlinear equality and inequality constraints
can be written as
minimise
)
subject to
)
≤0,=1,…,
ℎ
)
=0,
=1,…,
≤≤
;∈
ℝ
(13)
where f(x) is the nonlinear objective function, is a
vector of n design variables with sets of lower (
)
and upper (
) bounds, while
)
and ℎ
)
repre-
sent inequality and equality constraints respectively.
There is a wide variety of methods for numerical
optimisation such as Interior-point and Active set
methods (Eitrich and Lang, 2006). It has been re-
ported in Leyffer (2005) that the Active set method
is more robust than the Interior-point method. The
Active set method solves constrained nonlinear
optimisation problems by minimising the objective
function in each iteration over the active set until the
optimal solution is obtained. In this method, the
optimisation problem is split into one active and one
inactive parts where the active part refers to a subset
of the constraints that are locally active (Eitrich and
Lang, 2006).
This work carries out the optimisation using the
Active set method, which is run in Matlab. A MEX
file has been created as an interface between Matlab
and Visual C++. A subroutine has been developed in
C++ to read the boundary curves that define the
shape of the tablet and produce the solution for each
set of curves. When the Matlab file is compiled, the
MEX file is dynamically loaded and allows calling
SIMULTECH2012-2ndInternationalConferenceonSimulationandModelingMethodologies,Technologiesand
Applications
128

the pertaining C++ subroutine within Matlab as if it
was a built-in function. Moreover, Matlab was used
to display the resulting shapes after the optimisation
process is finished.
3.1 Optimisation Process for
Cylindrical Tablet
The automatic optimisation of the cylindrical tablet
shown in Figure 3(a) is considered. The tablet dis-
cussed in this work is composed of 300 mg of α-
lactose monohydrate with the value of E = 2460
N/mm
2
, γ = 0.21 and true density (
) 1.3
mg/mm
3
. The initial diameter and thickness of this
tablet are 9.82 mm and 6 mm respectively. Assum-
ing that the tablet is located in the bottom of a bottle
filled with tablets, such the tablet experiences a
stress. This is due to the weight of the rest of the
tablets in the bottle and hence, this tablet becomes
either slightly deformed or damage. Therefore, the
required strength of the tablet needs to be measured
by calculating the maximum tensile strength within
the tablet. This is done by means of axisymmetric
boundary value analysis where the force is applied
on the top plane of the tablet caused by the weight of
the other tablets in the bottle. It is also assumed that
the bottom plane of the tablet is fixed at z = 0.
The objective here is to determine the optimal
shape of a cylindrical tablet with a maximum tensile
strength subject to a given volume. Therefore, Equa-
tion (2) is employed to measure the strength of the
cylindrical tablet occurring in the whole structure.
The yield force (F
y
) in Equation (2) is replaced by
the yield pressure (P
y
), which can be obtained from
the Heckel model
ln
1
1−
=+,
(14)
where
is a relative density, P is a pressure, and
K and A are constants. The constant K gives the
value of the plasticity of a compressed powder bed
while A is associated with the particle rearrangement
before deformation (Ilić et al., 2009). The yield
pressure is measured from the reciprocal of K (Ilić et
al., 2009) and hence, Equation (2) is transformed to
=
ln
ℎ
ℎ
−
−
,
(15)
where h, c and m represent the thickness, radius and
mass of the tablet respectively.
The design space is further restricted by choos-
ing a constraint to represent the volume of the tablet.
In this case, the volume is fixed to 235 mm
3
, which
can be calculated using the expression given by
1
3
∙
)
=235,
(16)
where n
i
and
are the unit vector normal and area
of the i
th
defining surface. Here, M represents the
number of rectangular surfaces since the PDE-based
representation of the tablet in question is generated
from cuboid mesh. It is worth mentioning that Equa-
tion (16) represents a means for the numerical com-
putation of the volume enclosed within a closed
surface. With the above formulation, the boundary
curves and their initial size and position for the op-
timisation process of this tablet are shown in Table
1. Emphasis is made on the fact that we only consid-
ered the translation in z direction and dilations in the
xy plane for all boundary curves within the defined
limits. The radius of each curve is set from 4.5 mm
to 5.15 mm while the position in the z-direction for
every curve is chosen between 0 to 3.5 mm.
The Active set method finds the design with the
lowest possible value of the chosen merit function
from the design space. The optimisation took less
than an hour to obtain the maximum strength after
four iterations starting from a randomly chosen solu-
tion point. The optimal shape which had a relative
reduction in height of 50 % is found with maximum
tensile strength as shown in Figure 4(a). The values
of the design curves obtained for the optimal design
are given in Table 1.
Table 1: Parameter values for the cylindrical tablet.
Boundary
curve
Initial Optimal
P
osition z Radius
(mm) (mm)
P
osition z Radius
(mm) (mm)
P
1
0.0 4.91 0.0 4.83
d
1
1.88 4.91 0.9 5.15
d
2
4.12 4.91 2.0 5.15
P
2
6.0 4.91 2.93 4.83
103.333 N/mm
2
3.2 Shape Optimisation of a Spherical
Capsule
The aim for this example is to identify the optimal
thickness of the capsule shell whilst possessing a
predefined level of strength. Again, the translation in
z direction and dilations in the xy plane of all bound-
ary curves are considered.
AutomaticDesignOptimisationofPharmaceuticalTabletsusingPDEs
129
Here, the elastic gelatin spherical capsule is sub-
jected to an external pressure (P
ext
) at its outer sur-
face r = a and an internal pressure (P
int
) at its inter-
nal surface r = b. Equation (1) is used in the optimi-
sation routine as the objective function. The thick-
ness of the capsule shell is measured by considering
the radial displacement of the pressurised sphere.
The displacement is determined by making use of
the Love’s stress function subjected to particular
boundary conditions (González and Fitt, 2002)
=−
−
)
3+2
)
−
)
−
−
)
4
−
)
,
(17)
where λ and µ are the Lame modulus and shear
modulus respectively.
A pressure of 153 µN/mm
2
is applied on the out-
er surface of the capsule while the pressure on its
inner surface is 39 µN/mm
2
. As far as the material
properties are concerned, the Young modulus and
Poisson’s ratio of the gelatin are 0.11 N/mm
2
and 0.4
respectively (Markidou et al., 2005). For this partic-
ular example, the volume of the spherical capsule is
fixed to 14.14 mm
3
.
With the above formulation, the automatic opti-
misation was performed about 72 minutes on a
Matlab R2008a with 2.20 GHz Intel Core 2 Duo
T7500 processor. The resulting optimal thickness of
capsule’s shell is shown in Figure 4(b). This shape
has a relative reduction in thickness and size of 46 %
and 40 % respectively. The maximum tensile
strength for the capsule was found to be 10.89
N/mm
2
.
4 CONCLUSIONS
This work outlines a methodology for shape optimi-
sation of pharmaceutical dosage forms based on the
PDE method enabling efficient shape definition and
parameterisation of complex geometries. The shape
of a tablet and capsule is generated from a small set
of design parameters and can be controlled by the
chosen boundary curves. Thus, the optimised shape
is obtained after carrying out an optimisation analy-
sis and relating the pertaining results to the solution
of the corresponding PDE as given in Equation (4).
It is worth mentioning that the concise parameterisa-
tion characteristics of the PDE method can be used
to carry out automatic design optimisation in a prac-
tical setting where the time taken for tablet testing
can be significantly reduced and encourages future
development of pharmaceutical technologies.
Figure 4: Optimal shape of a tablet (a) and optimal
thickness of capsule shell with maximum tensile strength
(b).
REFERENCES
Coube, O., Cocks, A. C. F., Wu, C. Y., 2005. Experi-
mental and numerical study of die filling, powder
transfer and die compaction. Powder Metallurgy 48,
68-76.
Eitrich, T., Lang, B., 2006. Efficient optimization of sup-
port vector machine learning parameters for unbal-
anced datasets. Journal of Computational and Applied
Mathematics 196, 425-436.
Elkhider, N., Chan, K. L. A., Kazarian, S. G., 2007. Effect
of moisture and pressure on tablet compaction studied
with FTIR spectroscopic imaging. Journal of
Pharmaceutical Sciences, 96, 351-360.
González Castro, G., Athanasopoulos, M., Ugail, H.,
2010. Cyclic animation using partial differential equa-
tions. The Visual Computer 26, 325-338.
González Castro, G., Fitt, A. D., 2002. A mathematical
model for tonometry. Springer-Verlag.
Han, L. H., Elliot, J. A., Bentham, A. C., Mills, A., Ami-
don, G. E., Hancock, B. C., 2008. A modified Drucker-
Prager Cap model for die compaction simulation of
pharmaceutical powders. International Journal of Sol-
ids and Structures 45, 3088-3106.
Ilić, I., Kása, P., Dreu, R., Pintye-Hódi, K., Srčič, S., 2009.
The compressibility and compactibility of different
types of lactose. Drug Development and Industrial
Pharmacy 35, 1271-1280.
Leyffer, S., 2005. The return of the active set method.
Oberwolfach Reports 2(1), 107-109.
Markidou, A., Shih, W. Y., Shih, W.-H., 2005. Soft-
materials elastic and shear moduli measurement using
piezoelectric cantilevers. Review of Scientific Instru-
ments 76.
Sonnergaard, J. M., 2006. Quantification of the compacti-
bility of pharmaceutical powders. European Journal of
Pharmaceutics and Biopharmaceutics 63, 270-277.
Ugail, H., 2003. Parametric Design and Optimisation of
Thin-Walled Structures for Food Packaging. Optimi-
zation and Engineering 4, 291-307.
Ugail, H., Wilson, M. J., 2003. Efficient shape parametri-
sation for automatic design optimisation using a par-
tial differential equation formulation. Computers &
Structures 81, 2601-2609.
SIMULTECH2012-2ndInternationalConferenceonSimulationandModelingMethodologies,Technologiesand
Applications
130
