
A Framework to Provide Real Time Useful Knowledge
in E-Learning Environments
Àngela Nebot
1
, Francisco Mugica
1
and Félix Castro
2
1
Soft Computing Group, Technical University of Catalonia, Jordi Girona Salgado 1-3, Barcelona, Spain
2
Centro de Investigación en Tecnologías de Información y Sistemas (CITIS),
Universidad Autónoma del Estado de Hidalgo, Hidalgo, Mexico
Keywords: Data Mining, E-Learning, Fuzzy Inductive Reasoning (FIR), Fuzzy Logic.
Abstract: This research presents a framework that provides valuable knowledge to teachers and students, mainly
based on fuzzy logic methodologies. The framework offers the following knowledge: 1) gives a sets of rules
describing the students’ learning behaviour; 2) provides a relative assessment of the features involved in the
students’ evaluation performance, i.e. detects and assess the most important topics involved in the course
evaluation process; 3) groups the learning behaviour of the students involved in online courses, in an
incremental and dynamical way, with the ultimate goal to timely detect failing students, and properly
provide them with a suitable and actionable feedback. In this paper the proposed framework is applied to the
Didactic Planning course of Centre of Studies in Communication and Educational Technologies virtual
campus. The application shows it usefulness, improving the course understanding and providing valuable
knowledge to teachers about the course performance.
1 INTRODUCTION
E-learning has been presented as the best solution to
cover the needs and requirements of remote
students, but also as a helping tool in the teaching-
learning process, reinforcing or replacing face-to-
face education. However, the undisguised truth is
that many real projects have failed, or at least they
have performed below expectations, due to the fact
that a huge amount of time is required just in the
process of providing feedback to the virtual learners,
resulting in an increasing demand of teachers and,
therefore, of the educational costs. One of the most
difficult and time consuming activities for teachers
in distance education courses is the evaluation
process, due to the fact that the reviewing process is
better accomplished through collaborative resources
such as e-mail, discussion forums, chats, etc. As a
result, this evaluation usually has to be done
according to a large number of factors, whose
influence in the final mark is not always well
defined and/or understood. Therefore, it would be
helpful to reduce the intrinsic system evaluation
dimensionality by identifying factors that are highly
relevant for the students’ evaluation. Any e-learning
system is, by its own nature, likely to generate large
amounts of information describing the continuum of
the teaching-learning interactions. All this
information, obtained from diverse and usually
heterogeneous sources, may be of no help by itself
to any of the e-learning actors in its raw form. The
use of data mining methods to extract knowledge
from the e-learning system available information can
be an adequate approach to follow.
With the above problems in mind, we developed
a framework to provide real time helpful knowledge,
with data mining techniques at its core, which
enables the improvement of the e-learning systems
through the analysis of data gathered from the
virtual campus students’ activities. All the
functionalities of this tool ultimately aim to
contribute in alleviating the teachers’ workload.
Interesting surveys of data mining techniques for
dealing with e-learning environments are (Castro et
al., 2007) and (Van Rosmalen et al., 2005), where an
extensive and deep analysis on different learning
platforms is performed, including LON-CAPA
(Minaei-Bidgoli et al., 2004), AHA! (Romero et al.,
2003), ALFANET (Van der Klink et al., 2002), etc.
Commonly, the existing platforms perform students’
classification (using supervised neural networks,
decision trees, fuzzy methods, association rules,
103
Nebot À., Mugica F. and Castro F..
A Framework to Provide Real Time Useful Knowledge in E-Learning Environments.
DOI: 10.5220/0004055401030108
In Proceedings of the 2nd International Conference on Simulation and Modeling Methodologies, Technologies and Applications (SIMULTECH-2012),
pages 103-108
ISBN: 978-989-8565-20-4
Copyright
c
2012 SCITEPRESS (Science and Technology Publications, Lda.)

etc.), and/or students’ clustering (using Kohonen’s
self-organizing maps, EM, etc.), however a study of
students’ performance has not been undertaken
taking into account final mark prediction.
In this paper we apply the proposed framework
to the Didactic Planning course of the CECTE
(Centre of Studies in Communication and
Educational Technologies, Spanish acronym). This
is the first time that this framework is applied to a
fairly large real data set.
The remaining of the paper is organized as
follows: section 2 presents the proposed framework.
A description of the data used in this research and
the results of the experiments are presented and
discussed in section 3. Section 4 wraps up the paper
with some conclusions. It is not possible, due to
space limitations, to include in this paper the
description of the fuzzy logic methodologies that are
the core of the framework. The reader can refer to
(Klir and Elias, 2002; Nebot et al., 2009; Castro et
al., 2009), to learn about the fuzzy inductive
reasoning methodology (FIR) and its extensions, the
logical rules extraction algorithm (LR-FIR) and the
causal relevance approach (CR-FIR).
2 THE FRAMEWORK
The main goal of the framework is to alleviate the
virtual tutors’ workload and to provide an effective
and valuable feedback to learners. To deal with these
objectives the framework offers tools to discover
relevant learning behaviour patterns from students’
interaction with the educational materials. The
knowledge obtained can be used by teachers to
design courses more effectively and detect students
with learning difficulties. The knowledge extracted
can also be helpful for the students to know their
own learning performance and therefore use more
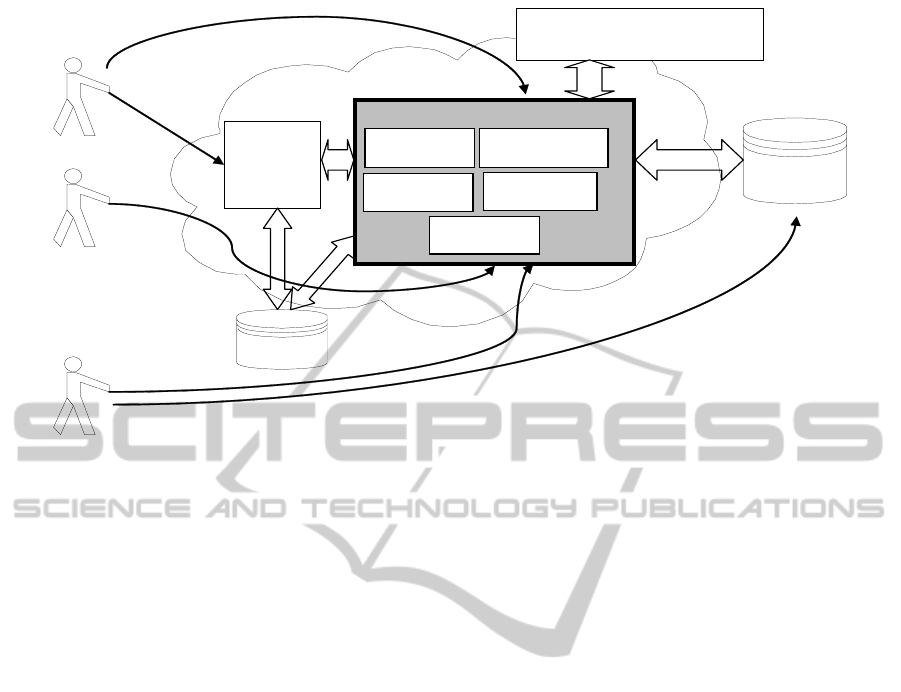
efficiently the educational resources. Fig. 1
summarizes the interaction between the actors and
the virtual campus proposed as well as the
functionalities offered by the framework. Let us
explain them by going through each actor.
The modeller is the responsible to identify the
models from a specific course dataset by using the
data mining algorithms included in the framework.
Therefore, it should be a person that has a previous
knowledge about the methodologies involved, i.e.
FIR, LR-FIR and CR-FIR.
Teachers have available several options:
Understanding students’ learning behaviour,
Analysis of the course evaluation process,
Assessment of students’ learning performance, and
Grouping of students learning behaviour.
The understanding students’ learning behaviour
action provides an easy interpretable and
comprehensible way to describe students’ learning
behaviour, by means of logical rules. The rules are
automatically mined from the data registered from
the course. This allows knowing the course
performance patterns and, therefore, using this
knowledge in future courses design or decision
support. An example of rules is presented in the top
of Table 2. The analysis of the course evaluation
process option improves the knowledge associated
to the educative process by identifying the most
relevant features involved in the evaluation process.
This knowledge allows teachers to confer the
appropriate grading effort to each item. The results
of the feature relevance determination can help
course advisors to define a more accurate final mark
equation. The assessment of students’ learning
behaviour option provides a continuous evaluation
of the learning behaviour of the students during
course development. That means that the students’
performance can be obtained and analyzed at any
time through the course and after the end of it,
giving teachers’ the possibility to offer efficient and
on time feedback to the student. The framework
offers the teacher the possibility to send
automatically feedback to sets of students that have
similar behaviour, reducing his/her workload. The
grouping of students learning behaviour option
provides, in a dynamic and incremental way, the
clustering of students’ learning behaviour, based on
the course information available at the moment that
this option is selected. The main goal of identifying
incremental dynamic models is to find important
didactic and educational checkpoints that allow the
early detection of students with learning difficulties.
The students can obtain knowledge related to
their performance during the course by consulting
the Self-assessment option that allow them to know
at any time their learning performance by getting the
prediction of their final mark. Additionally, the
student can analyze the e-learning framework
usability and the learning patterns of successful
students that have already passed the same course. It
is foreseen to include, in the near future, the option
of providing a course adaptation based on the
student profile and necessities. The learning material
would then be provided to the student in a
customized way, based on his level of knowledge
and learning behaviour.
All the framework functionalities, which are
summarized in Fig. 1, are implemented as a Matlab
toolkit, and are exploited by forefront, efficient and
SIMULTECH 2012 - 2nd International Conference on Simulation and Modeling Methodologies, Technologies and
Applications
104
Self-Assessment
Course Feedback
Obtain underlying
behaviour of the course
Identify the
best model for
a course
Interact with e-
learning
environment
Course knowledge
extraction
Course feedback
LMS
Virtual Campus
Course
Information and
students’ profile
Student
Data extraction,
integration and
processing
Decision Support Toolbox
Students learning
performance
Students learning
behaviour
patterns
Students with similar
learning behaviour
Course model
identification
Analysis of the
evaluation process
Navigational
Data
Teacher
Data Mining Techniques:
FIR, LR-FIR, CR-FIR, Clustering
Modeller
Figure 1: The proposed framework functioning.
standard technologies, i.e. Java applet, JavaScript,
Java Servlets, Java Server Pages, Apache Web
Server, and Dynamic HMTL.
3 DIDACTIC PLANNING
COURSE
For the experiments in this study, a set of 672
students, enrolled in the Didactic Planning graduate
course, was selected. The course is addressed to
second term high school teachers. The students are
meant to perform a set of activities throughout the
course with the main purpose of learning new
methods and strategies for planning the classes that
they teach. This is the reason why these activities are
centred on the so-called “class plan”. A class plan is
a document where a set of strategies is suggested in
order to develop a teaching-learning session, taking
into account different factors such as students’
characteristics, teaching style, teachers’ experience,
etc. The data features available for this study are
shown in Table 1. In this course two novel
evaluation topics were incorporated: co-evaluation
and experience report. In co-evaluation, the advisor
grades how well the student evaluates the class plans
of his/her course mates. The experience report is a
student description of his/her perception of the
course. It can be viewed as a self-evaluation of the
student’s own learning process.
The aim of this set of experiments is threefold.
First, we aim to identify models that are capable of
predicting student’s performance. Second, we are
interested in determining which features have the
highest relevance from the student’s performance
point of view. The ultimate goal is to discover
students’ learning behaviour patterns from the
models identified. All experiments have been
performed in a dynamic and incremental way, based
on the educational scheduling of the course and
using only the information available at each time.
The experiments have been performed using a test
set composed of 132 samples and a training set that
contains 540 samples. In this course three models
are identified. Due to space limitations, the complete
results are shown only for model 2.
The Model at Time 1, i.e. the first model, is
identified using the variables: AGE, EXP, G, STD,
POS and IC. The model obtained in this case founds
relevant only the AGE and the IC input variables for
predicting students’ final MARK. Although the
mean square error of the prediction obtained with
model 1 is not low, it is quite a good result taking
into account the reduced amount of data available.
The results obtained when selecting the Assessment
and Grouping of Students’ Learning Performance
options, show that this model already predicts
correctly two of the students that fail the course and
fifty-two out of seventy-three students that obtain an
excellent in their final grade. It is important to notice
that at this point, i.e. after the first homework, a set
of failing students are already identified, what
allows teachers to give specific attention to them.
The Analysis of the Course Evaluation Process
A Framework to Provide Real Time Useful Knowledge in E-Learning Environments
105

Table 1: Data features collected for the Didactic Planning course.
Feature
Description
AGE
Age of the student.
EXP
Area of expertise of the student (mathematics, chemistry, Mexican history, etc.).
G
Student’s gender.
STD
Level of studies (graduate, master, Ph.D., etc.).
POS
Position of the student as a teacher in his/her school.
ACT
Percentage of the activities performed by the student with respect to the total activities of the course.
ASS
Percentage of student’s session assistance with respect to the total number of sessions of the course.
MAIL
Average mark obtained by the student in the activities sent by e-mail.
COEV
Mark of the co-evaluation performed by the student of the class plan of other students.
F
Mark of the student’s forum participation (referring to topics related to the course).
FCP
Mark of the forum class plan (referring only to topics related to the class plan exclusively).
FC
Mark obtained by the student in his/her final class plan.
IC
Boolean indicating if the student has delivered or not the initial class plan.
ER
Mark of the experience report. In this report the student evaluates his/her learning process.
BR
Average mark of the work (activities) performed in the branch.
MARK
Final mark obtained by the student in the course.
concludes, as expected, that the relevance of the IC
variable is higher than the AGE variable in the final
MARK prediction, i.e. AGE has a relative relevance
of 0.34 whereas the IC has a value of 0.66 (up to 1).
This is reasonable due to the fact that IC is directly
related to the course evaluation process. The
Understanding Students’ Learning Behaviour option
presents a set of logical rules that have acceptable
results for the standard sensitivity, specificity and
accuracy metrics which range from 0 to 1, i.e. Spec.:
0.58; Sens.: 0.64; Acc.: 0.74.
The Model at Time 2, i.e. the second model,
considers eight variables as inputs to predict the
students’ final mark: AGE, EXP, G, STD, POS, IC,
COEV and FC. As expected, as much information is
available the richness of FIR models increase and
the quality of all the evaluation metrics, associated
to each functionality, increases as well. The results
of the different framework functionalities are
compacted in Table 2. The top of Table 2 presents
the set of rules obtained when the Understanding
Students’ Learning Behaviour is chosen. The rules
are accompanied with the standard evaluation
metrics. The right hand side of the table presents the
final MARK prediction results obtained with model
2. This knowledge is given when the Assessment and
Grouping of Students’ Learning Performance are
selected. It is also used to satisfy the Self-Assessment
student functionality. The left hand side of Table 2
presents the relative relevance of the variables
involved in the model. This knowledge is important
in order that teachers knows which variables are
more relevant for predicting the final mark and can
use it to redefine the evaluation process if needed.
This data is shown when the Analysis of the Course
Evaluation Process option is selected.
The model encountered by FIR selects only the
variables COEV, FC and IC as the most useful ones
to predict the final MARK. In this case the
prediction error obtained is quite good, and much
lower than the error of model 1. Let us analyse the
prediction results presented in the right hand side of
Table 2. The numbers represent the students’ id. The
Real row lists the set of students that Fail, Pass and
have an Excellent grade at the end of the course. The
Prediction row shows the prediction of each student
performed by model 2. The shadow numbers are
students well classified by the model, i.e. students
that at the end of the course will have the grade that
has been already predicted now. As it can be seen,
12 out of 20 students that will fail the course have
been already predicted correctly. This a very
interesting result, because this model is obtained
between the 3
rd
and 4
th
month before the course
finishes, therefore, the teachers can still provide
valuable feedback and guidance to students in order
to improve their learning performance and
accomplish the course requirements. Moreover, the
knowledge derived from the predictions can be used
for teachers to automatically e-mail feedback to all
students with predicted bad grades and propose
additional work that will help them to enhance the
final grade. If we take a look to the results of the
Analysis of the Course Evaluation Process, in the
left hand side of Table 2, it can be seen that all the
important variables that are used in the FIR model,
i.e. COEV, FC and IC, have almost the same relative
relevance. This means that the three have the same
level of influence in the model predictability.
The learning behaviour rules extracted by means
of the Understanding Students’ Learning Behaviour
option are presented in top of Table 2. The rules
obtained have significant and reasonable meaning,
from both, an educational context and the teacher
SIMULTECH 2012 - 2nd International Conference on Simulation and Modeling Methodologies, Technologies and
Applications
106
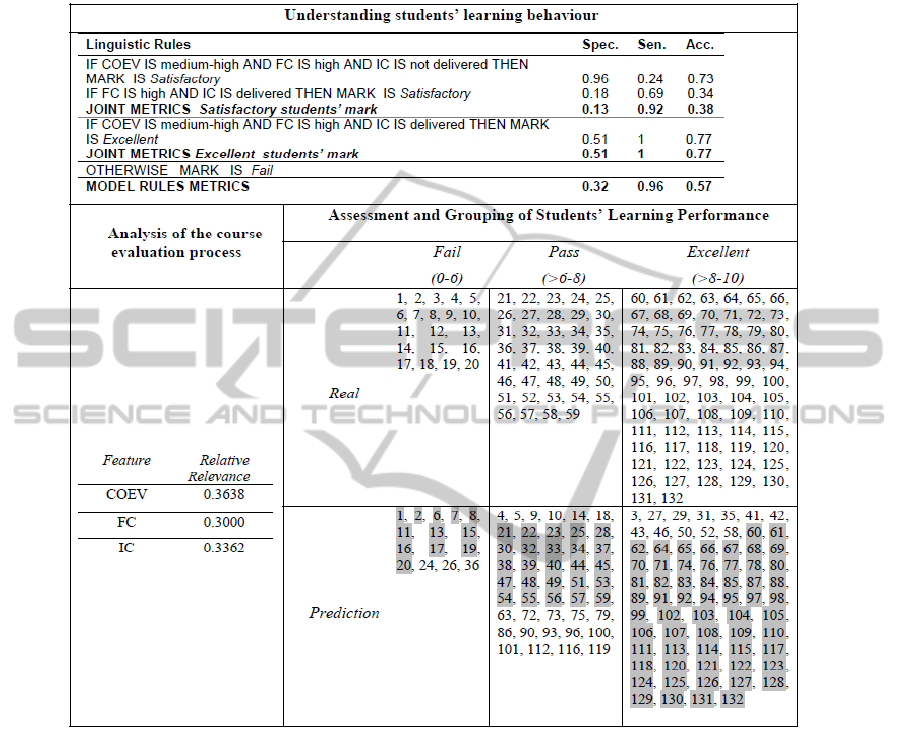
Table 2: Results for the Model 2 of the Didactic Planning Course. for the Understanding Students’ Learning Behaviour
Option the MARK Variable Was Discretized into 3 Classes: Fail (from 0–7); Satisfactory (from 7–9); Excellent (from 9–
10). IC into 2 Classes: Delivered and Not Delivered. FC and COEV into 3 Classes: Low (from 0-5); Medium (from 5-8) and
High (from 8-10).
point of view. As a result, a high sensitivity metric is
obtained, with a value of 0.96 (up to 1). However,
the specificity and accuracy metrics are not as high
as desired.
Although the previous results of model 2 are
reasonably good and of usefulness for teachers and
students during the course, we are interested in
performing an experiment using all the information
available at the end of the course. Therefore, in the
Model at Time 3, i.e. the third model, we used all the
information described in Table 1. The model
encountered by FIR in this case selects COEV, IC
and ER as the more relevant input variables to
characterize the final MARK. The prediction error
obtained when using this model has been reduced
significantly. 15 out of 20 students that fail the
course, 28 out of 39 students that pass and 67 out of
73 that have an excellent in the mark, are predicted
correctly by model 3. The 5 students that fail the
course but are not predicted as fail by the model are
predicted as pass, so there is no student that has
failed and the model predicts an excellent mark.
Furthermore, there are no students that have a pass
or an excellent mark in the course that the model
predicts as fail students. Therefore, the results can be
considered rather reliable and consistent.
As happens in model 2, the three input variables
involved in the FIR model have equivalent relative
relevances. In both models, 2 and 3, the COEV and
the IC features are chosen as important input
variables to predict the final mark. However, in
model 3 the ER feature supersedes the FC feature
chosen by model 2. ER corresponds to the mark
obtained by the student in the experience report (see
A Framework to Provide Real Time Useful Knowledge in E-Learning Environments
107

Table 1). Obviously, model 2 could not select the
ER variable because was not a possible input
variable at that time. Therefore, with all the features
available the FIR methodology decides that the three
features with the higher prediction power are COEV,
IC and ER. It is important to mention that these three
variables represent the 50% of the final mark
evaluation (the weighted formula used to compute
the final mark of the didactic planning course is:
MARK = 0.05*MAIL + 0.20*COEV + 0.05*F +
0.05*FCP + 0.20*FC + 0.10*IC + 0.20*ER +
0.15*BR). Notice that there are some variables such
as FC and BR that, by themselves, constitute the
35% of the final mark, but are not included in the
FIR model. This is an important and interesting
result, as it suggests that the information included in
these variables already exists in the selected ones
(COEV, IC and ER). Therefore, these variables are
redundant from the final mark prediction point of
view. The logical rules obtained are comprehensive,
readable and provide useful explanations (not only
assumptions) about the learning behaviour followed
by the students. They have high values in the
standard metrics, i.e. Spec.: 0.78; Sens.: 0.87; Acc.:
0.87. These rules were validated by the course
coordinator, the teachers and the educative experts
of the CECTE, concluding that the obtained results
were consistent with their own perception of the
didactic planning course students’ learning
behaviour.
4 CONCLUSIONS
In this work a framework that provides useful
knowledge in e-learning environments is presented
and used in a real course, i.e. the didactic planning
course. The main objective of the framework is to
alleviate the virtual tutors’ workload and to provide
an effective and valuable feedback to learners. The
fuzzy logic algorithms (FIR, LR-FIR and CR-FIR)
that are the data mining core of the framework are
able to offer valuable knowledge to both, teachers
and students that can be used to enhance course
performance and that opens new possibilities for the
pedagogical and instructional designers, who create
and organize the learning contents
.
The framework is presented in this paper by
means of the didactic planning course. Three
models are inferred during the course. The first one
is obtained at the beginning, when only the personal
information of the student and the first homework is
available. Although the prediction power of this
first model is very limited it offers a first grouping
of the students into potential failing, pass and
excellent students, useful for teachers to give them
feedback. Obviously, the models derived will have
more predictive power as they have access to more
information. Therefore, the knowledge derived from
the subsequent models is more relevant and reliable
in time. This incremental model strategy allows to
provide to the teacher and the student knowledge
about the learning process in real time.
REFERENCES
Castro, F., Vellido, A., Nebot, A. & Mugica, F. (2007).
Applying Data Mining Techniques to e-Learning
Problems. In L. C. Jain, R. A. Tedman & D. K.
Tedman, Evolution of Teaching and Learning
Paradigms in Intelligent Environment. Studies in
Computational Intelligence, 62 (pp. 183-221). Ger.:
Springer-Verlag.
Castro, F., Nebot, A., Múgica, F. (2009). On the extraction
of decision support rules from fuzzy predictive
models. In Revision at Applied Soft Computing (2009).
Klir, G. and Elias, D. (2002). Architecture of Systems
Problem Solving (2nd ed.). NY: Plenum Press.
Minaei-Bidgoli, B., Tan, P. N., Punch, W. F. (2004).
Mining Interesting Contrast Rules for a Web-based
Educational System. In Proceedings of The 2004
International Conference on Machine Learning and
Applications, ICMLA’04. Louisville, KY.
Nebot, A., Mugica, F. and Castro, F. (2009). Causal
Relevance to Improve the Prediction Accuracy of
Dynamical Systems using Inductive Reasoning. Inter.
Journal of General Systems, 331-358, 38 (2).
Romero, C., Ventura, S., De Bra, P., De Castro, C.(2003).
Discovering Prediction Rules in AHA! Courses. In
Proceedings of the User Modelling Conference.
Johnstown, Pennsylvania (pp. 35-44).
Van der Klink, M., Boon, J., Rusman, E., Rodrigo, M.,
Fuentes, C., Arana, C., Barrera, C., Hoke, I., Franco,
M. (2002). Initial Market Study, ALFanet/IST-2001-
33288 Deliverable D72. Open Universiteit Nederland.
URL: http://learningnetworks.org/downloads/alfanet-
d72-initialmarket -studies.pdf.
Van Rosmalen, P., Brouns, F., Tattersall, C., Vogten, H.,
van Bruggen, J., Sloep, P., Koper, R. (2005). Towards
an Open Framework for Adaptive Agent-Supported e-
Learning. Inter. Journal Continuing Engineering
Education and Lifelong Learning 15(3–6) 261-275.
SIMULTECH 2012 - 2nd International Conference on Simulation and Modeling Methodologies, Technologies and
Applications
108
