
Analysing E-Business Applications with Business Provenance
Sergio Manuel Serra da Cruz
1
, Laci Mary Manhães
2
, Raimundo Costa
2
and Jorge Zavaleta
2
1
Departamento de Matemática, Universidade Federal Rural do Rio de Janeiro, Seropédica, Brazil
2
Universidade Federal Rio de Janeiro, Ilha do Fundão, Brazil
Keywords: Business Provenance, Web Services, SOA, E-Business.
Abstract: Business Provenance provides important documentation that is an essential to increase the trustworthiness
and traceability of end-to-end business operations. This paper presents two data marts that allows
multidimensional analysis of business provenance metadata collected from a real e-business scenario.
Provenance was collected with the aid of an architecture named BizProv. We conclude the paper with the
identification of the challenges that will drive future research of BizProv.
1 INTRODUCTION
Provenance is a broad topic that has many meanings
in different contexts. Business provenance is essential
to determine whether information is trusted, to
integrate varied information sources and to give credit
to originators when reusing information. Curbera et
al. (2008), Roznyai et al. (2011) and Cruz et al.
(2012) are investigating how business provenance
increases the trustworthiness and traceability of end-
to-end business operations in a dynamic, flexible and
cost effective way. Business provenance is a form of
metadata artifacts used to increase the effectiveness of
the business operations, to manage risks and to
provide a deeper visibility into business processes. It
is achieved by capturing and registering history and
context related to specific business and operational
goals (Fox, Huang, 2008).
Business provenance provide information about
processes, resources, data and users’ operations,
supporting analyses concerning business processing
as well as QoS (Quality of Services). Business
provenance has a pragmatic and interesting
advantage, as it can be used for QoS (historic of
errors, failure rates or average response times),
compliance, trust and auditing purposes it may also be
important for monitoring the application when in
production. In short, business provenance may be
molded in a consistent and trustworthy way with other
sources of information to accelerate a broad range of
business objectives.
To provide an improved understanding of the need
for business provenance and its importance on
business processes based on SOA applications we
have presented BizProv in a previous work (Cruz et
al., 2012). It was designed as a loosely-coupled
architecture used to collect the retrospective business
provenance generated by business processes
implemented as Web services. In this paper we show
how to model and query multidimensional
provenance data cubes with the provenance metadata
previously gathered with aid of BizProv. The
analytical provenance queries can be used to monitor
the QoS of business operations.
The rest of this paper is as follows. In section 2
presents a short background on business provenance.
In section 3 discusses two business provenance star
schemas. Finally, in the section 4, we conclude our
paper and provide an outlook for future work.
2 BACKGROUND
Provenance-related technologies help to understand
what actually happened during the lifecycle of a
business process by examining how data was
produced, what resources were involved and which
tasks were invoked (Curbera et al., 2009). There are
two forms of provenance: prospective and
retrospective (Freire et al., 2008). Prospective
provenance captures the specification of processes; it
corresponds to the steps that need to be followed to
generate a data product. Retrospective provenance
captures the steps that were executed as well as
information used to derive a specific data product. As
far as we are concerned, business provenance is a
297
Manuel Serra da Cruz S., Mary Manhães L., Costa R. and Zavaleta J..
Analysing E-Business Applications with Business Provenance.
DOI: 10.5220/0003967902970300
In Proceedings of the International Conference on Data Communication Networking, e-Business and Optical Communication Systems (ICE-B-2012),
pages 297-300
ISBN: 978-989-8565-23-5
Copyright
c
2012 SCITEPRESS (Science and Technology Publications, Lda.)

kind of retrospective provenance.
BizProv is a loosely-coupled architecture designed
to collect the retrospective business provenance
generated by distributed business processes. It allows
business analysts to incorporate other sources of data,
such as Web logs and clickstream to get deeper
visibility about business processes. BizProv was
conceived as a two layered architecture. The first
layer consists of a composite Web services provider,
basic Web services provider, E-Probe Module, two
active intermediaries, a provenance repository which
was conceived take into account the latest
recommendation of Open Provenance Model (Moreau
et al., 2011). The second layer is composed by a web
server log parser, an ETL tool and the OLAP
provenance data cubes. More details about BizProv
architecture and its provenance schema can be found
at Cruz et al. (2012).
3 OLAP PROVENANCE CUBES
Business provenance is inherently multidimensional;
it can be analyzed from multiple perspectives. The
BizProv´s OLAP Provenance Cubes are structures to
support analytical provenance queries in high-
dimensional space. The design of Provenance Cubes
requires addressing a variety of issues including a
novel set of OLAP dimensions, measures and also
defining the semantics of OLAP operations over
provenance cube. Last but not least, OLAP is a
technology widely used by enterprises and can be
distributed to business analysts using a variety of
platforms. For such reasons, despite of the existence
of other initiatives to query provenance metadata,
such as (Curbera et al., 2009, Lakshmanan et al., 2011
and Cruz et al., 2009). Our approach uses the
analytical processing to query business provenance
metadata.
This section shows how business analysts can gain
insight into business provenance metadata through
fast, consistent, interactive access to a wide variety of
possible views of information. One of the uses of
Web services´ provenance is to track QoS aspects of
Web services utilization. Such tracking provides
important feedback to service management.
3.1 A Business Use Case
From business provenance repositories generated by
BizProv and other sources of data (such as
clickstream and Web server logs) an ETL tool may
process and populate a database specially designed for
analytical purposes. Provenance metadata used in this
section was gathered from some Web services of a
virtual books retailer operating on the Web
Such database is usually structured according to a
star schema (it is a logical arrangement of tables such
as the entity relationship diagram without
normalization of tables (Kimball et al., 2004)), where
data are described in terms of facts, (measures of
interest to be analyzed) and dimensions (perspectives
under which the facts are analyzed). Thus, a
provenance OLAP cube is a set of metadata, with
distinct granularity, that is organized and structured in
a hierarchical and multidimensional arrangement to
allow analysts to perform ad hoc queries over
provenance repositories. The next sub-sections
provide two general star schemas based of the
provenance collected by BizProv architecture. The
first schema (Figure 1, at the end of the paper) may be
extended according to other needs, including
additional information such as service reputation
(used to obtain basic insights about the user
experience dealing with the Web services). The
second schema (Figure 2, at the end of the paper)
aims at capturing users’ interactions to support and to
complement business processes analyses.
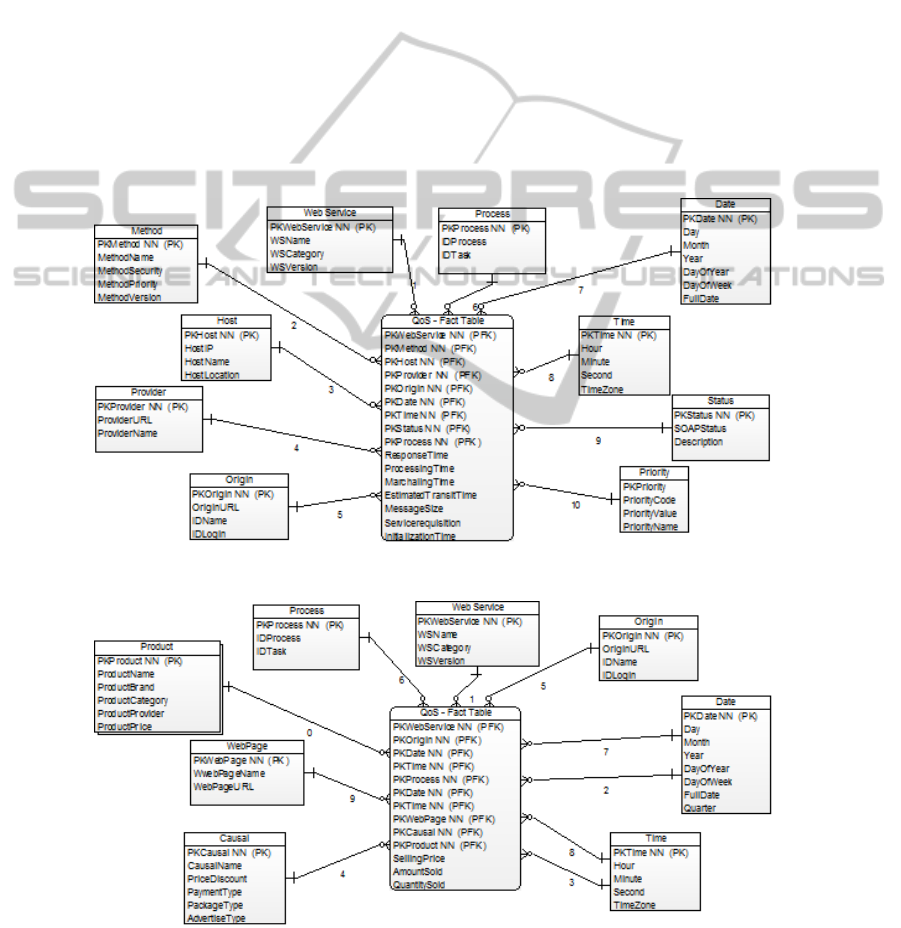
3.2 Monitoring Web Services QoS
The schema, depicted in Figure 1, can be used to
investigate several QoS issues about the business
processes, such as ResponseTime, MessageSize and
InitializationTime. In order to investigate QoS,
different dimensions may be used to provide
consolidated queries upon these variables. For
instance, the Status dimension supports queries
concerning reliability and availability. For example,
selecting the total amount of services requisitions in
Dec 2011, by Web service method which ended with
a Status different from “OK”, divided by the total
amount of services requisitions (by Web service
method) in Dec 2011, gives us a Web service method
reliability indicator. This information may be used as
a basis for Web services code maintenance. Note that
we have included a service requisition attribute in the
fact table, just for convenience, for the sake of queries
readability, as suggested by Kimball et al. (2000,
2004). Its value is always 1.
The Origin dimension supports queries
concerning service misuse. For example, if the total
amount of a Web service requisition from a given
origin in an hour is much larger than the others, it
may be someone, by mistake or not, repeatedly
calling the service in a loop. This information may be
used for user suspension or warning. The Date and
Time dimensions are role playing dimensions
ICE-B 2012 - International Conference on e-Business
298

(Kimball et al., 2004) and should be used in
conjunction with others, to limit the scope of analysis
in time.
The Web service dimension is a key dimension
and supports the other dimensions involved in the
analyses. It is useful for providing comparative
performance information when used with the Host
and Process dimensions. We can have, for example,
the average response time by a business processes
implemented as a Web services as a hint for possible
poor Web services performance. If one Web services
average response time is far above the others and all
the Web services from the same host have
approximately the same average response time,
perhaps we should blame the Web services host and
warn the Web services provider. This might be
especially useful if we were collecting provenance of
Web services calls at the basic Web services provider.
The Method dimension defines the grain of the
QoS analysis and it should be used in conjunction
with the other dimensions. The MethodVersion
attribute controls the versions of the Web service
Method and Web services dimensions we modeled as
slowly changing dimensions (Kimball et al.., 2004),
since we might be interested in monitoring eventual
performance deterioration or improvement due to new
service’s versions.
The Priority dimension may be used in
conjunction with Date and Time dimensions to
analyze if a Web services method was called with
priority and has improved its execution time when
compared with the same services method non-priority
calls. It is important to observe that priority calls
usually have higher prices.
3.3 Monitoring Sales
The Sales fact table considers two key variables:
SellingPrice and ProductSales, as illustrated in Figure
2. These variables may vary according to the domain
being analyzed. The Origin dimension may provide
answers concerning customer´s profile. For example,
which customers spent more money over a given
period of time?. This information may be used for
customer’s special treatment as, for instance, Web
service’s method call with priority when a profitable
customer is involved.
The Web service dimension is useful for providing
comparative selling information when used with the
Product dimension. One can have, for example, what
Web service of a given category is linked to low
selling rates. Tabulating such information with other
data provided by the QoS features, like the service
provider, may indicate a reason to change the Web
service by another, perhaps from other basic Web
services provider. Note that we have included the
ProductSales attribute, whose value is also always
equal to 1, as we did on the QoS fact table.
The Causal dimension may provide hints to
indicate the occasion which lead the customer to buy
a product. Causal dimensions were first proposed by
Kimball (2000, 2004). Although we cannot assure
which was the real cause, we can at least estimate. For
example, if a product has a price discount in June, this
may be a good reason to justify its good selling
performance in that month. Also, if a product may be
purchased in ten installments with no interest taxes in
May, as its payment type indicates, this may lead to
product selling increase. Besides, if the product has
been advertised in the Web page or on the
newspapers, and the product selling increases, this
may indicate that the advertisement succeeded.
Another selling’s increase may come from
PackageType, i.e., when two products are sold
together. For the sake of simplicity we don’t track
here which products are combined in the sale.
The Product dimension actually defines the grain
of the sales fact table, and is the basis of detailed
analyses that most of the times involve other
dimensions. The Web Page dimension provides
information about the product’s context of
acquisition. We assume that products may be acquired
in more than one page. This dimension may help
answer the question: “In which page of the Web site a
product has better sales?”.
4 CONCLUSIONS
Organizations that know where they are in terms of
analytics adoption are better prepared to turn
challenges into opportunities. Thus, analyzing
business provenance may represent a key competitive
advantage. The work presented in this paper is part of
a larger, long-term research effort aiming at
developing a native provenance-based service-
oriented BPM platform.
Future research efforts may focus on other fields
such the Agriculture (the investigation of online
payments for agricultural products and subsidies may
help governments better predict food production
trends and incentives). This knowledge can be used to
ensure the availability of proper crop storage, reduce
waste and spoilage, providing better information
about what types of financial services are needed by
farmers.
Analysing E-Business Applications with Business Provenance
299
REFERENCES
Cruz, S. M. S, et al., 2012. “Business Provenance: A
Novel Approach to Monitor Business Operations”. in
Proc. of the 2012 WWW, 1
st
Workshop of Data Usage
Management on the Web. 6pp.
Cruz, S. M. S, et al., 2009. “Towards a Taxonomy of
Provenance. In Scientific Workflow Management
Systems”, in Proc. of the 2009 Congress on Services -
I, p. 259-266.
Curbera, F. et al., 2008. Business Provenance - A
Technology to Increase Traceability of End-to-End
Operations. In Proc of the OTM 2008 Confederated
International Conferences, CoopIS, DOA, GADA, IS,
and ODBASE 2008, p. 100-119.
Fox, M. and Huang, J. 2004.Knowledge Provenance, in
Advances in Artificial Intelligence, vol. 3060, A.
Tawfik e S. Goodwin, Orgs. Springer
Berlin/Heidelberg, p. 517-523.
Freire, J. et al., 2008. Provenance for Computational
Tasks: A Survey, Computing in Science and
Engineering, vol. 10, p. 11-21.
Kimball R. and Caserta, J. 2004. The Data Warehouse
ETL Toolkit: Practical Techniques for Extracting,
Cleaning, Conforming and Delivering Data, 1st ed.
USA: Wiley.
Kimball R. and Merz, R. 2000. The Data Webhouse
Toolkit: Building the Web-Enabled Data Warehouse,
1st ed. USA: John Wiley & Sons.
Lakshmanan, G. T., Curbera, F., Freire, J. and Sheth, A.
2011. Guest Editors’ Introduction: Provenance in Web
Applications, IEEE Internet Computing, vol. 15, p. 17-
21.
Moreau, L. et al., 2011. The Open Provenance Model core
specification (v1.1), Future Gener. Comput. Syst., vol.
27, n. 6, p. 743-756.
Rozsnyai, S. et al., 2011. “Large-Scale Distributed Storage
System for Business Provenance”, Cloud Computing,
IEEE Int. Conf. on, vol. 0, p. 516-524.
Figure 1: OLAP Provenance QoS Cube.
Figure 2: OLAP Provenance Sales Cube.
ICE-B 2012 - International Conference on e-Business
300
