SELECTION MECHANISM OF ENERGY-EFFICIENT DATA
AGGREGATION NODE IN WIRELESS SENSOR NETWORKS
Yongbin Yim, Euisin Lee, Seungmin Oh and Sang-Ha Kim
The Department of Computer Engineering, Chungnam National University, 220 Gung-dong, Yuseong-gu, Daejeon,
Republic of Korea
Keywords:
Aggregation, Data Aggregation Node, Energy Consumption, Redundant Sensed Data, Wireless Sensor
Networks.
Abstract:
In-network data aggregation is one of the most important issues for achieving energy-efficiency in wireless
sensor networks since sensor nodes in the surrounding region of an event may generate redundant sensed
data. The redundant sensed data should be aggregated before being delivered to the sink to reduce energy
consumption. Which node should be selected as a Data Aggregation Node (DAN) for achieving the best
energy efficiency is a difficult issue. To address this issue, this letter proposes a scheme to select a DAN
for achieving energy-efficiency in an event region. The proposed scheme uses an analytical model to select
the sensor node that has the lowest total energy consumption for gathering data from sensor nodes and for
forwarding aggregated data to a sink, as a DAN. Analysis and simulation results show that the proposed
scheme is superior to other schemes.
1 INTRODUCTION
Wireless sensor networks consist of a great number
of sensor nodes which are deployed in an interest re-
gion for event monitoring (Akyildiz et al., 2002). The
sensor nodes are normally powered by batteries with
limited energy resource (Akyildiz et al., 2002)(Luo
and Liu, 2007). Thus, the primary challenge for this
energy-constrained sensor networks is to design effi-
cient schemes to reduce the energy consumption.
Generally, when an event happens, many sensor
nodes in a region around it generate redundant sensed
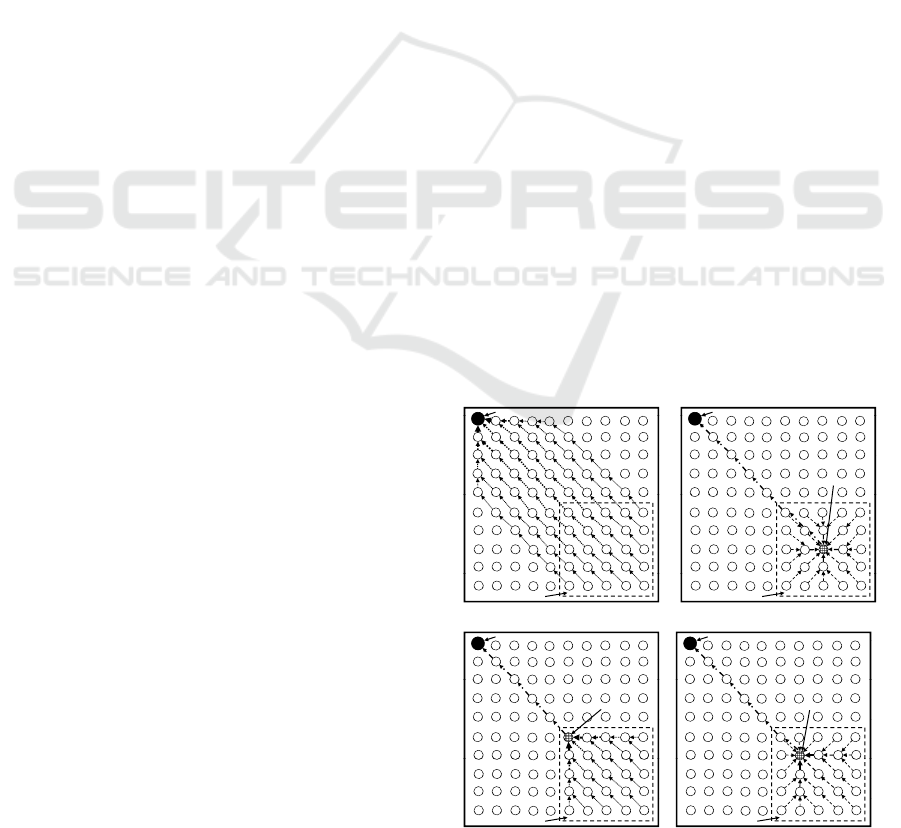
data (Luo and Liu, 2007). Then, as shown in Fig
1(a), the total energy consumption will be significant
if each sensor node in the event region directly dis-
seminates its sensed data to a sink. A general solution
is that a Data Aggregation Node (DAN) in the event
region gathers the sensed data from the other sensor
nodes and forwards aggregated data to the sink (Aky-
ildiz et al., 2002). However, it is a difficult issue that
which node should be selected as the DAN so that the
energy consumption can be minimized.
Two schemes (Zhang and Cao, 2004)(Petrovic
et al., 2003) have been proposed to address this is-
sue. As shown in Fig. 1(b), the scheme proposed in
(Zhang and Cao, 2004) selects the sensor node at the
center of the event region as a DAN to minimize the
Sink
Sink
Event region
(a)
Sink
Sink
Data aggregation node
Event region
(b)
Sink
Sink
Data aggregation node
Event region
(c)
Sink
Sink
Data aggregation node
Event region
(d)
F
igure 1: Data dissemination schemes from an event region
to a sink: (a) the directed scheme, (b) the center scheme,
and (c) the nearest scheme, and (d) the proposed scheme.
energy consumption for gathering sensed data from
sensor nodes. As shown in Fig. 1(c), the scheme pro-
posed in (Petrovic et al., 2003) selects the sensor no-
391
Yim Y., Lee E., Oh S. and Kim S..
SELECTION MECHANISM OF ENERGY-EFFICIENT DATA AGGREGATION NODE IN WIRELESS SENSOR NETWORKS.
DOI: 10.5220/0003907503910395
In Proceedings of the 2nd International Conference on Pervasive Embedded Computing and Communication Systems (PECCS-2012), pages 391-395
ISBN: 978-989-8565-00-6
Copyright
c
2012 SCITEPRESS (Science and Technology Publications, Lda.)

de nearest to the sink as a DAN to minimize the en-
ergy consumption for forwarding the aggregated data
to the sink. However, the center scheme hardly re-
duces the energy consumption for gathering sensed
data from sensor nodes in the event region if the event
region is small, and however consumes much energy
for forwarding the aggregated data to the sink if the
event region is far from the sink. In contrast, the
nearest scheme hardly reduces the energy consump-
tion for forwarding the aggregated data to the sink if
the event region is close to the sink, and however con-
sumes much energy for gathering sensed data from
sensor nodes in the event region if the event region is
big.
Hence, to address this issue, as shown in Fig. 1(d),
this letter proposes a scheme which selects a sensor
node in the event region as the DAN so that the total
energy consumption for gathering sensed data and for
forwarding aggregated data can be minimized. This
letter presents an analytical model for calculating the
energy consumption for gathering sensed data and for
forwarding aggregated data. Analysis and simulation
results show that the proposed scheme outperforms
both the center scheme and the nearest scheme in
terms of the energy consumption.
2 THE PROPOSED SCHEME
2.1 Network Model
We describe a network model to implement our work.
A sink and sensor nodes are deployed in a sensor net-
work. Each node is aware of its own location infor-
mation through GPS device or localization techniques
(Karp and Kung, 2000). All sensor nodes can know
the location of the sink by programming the loca-
tion to the sensor nodes or flooding the location by
the sink. If an event happens, sensor nodes in its
surrounding region detect it and generate data with
their won location information because many appli-
cations in wireless sensor networks require the loca-
tion of source data, for example, target tracking and
habitat monitoring. Then, the sensor nodes dissemi-
nate their data to the sink by geographic routing (Karp
and Kung, 2000). After receiving data with the lo-
cation information from the sensor nodes, the sink
calculates the location information of the event re-
gion and selects one among the sensor nodes in the
event region to function as a Data Aggregation Node
(DAN), through the location information of the sen-
sor nodes. The sink sends a DAN
Selection message
with the location information of the event region to
the DAN by geographic routing. The DAN floods a
DAN
Announcement message with its location infor-
mation in the event region through the well known
geocasting protocols (Stojmenovic, 2004). Through
the messages, the other sensor nodes in the event re-
gion get to be aware of location information of the
DAN and disseminate their data to the DAN. The
DAN gathers data from sensor nodes in the event re-
gion and forwards aggregated data to the sink.
2.2 Data Aggregation Node (DAN)
Selection
We develop an analytical model to select a DAN in
an event region. In the analytical model, the total en-
ergy consumption function E
t
for data dissemination
from sensor nodes in the event region to the sink con-
sists of the energy consumption function E
g
that the
DAN gathers the sensed data from the sensor nodes,
and the energy consumptionfunction E
f
that the DAN
forwards the aggregated data to the sink.
The energy consumption model proposed in
(Heinzelman et al., 2002) is exploited by our ana-
lytical model which defines the communication cost
(E
C
(k, r)) as the energy consumption of transmitting
(E
T
(k, r)) and receiving (E
R
(k, r)) a k-bit packet with
a distance r:
E
C
(k, r) = E
T
(k, r) + E
R
(k, r). (1)
E
T
(k, r) and E
R
(k, r) are defined as
E
T
(k, r) = E
elec
· k + ε
amp
· k · r
2
(2)
E
R
(k, r) = E
elec
· k, (3)
where the transmitter of sensor nodes dissipates E
elec
= 50 nJ/bit to run the transmitter or receiver circuitry
and ε
amp
= 100 pJ/bit/m
2
for transmit amplifier. Since
every sensor node uses same transmission power, the
r is its transmission range.
Consider a set of sensor nodes S = {n
1
, n
2
, ... ,n
N
}
in an event region. If the sink has topology informa-
tion of all sensor nodes, it can optimally select a sen-
sor node n
o
in the set S as the DAN whose total en-
ergy consumption cost is minimal. The total energy
consumption cost function E
t
o
of the optimal scheme
is defined as
E
t
o
(o) = E
g o
(o) + E
f o
(o). (4)
E
g
o
and E
f o
are defined as follows.
E
g o
(o) =
N
∑
i=1,i6=o
real
hops(i, o) · E
C
(sen size, r) (5)
E
f
o
(o) = real
hops(o, s) · E
C
(aggre size, r) (6)
Here, the real
hops(i, o) and real hops(o, s) are the
number of real hop counts between two nodes o and i,
PECCS 2012 - International Conference on Pervasive and Embedded Computing and Communication Systems
392

and between the node o and the sink s, respectively.
The sen size is a packet size of sensed data gener-
ated in a sensor node. The aggre
size is a packet
size of aggregated data that the DAN aggregates the
gathered data from the other source nodes in the set
S. The aggre
size depends on data aggregation ratio
(Luo and Liu, 2007) which is the ratio of the amount
of outgoing data to that of incoming data at a DAN.
This ratio at a DAN may vary widely according to ap-
plications in sensor networks.
Although the optimal scheme can minimize the
total energy consumption, it is not practical since it
assumes that the sink can know real hop counts be-
tween any two nodes from knowledge of the network
topology. Therefore, we propose a scheme to derive
heuristically the total energy cost function through
only location information in geographic routing when
the sink knows only location information of sensor
nodes in the event region. We assume that sensor
nodes are densely and uniformly deployed in a sen-
sor field and all sensor nodes have the same trans-
mission range. Accordingly, the total energy con-
sumed by transmitting a data packet along a multi-
hop path in geographic routing is proportional to the
Euclidean distance between a source node and a des-
tination node. This assumption is justified by the fact
that the Euclidean distance between two nodes in a
dense and uniform wireless sensor network is approx-
imately proportional to the hop count between the
same nodes (Niculescu and Nath, 2003). We note
that such an energy model is also adapted by several
existing energy-efficient communication protocols in
wireless sensor networks (Kim et al., 2003).
About the set S = {n
1
, n
2
, ... ,n
N
}, the pro-
posed scheme defines the total energy consumption
cost function E
t
p
(j) of each node n
j
in the set S as
E
t
p
( j) = E
g p
( j) + E
f p
( j). (7)
E
g
p
and E
f p
are defined as follows.
E
g
p
( j) =
N
∑
i=1,i6= j
geo
hops(i, j) · E
C
(sen size, r) (8)
E
f
p
( j) = geo
hops( j, s) · E
C
(aggre size, r) (9)
Here, the geo
hops(i, j) is the number of the expected
hop counts between locations of two nodes i and j,
and the geo
hops(i, j) is the number of the expected
hop counts between locations of sensor node i and the
sink s. The geo
hops(i, j) is calculated as
geo
hops(i, j) =
d(i, j)
Single Hop Pro
ave
+ 1, (10)
where the d(i, j) is defined as the Euclidean distance
between the nodes i and j, and the Single
Hop Pro
ave
means an average single-hop progress and is defined
as the expected value of the difference between the
before-hop distance (between the sender node and
the destination node) and the after-hop distance (be-
tween the next-hop node and the destination node)
(Chen et al., 2007). We use a value calculated
by the equation (14) in (Chen et al., 2007) as the
Single
Hop Pro
ave
where ρ is the average number
of neighbors within the transmission range r of the
sender and is given by ρ = πr
2
λ where λ is the ex-
pected number of nodes within a unit area.
Hence, the sink determines a sensor node n
j
in the
set S as the DAN, whose E
t
p
( j) is minimal.
3 ANALYSIS
Based on our analytical model, we analyze the four
schemes in Fig. 1. The total energy consumption of
the direct scheme in Fig. 1(a) is defined as
E
t
d
=
n
∑
i=1
geo
hops(i, g) · E
C
(sen size, r). (11)
The total energy consumption of the center scheme in
Fig. 1(b) is defined as
E
t
c
= E
g c
(c) + E
f c
(c). (12)
E
g
c
and E
f c
are defined as follows.
E
g
c
(c) =
n
∑
i=1,i6=c
geo
hops(i, c) · E
C
(sen size, r) (13)
E
f
c
(c) = geo
hops(c, g) · E
C
(aggre size, r) (14)
The energy consumption of the nearest scheme in Fig.
1(c) is defined as
E
t
n
= E
g n
(n) + E
f n
(n). (15)
E
g
n
and E
f n
are defined as follows.
E
g
n
(n) =
N
∑
i=1,i6=n
geo
hops(i, n) · E
C
(sen size, r)
(16)
E
f
n
(n) = geo
hops(n, g) · E
C
(aggre size, r) (17)
The energy consumptions of the proposed scheme in
Fig. 1(d) and the optimal scheme are the equation (7)
and (4), respectively.
4 PERFORMANCE EVALUATION
We compare the performance of the proposed scheme
(PS) with that of the optimal scheme (OS), the center
scheme (CS), and the nearest scheme (NS) through
SELECTION MECHANISM OF ENERGY-EFFICIENT DATA AGGREGATION NODE IN WIRELESS SENSOR
NETWORKS
393
analytical and simulation results. We implemented
the four schemes in Network Simulator Qualnet 4.0.
The models of sensor nodes are followed by the spec-
ification of MICA2. The transmitting and receiving
energy consumption rates of sensor nodes are 42mW
and 29mW, respectively. The transmission range of
sensor nodes is 50m. The size of the sensor network
is set to 500m*500m where 1000 nodes are uniformly
distributed. As default setting, the dimension of an
event region is 7500m
2
, the distance from the event
region to the sink is 150m, the size of a sensed data is
30 bytes, and the data aggregation ratio is 0.3.
2500 5000 7500 10000 12500 15000
2000
4000
6000
8000
10000
12000
14000
The energy consumption (mW)
Area of event region (m
2
)
OS
PS-analysis
PS-simulation
CS-analysis
CS-simulation
NS-analysis
NS-simulation
Figure 2: The energy consumption for the area of event re-
gion.
10 20 30 40 50 60
1000
2000
3000
4000
5000
6000
7000
8000
9000
10000
11000
The energy consumption (mW)
Size of reporting packet (byte)
OS
PS-analysis
PS-simulation
CS-analysis
CS-simulation
NS-analysis
NS-simulation
Figure 3: The energy consumption for the size of sensed
data packet.
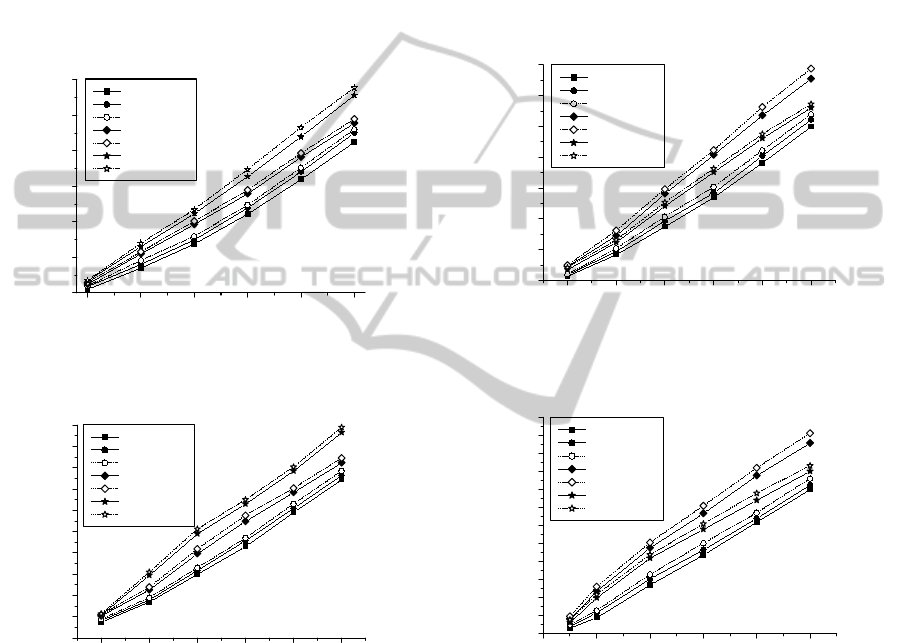
We present four analysis and simulation results for
four parameters in relation to total energy cost for data
dissemination from an event region to a sink. Fig. 2
and 3 show analysis and simulation results for the area
of an event region and for the size of sensed data in
relation to data gathering cost of a DAN. The optimal
scheme consumes least energy because it selects an
optimal DAN in ideal conditions with network topol-
ogy information. Since the proposed scheme consid-
ers both data gathering cost and aggregated data for-
warding cost, its energy consumption approximates
to that of the optimal scheme irrespective of the area
or the size. When the area or the size is small, the
center scheme and the nearest scheme have similar
energy consumption because the effect for reducing
data gathering cost happens very little. However, if
the area or the size increase, the energy consumption
of the center scheme is less than that of the near-
est scheme and approximates to that of the optimal
scheme as that of the proposed scheme. Because,
the center scheme minimizes the data gathering cost
which is much greater than aggregated data forward-
ing cost.
50 100 150 200 250 300
2000
3000
4000
5000
6000
7000
8000
9000
The energy consumption (mW)
Distance from event region to sink (m)
OS
PS-analysis
PS-simuation
CS-analysis
CS-simulation
NS-analysis
NS-simulation
Figure 4: The energy consumption for the distance from
event region to sink.
0.0 0.2 0.4 0.6 0.8 1.0
2000
2500
3000
3500
4000
4500
5000
5500
6000
6500
7000
7500
8000
The energy consumption (mW)
Data aggregation ratio
OS
PS-analysis
PS-simulation
CS-analysis
CS-simulation
NS-analysis
NS-simulation
Figure 5: The energy consumption for data aggregation ra-
tio.
Fig. 4 and 5 show analysis and simulation results
for the distance from an event region to a sink and
for the data aggregation ratio in relation to aggregated
data forwarding cost from a DAN to the sink. The
optimal scheme consumes least energy and the pro-
posed scheme consumes energy approximate to the
optimal scheme, because they considers both sensed
data gathering cost and aggregated data forwarding
cost. When the distance or the ratio is small, the en-
ergy consumption of the nearest scheme is similar to
that of the center scheme because the effect for reduc-
ing data gathering cost happens very little. However,
PECCS 2012 - International Conference on Pervasive and Embedded Computing and Communication Systems
394

if the distance or the ratio increases, the energy con-
sumption of the nearest scheme approximates to that
of the optimal scheme as that of the proposed scheme.
Because, the nearest scheme minimizes the aggre-
gated data forwarding cost which is much greater than
the data gathering cost.
500 1000 1500 2000 2500 3000
4000
5000
6000
7000
8000
9000
10000
The energy consumption (mW)
Node density in uniform deployment
OS
PS-analysis
PS-simulation
CS-analysis
CS-simulation
NS-analysis
NS-simulation
Figure 6: The energy consumption for the node density in
uniform deployment.
500 1000 1500 2000 2500 3000
4000
5000
6000
7000
8000
9000
10000
The energy consumption (mW)
Node density in random deployment
OS
PS-analysis
PS-simulation
CS-analysis
CS-simulation
NS-analysis
NS-simulation
Figure 7: The energy consumption for the node density in
random deployment.
Next, to justify our analytical model, we compare
analysis and simulation results for the density of sen-
sor nodes (namely, the number of sensor nodes) in
their uniform and random deployment. Fig. 6 and 7
show analysis and simulation results in uniform and
random deployment, respectively. In uniform deploy-
ment, the difference between analytical and simula-
tion results is small. If the node density increases, an-
alytical results is almost similar to simulation results.
In random deployment, if the node density is small,
the difference between analytical and simulation re-
sults is bigger than that in uniform deployment. How-
ever, if the node density increases, analysis results is
approximate to simulation ones. It is because the real
hop counts in real sensor network and the geograph-
ical hop counts in our analytical model between any
two nodes are almost the same in high node density.
5 CONCLUSIONS
This letter presents a scheme to select a Data Aggre-
gation Node (DAN) for minimizing the energy con-
sumption for data dissemination from an event region
to a sink. In the analytical model described herein,
the proposed scheme selects a sensor node in the
event region as the DAN, by which the total energy
consumption for gathering sensed data from sensor
nodes and for forwarding aggregated data to the sink
is minimized. The slight difference between analyt-
ical and simulation results proves that our analytical
model is well designed. Analytical and simulation re-
sults show that the proposed scheme is more energy-
efficient than the center and nearest schemes.
REFERENCES
Akyildiz, I., Su, W., Sankarasubramaniam, Y., and Cayirci,
E. (2002). A survey on sensor networks. In IEEE
Communication Magazine. IEEE.
Chen, D., Deng, J., and Varshney, P. (2007). Selection
of a forwarding area for contention-based geographic
forwarding in wireless multi-hop networks. In IEEE
Transactions on Vehicular Technology. IEEE.
Heinzelman, W., Chandrakasan, A., and Balakrishnan, H.
(2002). An application-specific protocol architecture
for wireless microsensor networks. In IEEE Transac-
tions on Wireless Communications. IEEE.
Karp, B. and Kung, H. T. (2000). Gpsr: Greedy perime-
ter stateless routing for wireless networks. In ACM
Mobicom. ACM.
Kim, H., Abdelzaher, T., and Kwon, W. (2003). Minimum-
energy asynchronous dissemination to mobile sinks in
wireless sensor networks. In ACM SenSys. ACM.
Luo, H. and Liu, Y.and Dasi, S. (2007). Routing correlated
data in wireless sensor networks: A survey. In IEEE
Network. IEEE.
Niculescu, D. and Nath, B. (2003). Dv based positioning
in ad hoc networks. In Journal of Telecommunication
Systems. Springer.
Petrovic, D., Shah, R., Ramchandran, K., and Rabaey, J.
(2003). Data funneling: Routing with aggregation and
compression for wireless sensor networks. In IEEE
International Workshop on SNPA. IEEE.
Stojmenovic, I. (2004). Geocasting with guaranteed deliv-
ery in sensor networks. In IEEE Wireless Communi-
cations. IEEE.
Zhang, W. and Cao, G. (2004). Dctc: Dynamic convoy
tree-based collaboration for target tracking in sensor
networks. In IEEE Transactions on Wireless Commu-
nications. IEEE.
SELECTION MECHANISM OF ENERGY-EFFICIENT DATA AGGREGATION NODE IN WIRELESS SENSOR
NETWORKS
395
