
A NEW PARALLELIZABLE DEFORMATION METHOD
Automatic Comparision between Foot and Last
J. M. Buades, M. Gonzalez-Hidalgo, Francisco J. Perales, S. Ramis-Guarinos,
A. Oliver and V. Blanch
Computer Graphics Vision and Artificial Intelligence Group, Department of Math. and Comp. Science,
University of Balearic Island, Anselm Turmeda Building, Crta. Valldemossa Km 7.5, E-07122 Palma de Mallorca, Spain
Keywords: Biometrics, Shoes, Foot, Footwear, Deformation, Anatomy.
Abstract: This document shows the research project developed by the Computer Graphics and Vision Group in
collaboration with Inescop.
The main objective of this project is to define a new methodology to design
shoes exactly adapted to the shape foot. The system proposed is based on a biomechanical anatomical
structure of the foot and using a deformable shape. Using with several joints adapted the different foots to
different shoe last evaluating the error between the surfaces. The system is automatic driven in the selection
of significant foot points. We consider several anthropometrical parts of the foot in order to apply the
deformations of the shape with different axis. The proposed system is implemented in software. An
associated Application Programming Interface (API) is also developed for commercial use of the system.
Also the results presented evaluate the error between deformations.
1 INTRODUCTION
The footwear manufacturers from Europe, and
particularly from Spain, need to go towards highly
technified and added value products, since they
cannot compete in price against the low cost
producing countries invading the markets.
Personalisation is an ideal strategy: It offers a high
added value and links the client to the enterprise.
Once the scanned feet of the client are registered, the
client could demand his personalised shoes from the
catalogue, even through the Internet, knowing the
shoes will fit. The system presented in this paper
project completes and follows one of the research
and development lines which is being carried out at
the INESCOP for several years, and is a clear
example of collaboration between industry and
university research group. Until now this project
(European ERGOSHOE project: http://www.ergo
shoe.inescop.es; also CEC-made shoe project: www.
cec-made-shoe.com) led to the development of a low
cost 3D foot scanner, a high precision 3D last
scanner and a software tool (Forma-3D) for last
design which also allows to superimpose and
compare different volumes (e.g. foot and last).
However there are still unsolved issues. With the
general aim in mind of improve the automatic
process of personalising footwear, in this paper we
address the issue of virtually deform the foot in
order to predict his geometry once it is placed upon
an elevated sole profile (e.g. high heels), basing on
the scan performed at feet flat on the ground and the
profile of the last sole. It is necessary to be able to
utilise the foot scan of the flat foot for multiple lasts,
and most of the lasts have a certain amount of heel
rise. The elevated sole profile is determined by the
last.
The idea of "measuring" the shoe fit to the foot is
not new. Jacob Lowe in 1927 obtained a patent for a
fluoroscope intended to check the fit of the shoes
visually (Lowe, 1927). However, and having the
right technology, have not made great progress since
then. The process of digitizing a foot and change the
last shape from its numerical representation is
something that is already being done at the
theoretical and practical level (Luximon et al., 2005;
Luximon et al., 2003; Mochimaru et al., 2000).
There have been some advances in foot volume
parameterization from 3D coordinates of discrete
points (Luximon et al., 2003; Luximon et al., 2004;
Luximon et al., 2003b), and numerous mathematical
models have appeared for describing the foot motion
(Arampatzis et al., 2002; Carson et al., 2001),
however, offer no information on the volume of the
foot. There are also models that describe the shape
363
M. Buades J., Gonzalez-Hidalgo M., J. Perales F., Ramis-Guarinos S., Oliver A. and Blanch V..
A NEW PARALLELIZABLE DEFORMATION METHOD - Automatic Comparision between Foot and Last.
DOI: 10.5220/0003860803630369
In Proceedings of the 1st International Conference on Pattern Recognition Applications and Methods (SADM-2012), pages 363-369
ISBN: 978-989-8425-98-0
Copyright
c
2012 SCITEPRESS (Science and Technology Publications, Lda.)
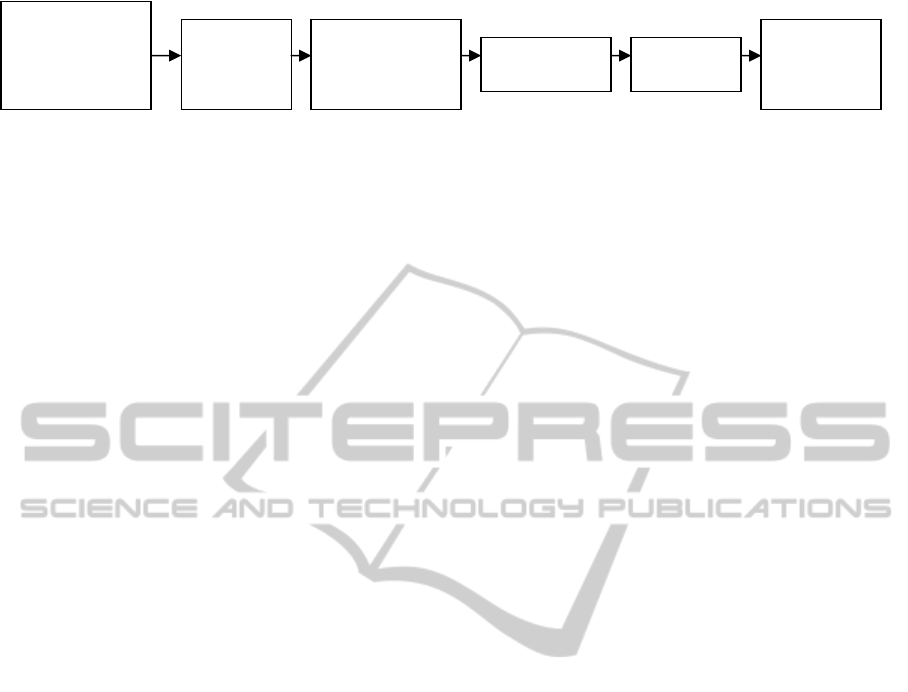
Figure 1: Description of the deformation virtual process.
of the foot, but these tend to be static (Luximon et
al., 2004), some of then described the deformation of
the foot depending on the load (Houston et al., 2006)
and there are also attempts to record real-time full
volume during walking (CEC made shoe project).
But, in our concern, we have not found articles
performing deformation models of the foot for
applications with time restrictions.
Foot deformation into a high level position, as
we can see in Fig. 4, is not so simple. Techniques
such as Free Form Deformation (Mochimaru et al.,
2000) or warping to the silhouette of the shoe last
will not produce satisfactory results for such cases.
Using an analytical model of foot bones that will
lead to surface deformation could produce useful
results (Carson et al., 2001), but has a high
consuming time. Leon Kos et al. (2002) propose that
the scanned foot in the flat position should be
matched with a similar foot from the database to
obtain land mark similarities for the fitness analysis.
J. Leng et al. (2005) propose to use a distance map
to indicate how well the selected shoe last fits the
specific foot shape and to guide the deformation, in
this case, the idea is to deform existing last model to
fit a consumer’s foot shape with minimally affecting
the original last style, this process is achieved by
minimizing an equation. Only results using men’s
shoes with low profile are shown. As we can see a
typical idea is to select from an existing shoe lasts
database or deform an existing shoe last model into
one that fits the scanned foot data (Luximon et al.,
2005; Li et al., 2004; Mochimaru et al., 2000; Kim
et al., 2002; Cheng et al., 1999).
In this paper we propose a system to predict and
study the deformation of a consumer's foot when it
adapts to different lasts, for in a subsequent process,
design the best last that fits its foot.
The proposed system uses as input, a scanned
three-dimensional model of the foot, obtained
through the INESCOP 3D scanner (see (Telfer et al,
2010) for other 3D surface scanning), and also a
model of the last sole. The foot is scanned over a flat
plane and its orientation is irrelevant, since the
system is designed to automatically reposition the
foot to agree with the last sole orientation. The
process described in this paper is shown in Figure 1.
Moreover, the computations for each vertex of the
3D foot model are independently, therefore the
whole process is easily parallelizable. This fact is
important because it can have to compare the last
and foot deformation obtained with several last sole,
then the computation time is extremely important.
The paper is organized as follows. Section 2 is
devoted to the description of the deformation
process of the foot. The analysis of the results is
carried out in Section 3. Finally, the paper ends with
the conclusions and future work
2 DEFORMATION
In this section, we describe the method used for foot
deformation.
Through a 3D capture system for feet, we scan
three fundamentals elements: the foot, the platform
shoe and both together. We can process these three
elements by means of our algorithm. We will
describe the five steps of our algorithm: obtaining
significant foot points, division of foot areas,
calculation of the deformed sole, calculation of the
foot’s top and fusion of both parts.
2.1 Significant Foot Points
To obtain an accurate deformation we need to
calculate several significant foot points. The most
important points are IH, IF, MT, MF, HA and HB
(see Figure 2). To obtain these points we have that
the length of the foot is the x-coordinate, the width is
the y-coordinate and the height is the z-coordinate.
HF is the point with lowest x-coordinate and IF is
the point with the lowest distance between the point
HF and all the points of the top’s foot border line.
Now we divide the length of the foot in two
parts: forefoot (from the middle of the foot to the
toes) and hindfoot (from the middle of the foot to the
heel). In the forefoot we find the points MF and MT.
MF is the point with the lowest y-coordinate and MT
is the point with the highest y-coordinate. Doing the
same in the hindfoot we have that HA is the point
with the lowest y-coordinate and HB is the point
with the highest y-coordinate.
With the points MT and MF we create the plane
Deformed
model
Deformation
of the top
Comparison
with the
real foot
Scanned 3D
coordinates
(Foot, upswing,
foot raised)
Obtaining
significant
points
Deformation
of the sole
from a last shoe
ICPRAM 2012 - International Conference on Pattern Recognition Applications and Methods
364
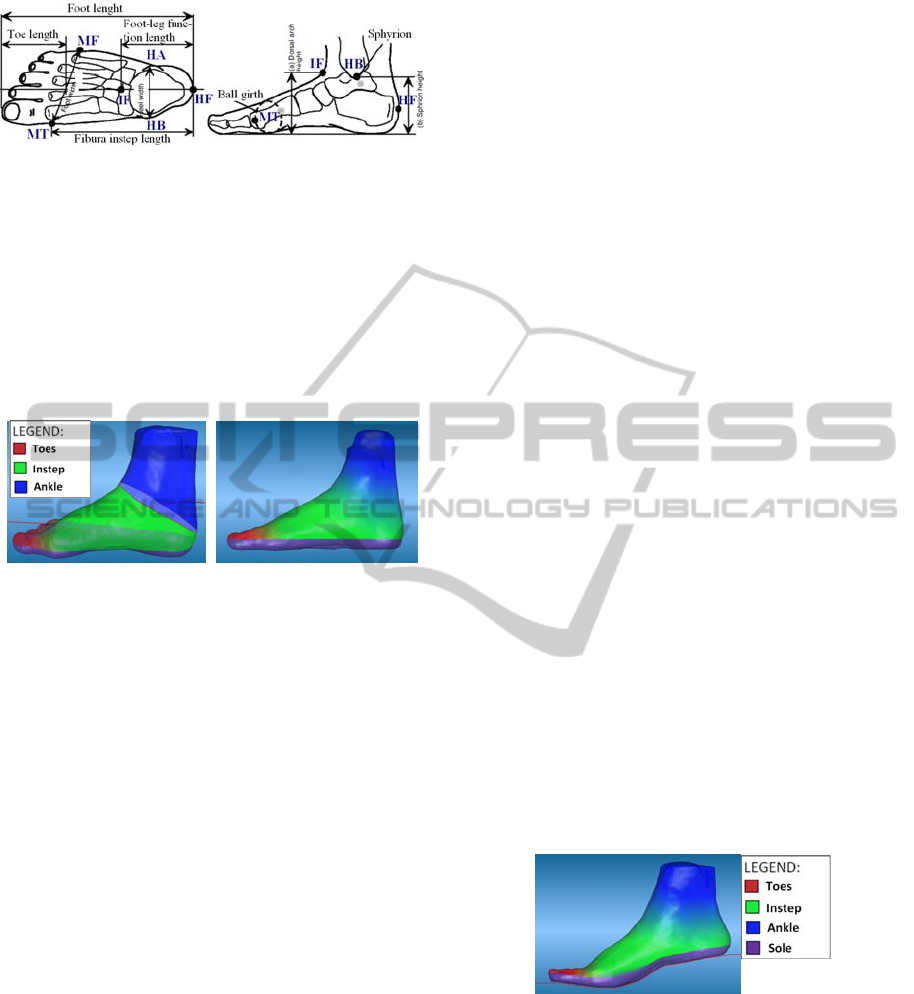
Figure 2: Foot dimensions.
that divides the toes from the instep (Figure 3, left)
and with the points IF and HF we create the plane
that divide the instep from the ankle (Figure 3, left).
2.2 Division of the Foot Areas
The planes delimit the different parts of the foot. We
divide the foot into three areas as you can see on the
left of the Figure 3.
Figure 3: Left: planes of the foot. Right: areas of the foot.
We separate the foot into two principal parts:
(see Figure 3, right): the sole (purple colour) and the
top (red, blue and green areas). Each part will suffer
a different type of deformation according to their
characteristics.
2.2.1 Cut Section of the Sole
The sole of the shoe last is a fundamental part to
create a custom shoe because its shape will depend
on the user’s weight distribution on footwear. This
fact influences in the comfort of the shoe.
From the scanned and the significant points we
determine the cut of the sole, which is malleable to
the deformation line (see the red line of the Fig. 4).
The calculation of this cut is realized with the MT
point (Figure 2). All points that are below this point
are the sole.
2.2.2 Cut Section of the Top
The top requires a different type of deformation.
Must be generate a virtual skeletal from the 3D foot
model scanned and the joint axes allowing a more
accurate deformation. The foot model has two
principal joints: the metatarsal joint and the ankle
joint. Then the top is considered as the part that it
doesn’t belong to the sole.
2.2.2.1
Metatarsal Joint
The metatarsal bones are those responsible for the
toes movement. This joint is essential in the virtual
deformation, because it allows the correct rotation of
the forefoot. In this paper, we consider that this joint
is the most important for a good deformation,
because it is the most influential in the final shape of
the foot.
To find this joint, we get the most prominent
points of the forefoot (MT and MF). The axis of
rotation passes through these two points (see Fig. 2).
2.2.2.2 Ankle Joint
The ankle joint is obtained from the most prominent
points of the hindfoot (HA and HB). The axis of
rotation passes through these two points (see Figure
2) allowing joint movement.
2.3 Deformation of the Sole
The deformation of the sole is the first step to obtain
the final deformed foot. This part must be adapted
with precision to the deformation line. So, it needs a
different deformation to the top of the foot.
Once obtained the cut section that delimits the
sole, we need to obtain the deformation line. This
line is obtained from the platform. We cut the
platform by a plane that crosses longitudinally.
Then, we obtain the normal to every point of the
line. This is necessary to correctly locate points on
the deformed sole. The distance between them varies
according to deformation line. Thus we get simulate
the deformation suffered by the foot. In the Figure 4,
we show an example of the final deformation where
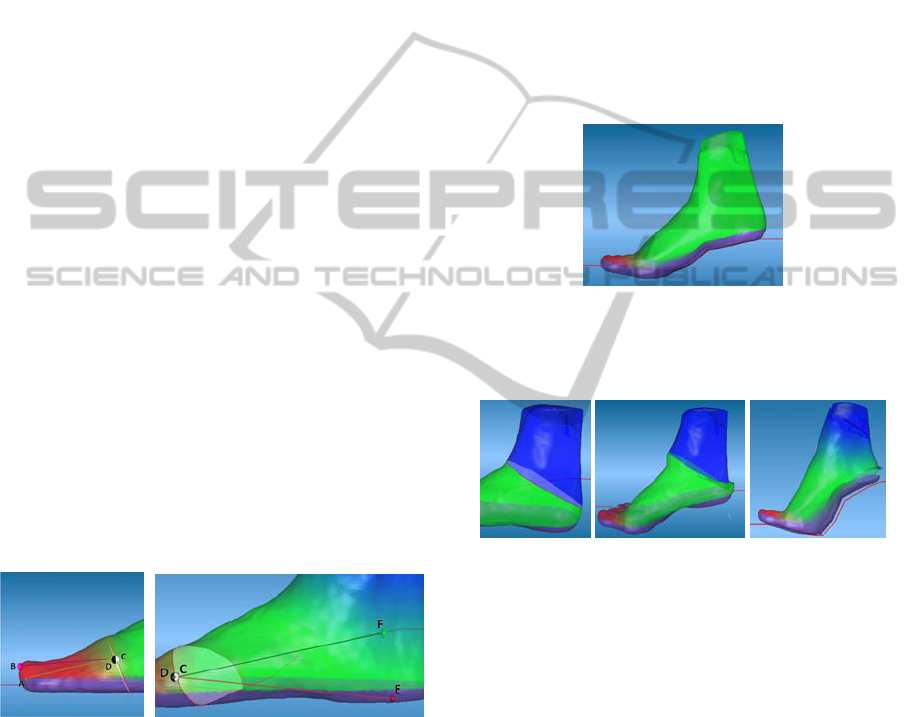
you can see the final deformation of the sole.
Figure 4: Deformed foot and the final deformation of the
sole in purple.
2.4 Deformation of the Top
On the right of Figure 3 we divide the foot into four
areas, but as we only want the top, we have three
parts: the toes area, the instep area and the ankle
area.
Each area is separated by a joint and it has a
different rotation angle. To join all parts, we must
A NEW PARALLELIZABLE DEFORMATION METHOD - Automatic Comparision between Foot and Last
365
make a smoothing. The result meets the C1
continuity. Therefore, we apply an interpolation
between the different areas (see Figure 4).
2.4.1 Rigid Areas
The toes, the instep and the ankle are considered
rigid parts of the foot. When the foot is deformed,
we apply it a composition of transformations:
)(
1−
⋅⋅= TRTM
.
(1)
It is basically moves the object to the origin (T),
rotates (R) and returns it to its original point (T
-1
).
Then,
,
1000
100
010
001
⎟
⎟
⎟
⎟
⎟
⎠
⎞
⎜
⎜
⎜
⎜
⎜
⎝
⎛
=
z
y
x
T
,
1000
100
010
001
1
⎟
⎟
⎟
⎟
⎟
⎠
⎞
⎜
⎜
⎜
⎜
⎜
⎝
⎛
−
−
−
=
−
z
y
x
T
(2)
.
1000
0cos0sin
0010
0sin0cos
⎟
⎟
⎟
⎟
⎟
⎠
⎞
⎜
⎜
⎜
⎜
⎜
⎝
⎛
−
=
αα
αα
R
(3)
The axis of rotation is the y-axis both for the
metatarsal joint and the ankle joint, as we explained
above. Then,
.
1000
cossincos0sin
0010
sincossin0cos
⎟
⎟
⎟
⎟
⎟
⎠
⎞
⎜
⎜
⎜
⎜
⎜
⎝
⎛
+−−
+−−
=
zzx
xzx
M
αααα
αααα
(4)
To determine the rotation angles, we consider
three areas:
Figure 5: Left: rotation angle of the toes. Right: rotation
angle of the instep.
Toes area. It calculates the most prominent
point of the foot, with the foot without
deforming (point A) and with the deformed
foot (point B). Then you need the furthest
point in the toes area. It is located at the height
of the plane that divides the toes area and the
instep area. We find this point with the foot
without deforming (point C) and with the
deformed foot (point D). The angle is formed
by the vectors C-A, D-B (see Figure 5, left).
Instep area. You take the same point C and D
calculated for the toes area. We estimated the
farthest point that it is in the heel: the point
with the foot without deforming (point E) and
with the deformed foot (point F). The angle,
as shown in Figure 5 on the right, is the vector
formed by the E-C, D-F.
Ankle area. The angle used to rotate the ankle
is the same that is used for the instep area,
except that now it will be negative. With this
we get that the ankle turn back to be straight
because first the instep is rotated and this
affects the ankle too (Figure 6). So, it was
subsequently applied the same rotation but
with a negative angle (Figure 7 and 8).
Figure 6: Deformed foot without rotated ankle.
It should be noted that the IF and HF points (Fig.
2) create the first plane that delimit the ankle area.
Figure 7: Left: unrotated ankle (one plane). Middle:
rotated ankle (one plane). Right: interpolation with one
plane.
As shown in Figure 7, with one plane; the
vertices get into the sole. To avoid this problem in
the first stage is realized an interpolation in this area
(see the right side of Figure 7), but results are not
entirely satisfactory. This is because the cut of the
sole has a different deformation. Thus, it was
considered convenient to use also a second plane
(Figure 8) to avoid the problem. Later we will
realize an interpolation that it is described below.
When we apply the interpolation we are obtained
more satisfactory results and more tight according to
the line of deformation. We can compare the results
obtained by the interpolation using one plane (Figure
7, right) and two planes (Figure 8, right),
respectively.
ICPRAM 2012 - International Conference on Pattern Recognition Applications and Methods
366
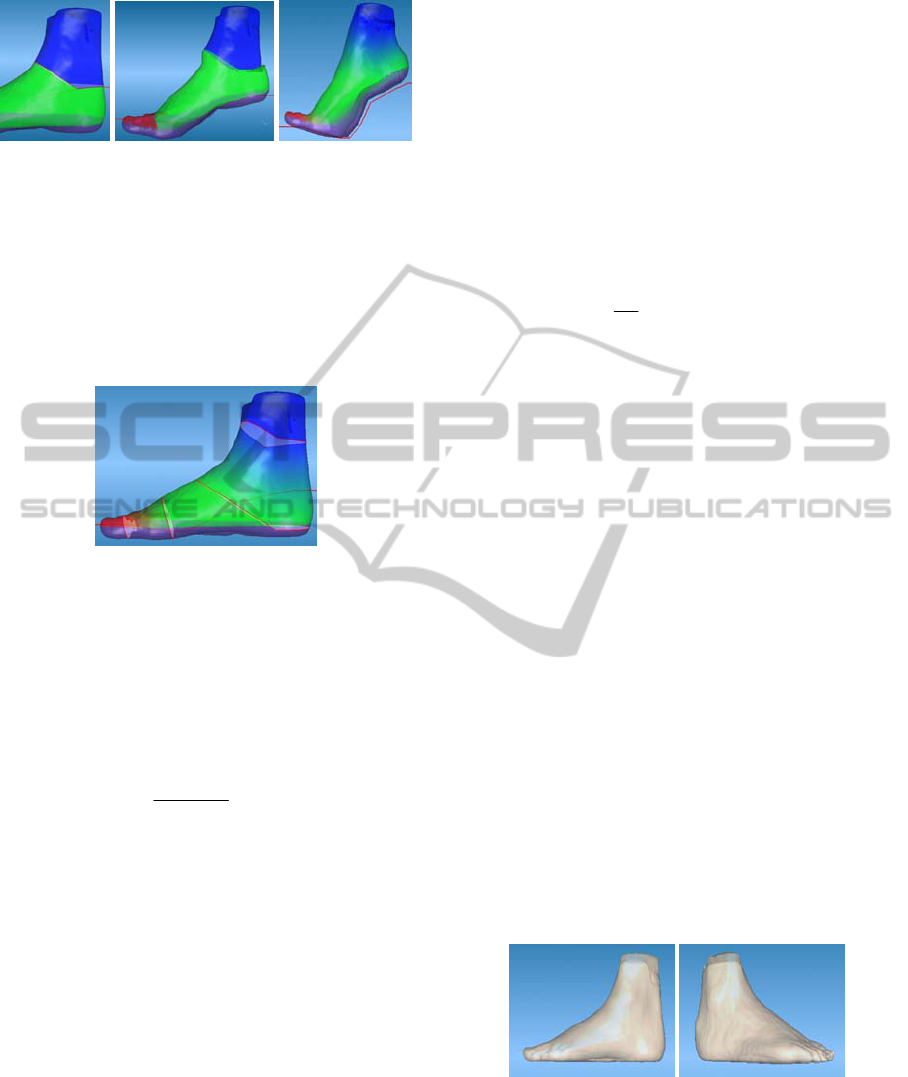
Figure 8: Left: unrotated ankle (two planes). Middle:
rotated ankle (two planes). Right: interpolation with two
planes.
2.4.2 Interpolation Areas
Figure 9 shows the interpolation areas, which are
bounded by the planes where there are the colour
transitions. The interpolation process is similar to
that used in the paper (Kavan, 2003).
Figure 9: Interpolation areas.
This zone is delimited by t
min
and t
max
. Where t
min
is the lower plane and t
max
is the higher plane. The t’
is the distance between the point and the lower
plane. It is positive for points in the n direction.
Negative for points behind the plane (in the –n
direction) and zero for points incident to the plane.
The interpolation parameter is:
minmax
min
'
tt
tt
t
−
−
=
(5)
Therefore, we apply an interpolation of the angle
(β) when we rotate all vertex of this zone. Where β =
α·t, α is the angle calculated for the rigid zones. That
is,
.
1000
cossincos0sin
0010
sincossin0cos
⎟
⎟
⎟
⎟
⎟
⎠
⎞
⎜
⎜
⎜
⎜
⎜
⎝
⎛
+−−
+−−
=
zzx
xzx
M
ββαββ
ββββ
(6)
This way, we obtain a simple implementation of
the deformation, which allows for an acceptable
computational cost. This allows obtaining tight
results to real deformation that suffers the foot.
2.5 Fusion of Parts
Once we have both the top and bottom of the
deformed model, it is necessary to merge both into a
single three-dimensional model that represents the
client's foot placed on the platform. This 3D model
can be compared a posteriori with different shoe
lasts and so, you can check the comfort of them.
The fusion is a simple process, since it is based
on linking two three-dimensional models into a
single one, considering the shared points. These
points will form a union that can present certain
anomalies product of the deformation process, so it
is smoothed using the Laplacian smoothing
technique. This process is also known as diffusion.
Fusion equation takes the form,
),(XL
t
X
λ
=
∂
∂
(7)
where X is the vertex of the mesh, is the Laplacian,
and λ is a scalar which controls the rate of diffusion.
Assuming that the Laplacian operator is linear, the
smoothing equation can be written as the following
difference equation forward.
).()()1( nXdtLInX
λ
+
=
+
(8)
Doing this we do not achieve changing the
connectivity of the mesh. Each step changes the
position of the vertices, but the mesh topology
remains unchanged. The relaxation of a given vertex
only requires information about its immediate
neighbours. In figures 11 and 12 you can see the
deformation obtained at the end of the fusion
process.
3 RESULTS
To check the results, we must conduct a
comprehensive study comparing the error between
the deformed foot and foot on platform real. In the
first phase of the project we scanned sixteen
women's feet with Europe size 37, considered a
common size.
Figure 10: Example of different feet scanned. From left to
right: foot 1, foot 2.
After obtaining the data (Figure 10), they are
filtered and processed with the deformation
algorithm. The following figures show the results of
these deformations (Figures 11 and 12) with
A NEW PARALLELIZABLE DEFORMATION METHOD - Automatic Comparision between Foot and Last
367
platform of 4, 25, 35, and 75 mm, used to lift the
foot.
Platform 4 Platform 25
Platform 35 Platform 75
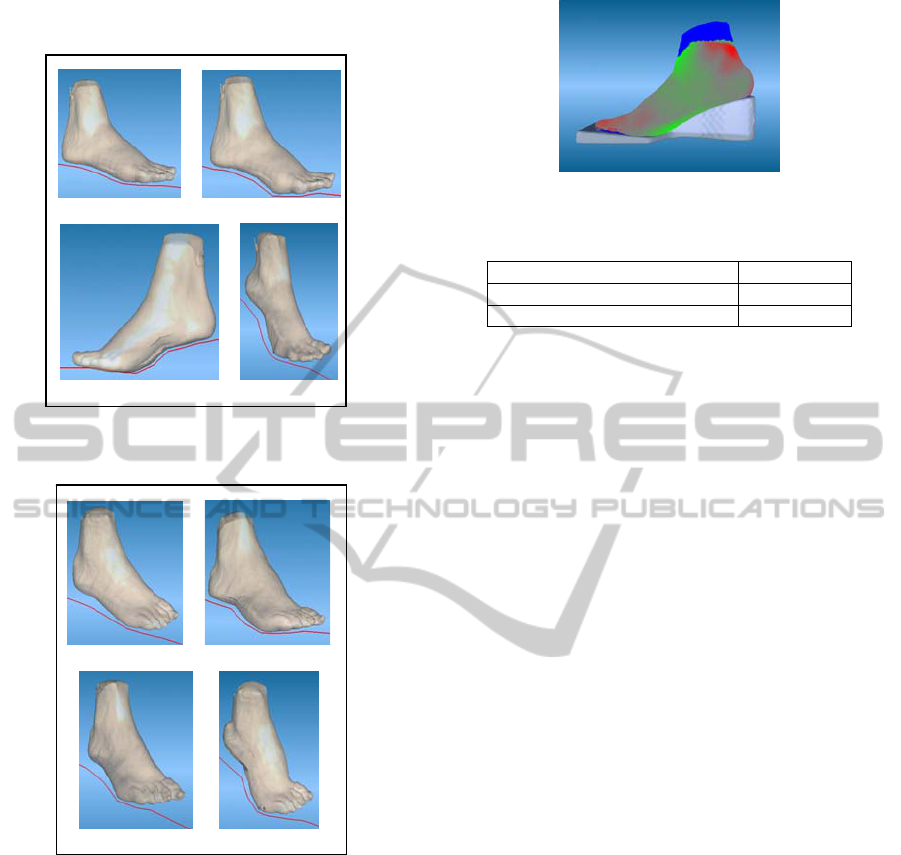
Figura 11: Deformation and inclined platform adjustment
of the foot 1 in Figure 10. The deformation line is the red
line.
Platform 4 Platform 25
Platform 35 Platform 75
Figure 12: Deformation and inclined platform adjustment
of the foot 2 in Figure 10. The deformation line is the red
line.
To estimate the error, the algorithm calculates
the intersection of the normal of each polygon of the
deformed model with each polygon of the real
model, so that it generates a colour map. In Figure
13 you can see the map. Green means it is above the
actual model, the red that it is below the actual
model and finally the gray coincides with the model.
We realize a comparison of the deformed foot
with the real foot on the same rise. We obtained the
average error for each area (toes, instep and heel).
The data obtained are shown in Table 1.
The error numbers can seem highs because of the
process of scanning the foot on the platform. Some
Figure 13: Colour map of the deformed foot.
Table 1: Error obtained.
Maximum average error 5.45 mm.
Minimum average error 0,93 mm.
Total average error 2,45 mm.
people put the foot obliquely on the platform,
because the foot wasn’t fixed to the platform. This
causes that the toes protrude from the model on the
outer part and the heel on the inside part.
Footwear experts did a visual supervision of the
results. They concluded that the result is more
precise than initially estimated.
4 CONCLUSIONS AND FUTURE
WORK
We have achieved virtual deformation of a
consumer’s foot and adapt it to a previously selected
platform. In this way we will be able to determine
the shoe that best fits to this foot.
With the final goal in mind of a global process of
adaptation of the shoes to the feet of the customer,
the speed of the process is essential. For this reason,
we adopt in this simulation a deformation model
based on geometry rather than based on physics. We
sacrifice realism for speed and efficiency. A client
can not wait long time to find out what type of shoe
is best suited to his/her feet.
In this paper we present a system with low
computational cost and a low error rate. The error
rate has been supervised by experts in the design of
footwear and has considered it acceptable. The
control points needed to perform the deformation are
detected automatically. It has been created a pleasant
user interface easy to use. So this paper can be seen
as an important basis for future improvements of a
global process, in order to obtain a better fit of the
footwear to the foot of the customer.
As we have seen the tests have been satisfactory,
as well as we have seen the system is easily
parallelizable. Therefore, an immediate future work
will be to parallelize on GPU the deformation
process, so it could be implanted in the footwear
ICPRAM 2012 - International Conference on Pattern Recognition Applications and Methods
368

industry. Moreover will be performed a more
comprehensive study of the error and is expected to
evolve the deformation to make it more realistic in
the critical points.
ACKNOWLEDGEMENTS
We thank the reviewers for their constructive
feedback. This work is subsidized by the national
project DPI2009-14738-C02-01 of the MICIIN
Spanish Government coordinated by INESCOP
(Asoc. investigación industrias del calzado y
conexas) and developed in collaboration with UIB.
REFERENCES
Arampatzis, A., Bruggemann, G. P., Klapsing, G. M.,
2002. A three-dimensional shank-foot model to
determine the foot motion during landings. Med Sci
Sports Exerc, 34(1): pp. 130-138.
Carson, M. C., Harrington, M. E., Thompson, N.,
O’Conor, J. J., Theologis, N., 2001. Kinematic
analysis of a multi-segment foot model for research
and clinical applications: a repeatability analysis. J
Biomech, 34(10): pp. 1299-1307.
Cheng, F. T., Perng, D. B., 1999. A Systematic Approach
for Developing a Foot Size Information System for
Shoe Last Design. International Journal of Industrial
Ergonomics, Vol. 25, pp. 171-183.
Houston V L, Luo G, Mason C P, Mussman M, Garbarini
M, Beattie A C., 2006. Changes in Male Foot Shape
and Size with Weightbearing. Journal of the American
Podiatric Medical Association, 96(4): pp. 330.343.
Kavan, L., Žára, J., 2003. Real time skin deformation with
bones blending. In WSCG short papers proceedings.
Plzen, Czech Republic.
Kim, S. Y., Lee, K., Hwang, T., 2002. A Grouping
Algorithm for Custom-tailored Products. Journal of
Materials Processing Technology, pp. 618-625.
Kos, L., Duhovnik, J., 2002. A system for footwear fitting
analysis. In Proc. International Design Conference –
Design. Dubrovnik, Croacia, pp. 1187-1192.
Leng, J., Du, R., 2005. A deformation method for shoe last
customization. Computer-Aided Design and
Applications, Vol. 2, Nos. 1-4, pp. 11-18.
Li, G., Joneja, A., 2004. A Morphing-Based Surface
Blending Operator for Footwear CAD. In Proceedings
of the 2004 International Mechanical Engineering
Congress and Exposition.
Lowe, J., 1927. Method and means for visually
determining the fit of footwear, U.S.Pantent
Publication. Washington DC. Publication No. US
1614988 A. Application No. US 275310 A.
Luximon, A., Goonetilleke, R. S., 2004. Foot shape
modeling. Hum Factors, 46(2): pp. 304-315.
Luximon, A., Goonetilleke, R. S., Tsui, K. L., 2003. Foot
landmarking for footwear customization. Ergonomics,
46(4): p. 364-83.
Luximon, A., Goonetilleke, R. S., Tsui, K. L., 2003b, A 3-
D Methodology to Quantify Footwear Fit. The
customer centric enterprise–advances in customization
and personalization, 2003: pp. 491–499.
Luximon, A., Goonetilleke, R. S., Tsui, K. L., 2005. Foot
landmarking for footwear customization. Computer-
Aided Design and Applications, 2005. 2(1): p. 11-18.
Luximon, A., Goonetilleke, R. S., Zhang, M., 2005. 3D
foot shape generation from 2D information.
Ergonomics, 48(6): p. 625-41.
Mochimaru, M., Kouchi, M., and Dohi, M., 2000.
Analysis of 3-D human foot forms using the free form
deformation method and its application in grading
shoe lasts. Ergonomics
, vol. 43, No. 9, pp. 1301--
1313.
Telfer, S., Woodburn, J., 2010. The use of 3D surface
scanning for the measurement and assessment of the
human foot. Journal of Foot and Ankle Research,
3:19.
A NEW PARALLELIZABLE DEFORMATION METHOD - Automatic Comparision between Foot and Last
369
