
A COMPUTATIONAL FRAMEWORK FOR NEXT-GENERATION
BRIDGE IMAGING AND INSPECTION
David Lattanzi and Greg Miller
Dept. of Civ. and Env. Engr., University of Washington, Box 352700, Seattle, WA, U.S.A.
Keywords:
Infrastructure, Damage Detection, Computer Vision, Image Visualization, Robotics.
Abstract:
A modern framework for bridge monitoring is proposed. It is intended to, in effect, bring bridges virtually
into engineers’ offices, enabling computer-assisted inspection using visual/spatial navigation and interaction,
augmented with computer vision recognition and analysis techniques developed for flaw and damage detec-
tion. The technical challenges to be addressed include developing a robotic front-end image capture approach
for optimum compatibility with the bridge inspection process, building scalable back-end visualization algo-
rithms, implementing a computer vision system capable of robust field inspection, and leveraging the contex-
tualized image data to improve decision making tools for bridge maintenance.
1 INTRODUCTION
Bridges represent a critical component of infrastruc-
ture systems, and therefore condition monitoring via
periodic inspection has long been a key part of bridge
operations and maintenance practice. Current bridge
inspection technology typically requires an inspec-
tion team and support equipment to travel to a given
bridge to make a series of qualitative observations.
Thus, there are a number of personnel, equipment,
and travel costs inherent in this approach that scale
linearly with the number of bridges needing inspec-
tion, the frequency of inspection, the distance be-
tween bridges, and the life of the bridges. There are
more than 576,000 bridges in the US alone, most all
of which must be inspected every two years, and so
hundreds of millions of dollars per year are spent on
inspections. There are also substantial indirect costs
associated with required lane closures and related
traffic disruptions. Making bridge inspection less
costly, less obtrusive, more quantitative, and more ef-
fective in regards to the type and quality of data col-
lected thus can lead to significant economic savings
and safety improvements. This includes reductions in
both the direct and indirect costs of the inspections
themselves, the avoidance of unnecessary repairs, the
timely implementation of needed repairs, and the op-
portunity for improved engineering that comes from
improved understanding of field performance of de-
signs over time.
During a structural inspection, inspectors capture
local measurements and close-up images of critical
bridge components and damage. However, these pho-
tographs and measurements are notoriously difficult
to comprehend by anyone other than the inspection
team themselves, as they are captured and organized
in such a way that they are decontextualized. The im-
ages are also presented in a qualitative manner, with
no standard methods in place to objectively analyze
them. An inspection report which, includes the de-
contextualized data, is passed to an engineer who is
responsible for assessing deterioration to the struc-
ture, considering the temporal context of the inspec-
tion information. The engineer then passes an as-
sessment to managers charged with high-level pol-
icy decisions concerning system-wide resource allo-
cations. In general, the movement of data up through
this decision-making hierarchy results in huge losses
of potentially useful and critical information, and this
is equally true in regards to the the transfer of data
across time. Contrasting the effort and expense re-
quired to complete a typical bridge inspection with
the resulting outcome of passing up the chain a set of
coarse-grained, essentially qualitative assessments, it
is clear that the cost-to-information ratio is unfavor-
ably high.
2 RESEARCH PROGRAM
An alternative, complementary inspection approach is
725
Lattanzi D. and Miller G..
A COMPUTATIONAL FRAMEWORK FOR NEXT-GENERATION BRIDGE IMAGING AND INSPECTION.
DOI: 10.5220/0003859507250730
In Proceedings of the International Conference on Computer Graphics Theory and Applications (IVAPP-2012), pages 725-730
ISBN: 978-989-8565-02-0
Copyright
c
2012 SCITEPRESS (Science and Technology Publications, Lda.)
Multi-Resolution
Interface
Multi-Resolution
Interface
Multi-Resolution
Interface
High-Resolution
Observation
Mu
Mu
Mu
lt
lt
i-Reso
Managers
Engineers
GBs of Data
Bytes of Data
Inspectors
GB
Inspectors
Engineers
By
By
By
Managers
Contextualized
Data
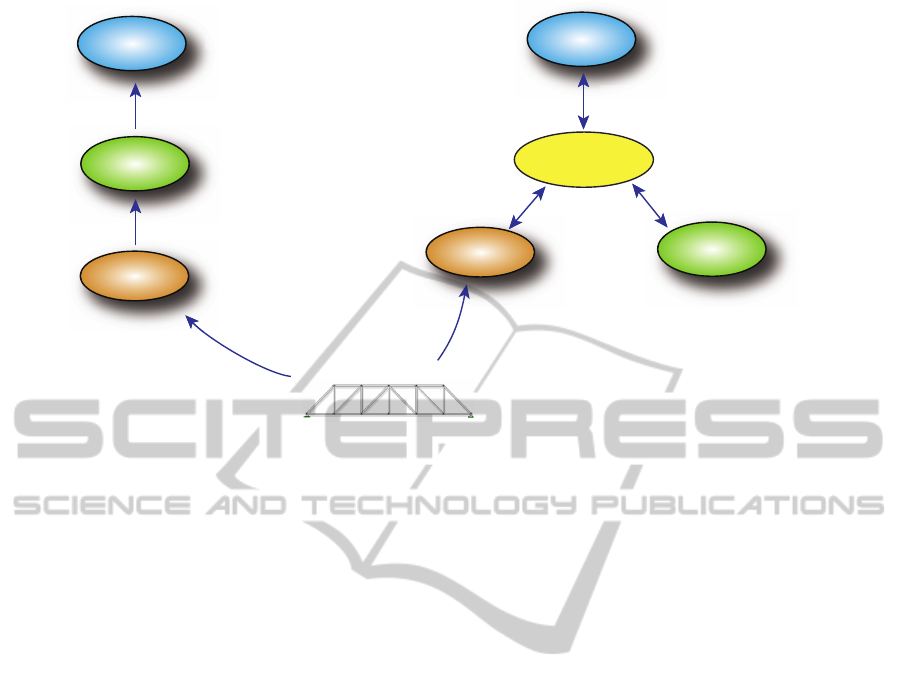
Figure 1: Current (left) and proposed (right) methods of information transfer.
to is to use modern imaging methods that in principle
can deliver image data from anywhere (and thus ev-
erywhere) on a structure. Computer vision and visual-
ization methods can supplement the traditional qual-
itative visual inspection process, increase the effec-
tiveness of embedded sensor systems, and, coupled
with robotic inspection platforms, enable an entirely
new level of consistency, efficiency, and safety via full
automation. Visualization systems based on digital
imaging techniques can allow engineers and owners
to perform time-history analyses that span the decades
of a bridge’s in-service period. The key in all these
contexts is to have a framework for providing easily
catalogued and understood data at both the local and
global level.
The fundamental concept to address this high-
cost/low-value information problem can most easily
be understood via reference to Figure 1. This figure
contrasts the current linear/hierarchical, lossy infor-
mation flow with the proposed alternative based on
providing registered and catalogued centralized data
throughout the decision-making hierarchy. In addi-
tion to providing much greater access to information
at the decision-maker level, this approach also greatly
enhances the possibilities for inventory-wide analy-
sis and data mining. Of course, for such an approach
to be useful it must be possible to be able to interact
with the data at varying resolution levels and in dif-
ferent ways at different times, ranging from viewing
close-up detail images to performing inventory-wide
cost estimates for repair or replacement. The inher-
ently spatial nature of inspection and assessment data
also requires an organizational strategy that intuitively
represents localized information. Interactive 3D visu-
alization environments, which also serve as fully 3D
databases, can consider both the spatial and temporal
context of infrastructure assessments. Once combined
with rich user interfaces, a new model for data driven
infrastructure maintenance and management begins to
take shape.
It is useful to consider a future scenario in which
the envisioned technologies are fully realized. In
this scenario an engineer receives notice that new in-
spection data have been obtained from a particular
bridge (in the fully automated case, via a periodic
robotic traversal requiring no traffic disturbance, crew
travel/safety risk, or equipment rental). The engineer
brings up the data in the context of an interactive ge-
ometric model of the bridge and queries the system
to show all new indications of damage or deteriora-
tion since the previous inspection. Each indicated lo-
cation can then be zoomed in on and examined with
in-context, high-resolution images simulating the ex-
perience of viewing the structure in the field, but
with optional image enhancement highlighting dam-
age. A second query could then request an update
of all previously existing indications of damage or
deterioration, followed by zoomed-in animations of
the evolution of the damage over time. A third query
could request that a particular area of damage be com-
pared against a national database to compare rates of
growth relative to similar flaws in similar classes of
structures, which could further be used to extrapolate
growth rates. A fourth query could ask for correlation
between damage growth between inspections and em-
bedded sensor data indicating loading and other envi-
ronmental history during the period in question. In the
case of ambiguous or unclear visual data, additional
IVAPP 2012 - International Conference on Information Visualization Theory and Applications
726
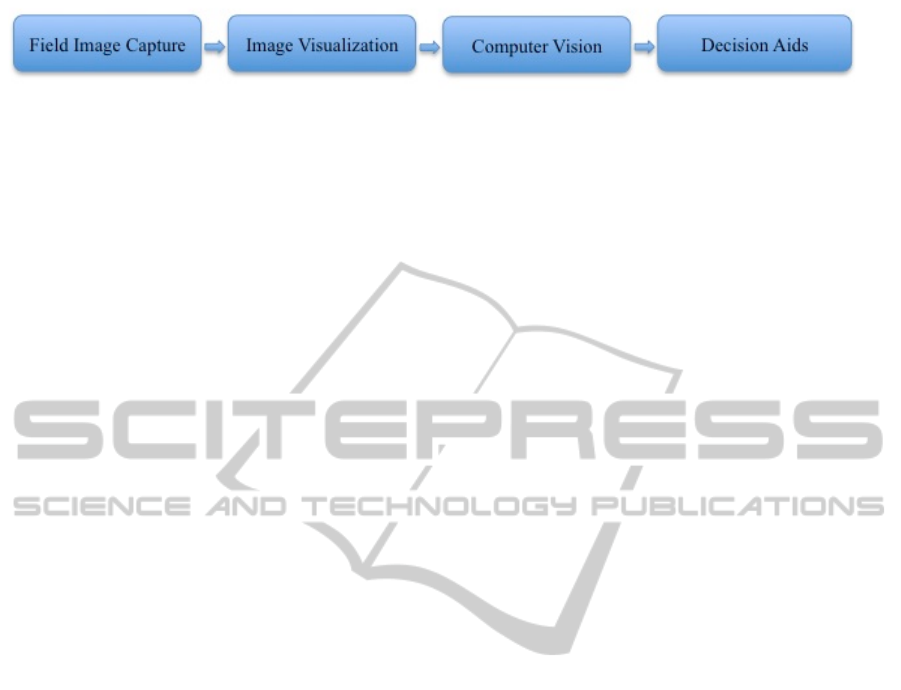
Figure 2: The proposed bridge inspection framework pipeline.
inspection could be requested using alternative sens-
ing modalities (e.g., ultrasound, infrared, etc.), and so
on.
3 METHODOLOGY
Figure 2 shows the key components of the cap-
ture/visualization pipeline that must be developed in
order to realize the proposed inspection framework.
The following subsections describe in further detail
the approaches to be used in addressing the techni-
cal challenges associated with each component of this
pipeline, and the anticipated outcomes.
3.1 Image Capture Methods
Upgrades to traditional methods of in-the-field image
capture (inspection teams with cameras) are being ex-
plored alongside the use of automated, robotics-based
capture. The challenge in the traditional case is to
develop a user input data-logging technique paired
with a combination of computer vision techniques to
extract location and orientation data from the cap-
tured images so they can be properly integrated into
an overall geometric context. For the complex ge-
ometries common in bridges, this is a challenging
task, especially when combined with the variability
in human-driven capture.
Similar geometric challenges arise in the case of
robotics-based image capture, but there are more op-
portunities for precise control and repeatability on the
capture front-end. By design, robotic devices can
track their position, camera orientations, and viewing
angles with high precision, allowing for precise data
logging and repeatable imaging, effectively skirting
the key difficulty of the inspector focused approach.
Furthermore, such mobile systems can quickly and
unobtrusively access structural elements that are diffi-
cult or impossible for human inspectors to view with-
out significant disruption to traffic and risk to the
safety of the inspectors. Combined with the funda-
mental advantages of automation, the robotics-based
approach is particularly compelling, but this raises the
question as to why it is not being used currently.
In looking at prior robotic bridge inspection work,
it can be seen that over the last decade researchers
have developed several chassis designed for bridge in-
spection (Choset, 2000; Huston et al., 2003). A com-
mon focus of this work has been on developing mech-
anisms for traversing arbitrary bridge geometries us-
ing approaches such as magnets, suction, and other
climbing technologies (Mazumdar and Asada, 2009).
These systems have been developed in an attempt to
create a “one size fits all” robot that can inspect al-
most any bridge type currently in service. In all but
one case, these have been proof-of-concept robotics
projects which have at no point actually carried a sen-
sor or vision package in actual field testing.
Our approach is to use a simple and inexpensive
mobile platform, with an emphasis on creating modu-
lar robotic systems designed for use on specific struc-
tural systems. Specializing to specific structure types
and applications yields significant time and cost sav-
ings over general mobile platforms designed to in-
spect any and all structure types. Even in more gen-
eral contexts the mechatronic systems required for a
specific application can be substantially simpler and
cheaper than a machine designed for a more general
set of criteria. This specificity allows for smaller in-
spection devices that can pass through smaller spaces,
inspect portions of structures that would be inaccessi-
ble to larger multi-purpose inspection equipment, and
more easily navigate the details of bridge structures.
Developing an inspection system around a series of
smaller, specific mobile machines could also eventu-
ally lead to a modular platform where various mecha-
tronic, sensing, and data processing packages would
be interchangeable based on the demands of a given
bridge inspection environment. Lastly, the use of sim-
pler robotic systems has a significant and positive im-
pact on manufacturing costs, and may mean the differ-
ence between the ubiquitous use of inspection robots
and their dismissal as impractical.
The robotic test platform enables the investiga-
tion of both visual and other modes of inspection
data not currently available through static sensor net-
works. The prototype robot, designed for use in labo-
ratory testing situations (Figure 3), contains a sensor
array that includes the digital imaging system, ther-
mal sensors, tilt sensors, and accelerometers. All of
these sensors are lightweight, low power, small, and
easily incorporated into the mobile robotics platform.
The combination of sensing paradigms affords an op-
portunity to explore the association between general
sensing and imaging data, and is lending significant
insight into our understanding of how visually ob-
A COMPUTATIONAL FRAMEWORK FOR NEXT-GENERATION BRIDGE IMAGING AND INSPECTION
727

servable damage correlates to local and global struc-
tural performance characteristics. For instance, an on-
board sensor package yields valuable environmental
information such as the ambient temperature at the
time of inspection or the concentration of chlorides
and other chemical detriments.
Digital Camera Module
3-DOF
Robotic
Arm
Chassis
Figure 3: Simple mobile platform concept for lab testing.
3.2 Image Visualization
The generation of massive amounts of image data is
not in itself a helpful exercise without some mecha-
nism for structuring and presenting the images in use-
able forms. The basic idea of presenting captured im-
ages in a natural 3D context has long been used in
medical, dental, and related health-care fields, gener-
ally leveraging the benefits of 3D imaging technolo-
gies. Similar to what one would want for bridge in-
spection, the goal has been to leverage trained human
observational skills with computer vision, image pro-
cessing, and visualization. This leads naturally to pre-
senting data in 3D contexts in such a way as to re-
produce an observational experience similar to direct
physical observation.
The basic task of associating captured images with
surface representations of 3D objects involves reg-
istration (assigning proper geometric location), mul-
tiple image merging/stitching, and texture mapping,
all of which are relatively mature technologies (see,
e.g. (Cox and Jesmanowicz, 1999) for registration
and (Chen and Klette, 1999) for stitching/merging).
Image registration and merging are aided by the de-
veloped data-logging methods in the human-led ap-
proach, and by the geometric accuracy and record-
keeping inherent in the robotic approach.
A naive approach to making a visualization sys-
tem for the inspection applications would be to sim-
ply use standard texture mapping to assign appropri-
ate images to each surface polygon of an underlying
3D bridge representation model. However, consider
for illustrative purposes a 24-foot-long W24×68 to be
covered with 1200×1200 pixel tiles (1.4 megapixel
images) corresponding to 3-inch square patches. A
simplified calculation based on computing the over-
all member surface area, estimating the number of
patches required by dividing by 9 square inches/patch,
converting the result to a number of pixels, and as-
suming 24-bit color with no compression leads to an
estimate of about 12GB of storage for direct tiling of a
single, simple member. Although this is a small frac-
tion of the data that a larger-scale system like Google
Earth must manage, it still easily exceeds the memory
capacity of typical video cards, and so this kind of di-
rect approach to interactive visualization is not scal-
able for bridge-scale modeling. (There are numerous
compression and selective resolution-reduction strate-
gies that can be used to reduce the overall storage de-
mands, but at visualization time, the rendering engine
must have access to actual texture data at a resolution
suitable for the current viewing parameters).
To address this kind of data-overload problem,
programs such as Google Earth uses a combina-
tion of technologies to provide interactive multi-
resolution navigation through extremely large image
sets. The fundamental building blocks consist of
multi-resolution pixel map textures (mipmaps), and
clever clipping algorithms (Tanner et al., 1998) allow-
ing for the interactive handling of huge data sets on
modest client hardware. Google uses its own propri-
etary implementations, but there are analogous strate-
gies available to build similar capabilities for the case
of bridges. The challenge in the context of bridges,
though, is that while the problem is more modest in
terms of size, it is much more difficult in terms of
the target geometry: the earth is ultimately a sphere,
while bridges have much more involved topology and
geometry.
3.3 Computer Vision
From a computer vision standpoint, the challenge is in
creating vision algorithms that are robust to the highly
varied imaging scenarios prevalent in field inspection.
Most computer vision systems developed for infras-
tructure damage detection are based on image capture
scenarios which are highly controlled against vari-
ances such as changes in lighting. Such controlled
systems are afforded the luxury of tuned filters for
providing accurate results. However, in-service struc-
tures exhibit a wide range of variances in lighting,
camera position, and structural surface appearance,
among many others (Figure 4). This issue is illus-
trated in Figure 5, which compares the Kappa score
accuracy of two basic computer vision systems.
IVAPP 2012 - International Conference on Information Visualization Theory and Applications
728
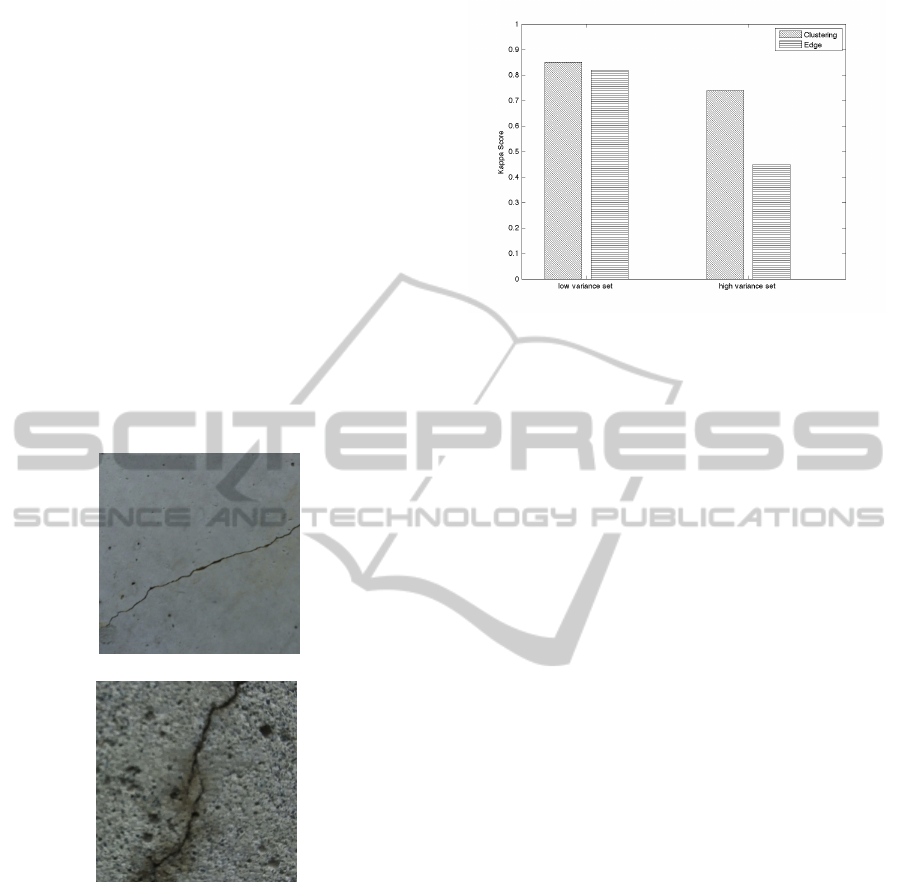
The two systems were developed and tested on im-
ages of cracking in structural concrete. One system
uses an edge detection segmentation technique com-
monly cited in damage detection literature(Abdel-
Qader et al., 2003; Hutchinson and Chen, 2006), a
method requiring significant amounts of filter tuning.
The other system uses a clustering technique which
requires almost no filter tuning. Both systems per-
form well if the image set is well-controlled with lit-
tle image variance. However, once the image set be-
comes more varied, the performance of both models
decreases. In the case of the edge based method, the
drop in performance is much larger. Essentially, the
inspection environment precludes the use of most tra-
ditional vision techniques and creates a demand for
robust vision systems that require a minimum of tun-
ing to function accurately considering a wide range of
field conditions.
(a)
(b)
Figure 4: Example of variance between field images.
3.4 Decision Making Aids
A powerful product of the contextualized visual-
ization and associated vision system is the provi-
sion of important data currently unavailable to engi-
neers(Zaurin and Catbas, 2010). By registering ob-
servational data spatially and chronologically, it be-
comes possible to quantitatively associate processed
image data with other inspection data such as damage
measurements and condition ratings. In the context
of pattern recognition methods, catalogued and pa-
rameterized image data significantly increases the ro-
bustness of any descriptor vector. The improved and
Figure 5: Kappa score comparison for models built using
low and high variance image sets.
expanded data set has the potential ability to predict
structural life spans based on developed learning al-
gorithms, either by extrapolating damage growth rates
from previously catalogued images of the damage, or
by statistical comparison with other known instances
in other structural models via pattern matching meth-
ods. Determining cost and risk indicators based on the
sum of all inspection data is, while almost impossible
for a human, a task well suited to computational in-
telligence techniques. Such quantitative indicators of
the severity of structural damage could significantly
alter the structural rehabilitation and replacement de-
cision process currently in place.
4 STATUS OF RESEARCH
Researchers at the University of Washington have de-
veloped a visualization environment for contextual-
ized viewing of inspection images and data which
utilizes a hierarchical database system to manage the
multitude of necessary images. Images are paramet-
rically mapped, calibrated, and stitched using a local-
ized feature detection approach. SURF feature detec-
tion and description(Bay et al., 2006), implemented
via openCV (Bradski, 2000), has proven to provide a
good blend of speed and accuracy for matching. The
matching and stitching algorithm is being tested for
robustness with inspection images.
The computer vision system (Section 3.3) has
been tested and validated. Using a variant of a k-
means clustering algorithm which takes into account
the inherent appearance of structural damage, a highly
accurate and robust recognition system has been im-
plemented within the framework. Preliminary results
show a marked improvement in robustness over cur-
rent practice.
Leveraging the accuracy, spatial context, and con-
A COMPUTATIONAL FRAMEWORK FOR NEXT-GENERATION BRIDGE IMAGING AND INSPECTION
729

venience of the extracted image data, current research
is directed at fusing image data with other inspection
information. As a pilot project, synchronized image
and sensor data from a series of seismic bridge pier
tests are being combined. Such a fusion could pro-
vide an effective post-earthquake assessment tool.
5 CONCLUSIONS
A modern framework for bridge inspection, one that
leverages computer vision and visualization tech-
niques, has been described in general terms. This
framework fundamentally changes the way that in-
spectors and engineers interact with inspection data,
providing a contextualized viewing environment that
allows for wide bandwidth transmission of inspec-
tion data well beyond what current strategies provide.
Furthermore, this contextualized system enables the
use of automated damage detection and analysis tech-
niques that are unavailable under current practice pro-
tocols.
Two image capture methods are currently being
explored: an inspector-driven approach and a simple
robotic approach. Of the two methods, the robotic
approach has the significant advantage of minimiz-
ing traffic disruptions due to inspection shutdowns.
Software challenges include the development of scal-
able texture map storage and display algorithms as
well as robust computer vision methods which can
accurately and consistently segment and parameterize
highly variable field images.
Once the system is implemented, the intent is to
explore how contextualized (both in space and time)
image data can expand pattern recognition and data
mining techniques for long-term bridge service life
prognostication and rehabilitation cost predictions.
REFERENCES
Abdel-Qader, I., Abudayyeh, O., and Kelly, M. (2003).
Analysis of edge-detection techniques for crack iden-
tification in bridges. Journal of Computing in Civil
Engineering, 17:255.
Bay, H., Tuytelaars, T., and Van Gool, L. (2006). Surf:
Speeded up robust features. In Leonardis, A., Bischof,
H., and Pinz, A., editors, Computer Vision ECCV
2006, volume 3951 of Lecture Notes in Computer Sci-
ence, pages 404–417. Springer.
Bradski, G. (2000). The OpenCV Library. Dr. Dobb’s Jour-
nal of Software Tools.
Chen, C.-Y. and Klette, R. (1999). Image stitching —
comparisons and new techniques. In Solina, F. and
Leonardis, A., editors, Computer Analysis of Images
and Patterns, volume 1689 of Lecture Notes in Com-
puter Science, pages 835–835. Springer.
Choset, H. (2000). Bridge inspection with serpentine
robots. Technical Report Final Report For Highway
IDEA Project 56, Transportation Research Board.
Cox, R. and Jesmanowicz, A. (1999). Real-time 3d image
registration for functional mri. Magnetic Resonance
in Medicine, 42(6):1014–1018.
Huston, D., Esser, B., Miller, J., and Wang, X. (2003).
Robotic and mobile sensor systems for structural
health monitoring. In Proceedings of the 4th Inter-
national Workshop on Structural Health Monitoring,
Stanford, CA, September, page 1517.
Hutchinson, T. C. and Chen, Z. Q. (2006). Improved image
analysis for evaluating concrete damage. Journal of
Computing in Civil Engineering, 20:210.
Mazumdar, A. and Asada, H. (2009). Mag-foot: A steel
bridge inspection robot. In IEEE/RSJ International
Conference on Intelligent Robots and Systems, 2009.
IROS 2009, pages 1691–1696.
Tanner, C. C., Migdal, C. J., and Jones, M. T. (1998). The
clipmap: a virtual mipmap. In SIGGRAPH ’98: Pro-
ceedings of the 25th annual conference on Computer
graphics and interactive techniques, pages 151–158,
New York, NY, USA. ACM.
Zaurin, R. and Catbas, F. (2010). Integration of computer
imaging and sensor data for structural health moni-
toring of bridges. Smart Materials and Structures,
19:015–019.
IVAPP 2012 - International Conference on Information Visualization Theory and Applications
730
