
LOCAL BLUR ASSESSMENT IN NATURAL IMAGES
Loreta Adriana Suta
1
, Mihaela Scuturici
2,3
, Serge Miguet
2,3
, Laure Tougne
2,3
and Mircea-Florin Vaida
1
1
Technical University of Cluj Napoca, 400114, Cluj Napoca, Romania
2
Université de Lyon, CNRS, Bron, France
3
Université Lyon 2, LIRIS, UMR5205, F-69676, Lyon, France
Keywords: Local Blur Detection, No-reference Blur Metric, Wavelet Analysis.
Abstract: This paper presents a local no-reference blur assessment method in natural macro-like images. The purpose
is to decide the blurriness of the object of interest. In our case, it represents the first step for a plant
recognition system. Blur detection works on small non-overlapping blocks using wavelet decomposition an
d
edge classification. At the block level the number of edges is less than on global images. A new set of rules
is obtained by a supervised decision tree algorithm trained on a manually labelled base of 1500 blurred/un-
blurred images. Our purpose is to achieve a qualitative decision of the blurriness/sharpness of the object o
f
interest making it the first step towards a segmentation process. Experimental results show this method
outperforms two other methods found in literature, even if applied on a block basis. Together with a pre-
segmentation step, the method allows to decide if the object of interest (leaf, flower) is sharp in order to
extract precise botanical key identification features (e. g. leaf border).
1 INTRODUCTION
Quality assessment in terms of digital images plays
an important role in various fields, such as image
indexing, segmentation, recognition, etc. Image
quality has received special interest during the last
two decades and a vast number of quality evaluation
indexes have been proposed. Based on the existence
of ground-truth images, these metrics may be
divided into two major classes: full-reference (FR)
and no-reference (NR). However, a third class has
been recently introduced that lies between the two,
namely reduced-reference (RR). This paper deals
with no-reference image quality assessment
designed for blur distortions in macro-like photos of
plants (leaves, flowers) taken in natural scenes. It
serves as the first step towards a pattern recognition
algorithm for plant identification.
One of the most encountered and disturbing
distortion is blur. Blur can affect the entire image, or
parts of it.
Macro mode allows the photographer to take
images from close-up. The focus is on capturing one
This work has been supported by the French National Agency for
Research with the reference ANR-10-CORD-005 (REVES
project).
object, which should be sharp, while the background
remains in blur. Users can shoot a plant image from
close-up in order to recognize its specie. Natural
macro-like images are a combination of edges,
texture details and flat regions, where the color
transitions are almost unnoticeable. This last aspect
limits the use of global quality indexes due to a false
estimation as blur. Figure 1 presents sample images
of leaves containing encountered drawbacks: the
object size, which can be small in comparison with
the blurred background (sometimes taking up to
50% – 70% of the image size) that will mislabel the
image as blurred, or, the background that may
contain the same objects as the one of interest.
Figure 1: Sample blurred images from our database.
The goal is to develop a fast algorithm that finds
whether the intended object is sharp or not.
Although there are various algorithms proposed for a
global quality assessment, one quality index
123
Suta L., Scuturici M., Miguet S., Tougne L. and Vaida M..
LOCAL BLUR ASSESSMENT IN NATURAL IMAGES.
DOI: 10.5220/0003854001230128
In Proceedings of the International Conference on Computer Vision Theory and Applications (VISAPP-2012), pages 123-128
ISBN: 978-989-8565-03-7
Copyright
c
2012 SCITEPRESS (Science and Technology Publications, Lda.)

estimated on the entire image is not enough to get a
reliable decision in this case.
In this paper we propose a localized blur
assessment algorithm for natural images inspired by
the previous work of (Tong et al., 2004). Our aim is
to detect the blurred regions that affect the object of
interest, in our case the plant.
The paper is organized as follows: Section 2
describes the existing algorithms for blur
assessment. Section 3 presents the proposed local
blur assessment in natural images. Experimental
results are shown in Section 4 followed by
conclusions and future work in Section 5.
2 RELATED WORK
Blur is a caused by an imperfect image formation
process. There are four types of blur: out-of-focus,
camera shake, object motion and atmospheric blur
(fog, rain, etc.). In this section, we restrained our
research towards objective no-reference blur metrics,
since we do not dispose of the reference image.
Objective no-reference blur detection methods
address two types of evaluation introducing global
and local metrics, respectively. Global assessment
reveals blur extent coefficients, blur classification
and restoration possibilities. However, methods
work successfully over landscape images, these
indexes have limitations when applied to macro-like
photos. Local metrics are often combined with the
pre-use of a global evaluation or a block division of
the original image. It is more intuitive, as avoids
mistakenly focusing on the blurry background.
Multiple approaches to blur detection are based
on edge detection (Tong et al., 2004), (Chen and
Bovik, 2011), (Narvekar and Karam, 2011)]. (Tong
et al., 2004) propose a blur detection scheme built on
the Haar wavelet transform and edge detection. The
algorithm is based on the estimation of edge
sharpness and the computation of the blur extent
based on a discrimination of sharp edges. The results
show a global assessment of blurred landscape
images. For macro-type images, the algorithm fails.
(Moorthy and Bovik, 2010) and (Chen and Bovik,
2011) investigate a blur metric using wavelets for
natural scenes. The first approach represents a blind
assessment based on a probabilistic support vector
machine (SVM) and a support vector regression
(SVR) in order to map the image statistics in one
global value. The second approach consists of three
steps. At first, the SVM is applied to get a coarse
quality assessment. It is followed by a multi-
resolution analysis to refine the blur metric and the
last step consists of the prediction of the blur metric.
In (Narvekar and Karam, 2011), a no-reference blur
metric method is described based on the human
perception and edge analysis. It is a probabilistic
method applied on each edge in an image arriving to
a global assessment of Gaussian and JPEG2000 blur
types, respectively.
The estimation of the blur kernel is commonly
used to detect and classify blurred images (Joshi et
al., 2008), (Hsu and Chen, 2008). Linear blur in
digital images is described using a “blur kernel” or
the point-spread-function (PSF). The drawback is
that linear blur does not include all blur types (e. g.
out-of-focus blur). In (Joshi et al., 2008), a blur
detection algorithm for spatially-varying blur
functions is presented, in particular the estimation of
point-spread function (PSF). The method handles
defocus blur, camera motion and intrinsic image
formation. The method is completely automatic and
scene-independent. (Hsu and Chen, 2008), propose a
blurred image detection and classification algorithm
based on the estimation of point spread function and
the use of support vector machine (SVM). The blur
extent is computed using the image gradient model.
Next, images are classified into globally or locally
blurred images using the point spread function.
Furthermore, globally blurred images are sorted into
camera shake or out-of-focus, while on locally
blurred images a segmentation algorithm is
performed to detect the blurred regions and classify
them into depth-of-field or moving object type,
respectively. The use of SVM increases
computational costs and complexity.
A region-based blur detection approach has been
conducted by (Lim et al., 2005). Images are divided
into non-overlapping blocks where local measures
are computed through image analysis. Based on the
figure-of-merits, the estimated parameters are
brightness, color, median sharpness, density of sharp
blocks and composition. The success rate is 90%,
while the algorithm produces 10% of false alarms.
Global detection works well over landscape
images where blur is usually linear. Complex blur
kernels are difficult to estimate using only global
quality metrics. Determining a probability of rather
sharp/blurry image is not enough to decide whether
the image may or may not be used in further
processing steps. Localization of blurred regions are
more adequate to solve problems related to objects
of interest, which will consist the input for
segmentation algorithms, feature extraction or
recognition. The low computational cost of the Haar
wavelet analysis suits the scope of implementation
on smartphones.
VISAPP 2012 - International Conference on Computer Vision Theory and Applications
124
3 METHODOLOGY
Multi-resolution analysis has been proven to provide
reliable results in blur assessment tasks. The spatial-
spectral properties may identify important changes
in the high-frequency coefficients that correspond to
the edges in the digital photo. According to (Tong et
al., 2004), there are four types of edges found in
digital images: Dirac-Structure, Roof-Structure
Astep-Structure and Gstep-Structure, respectively.
Previous work of Tong provides a direct method
for blur assessment without the description of the
blur kernel. The method shows good results for
landscape images. Applied to macro-like photos, it
reliably detects camera-shake blur or out-of-focus if
the entire image is affected. The drawback remains
for partially blurred images exhibiting object motion
blur or blurred background.
Out-of-focus blur introduces a separation
between two image planes, the background and the
foreground, leading to the following situations
where a global detection method is not reliable:
• The background is blurred and the
foreground is sharp. The size of the sharp
foreground may be too small with respect
to the size of the image.
• The foreground is blurred and the
background is sharp.
Another drawback of the existing global methods
appears when the size of the sharp foreground is too
big and presents uniform color zones. Figure 1
shows examples for the above mentioned cases.
3.1 Proposed Method
We propose a local blur detection technique using
three-level multi-resolution analysis designed for
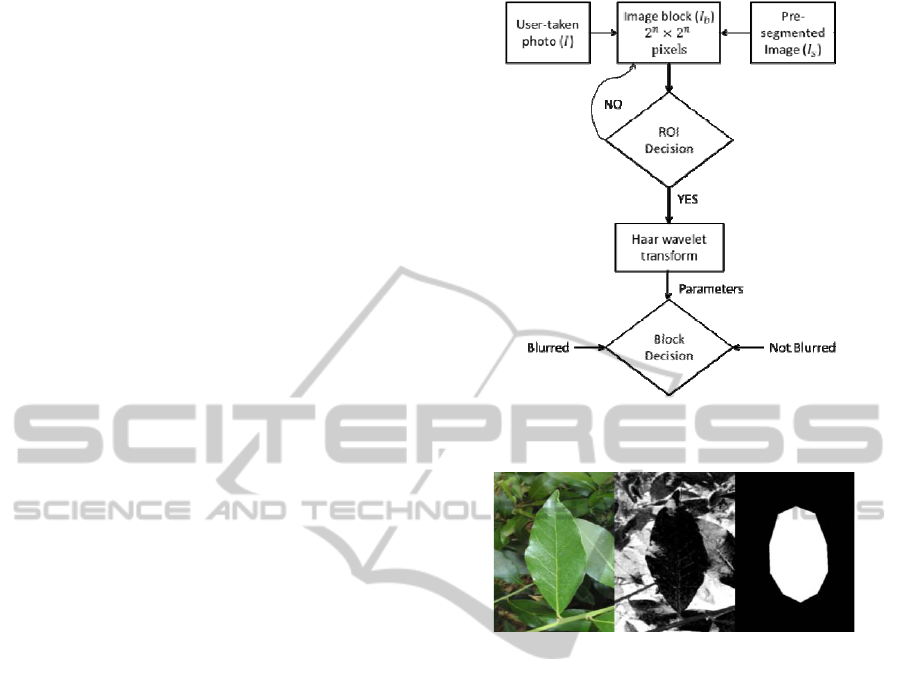
macro-like photos. Figure 2 presents the
computational block diagram for the proposed
method.
3.1.1 Block Selection
One user-taken plant image, , is divided into
smaller non-overlapping image blocks,
. The
choice of block dimension is an essential step as it
directly affects the accuracy. As the wavelet
decomposition is dyadic, the best adapted block size
is 2
.
The pre-segmented model,
, allows us to find
the approximate localization of the rough contour of
the object (Region of Interest, ROI). Its computation
uses a 2-component Gaussian mixture model and the
Mahalanobis distance, (Cerutti et al., 2011).
Figure 2: Computational block diagram for the proposed
method.
Figure 3: The distance map (left – original image, middle -
2-Gaussians color map, right – pre-segmented model).
Figure 3 illustrates the obtained distance map
based on which the appropriate pre-segmented
model is selected.
is divided into blocks with the same size as
previously applied on to have a perfect
correspondence between the two inputs.
The following operations are executed on
.
Firstly, a decision on the existence of an object
contour is computed. To avoid blocks with
ambiguous information, as containing only an
insignificant amount of the object, two thresholds
have been set over the total number of black and
white pixels respectively, found in the model block.
If the values are under the accepted thresholds,
is
rejected from further processing steps.
3.1.2 Local Blur Detection
Each valid block is decomposed by the wavelet
transform, resulting in three sets of detail
coefficients on every decomposition level.
Edge type detection and analysis is performed as
in (Tong et al., 2004), obtaining the statistical
parameters for each edge type. The obtained detail
LOCAL BLUR ASSESSMENT IN NATURAL IMAGES
125
coefficients are used to calculate the energy map as
in (1):
,
,1,2,3 (1)
where dc suggests the detail coefficients for each
decomposition level given by i.
Based on (1) and using the table given in (Tong
et al., 2004), we can identify and compute the total
number for each of the four edge types.
Contrary to the method of Tong, the decision
thresholds are completely omitted due to the low
edge information and uniform color regions in
macro photos. We computed a new set of decision
rules with supervised learning method using a
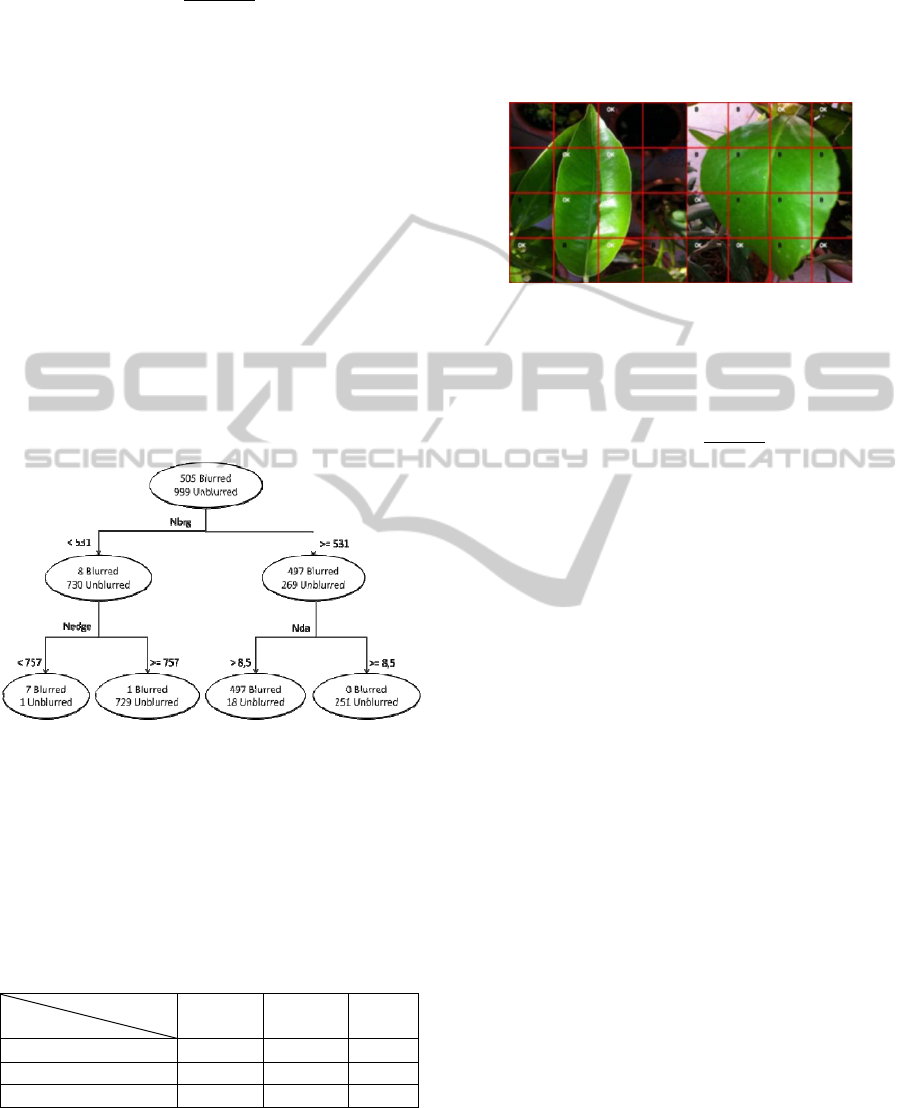
decision-tree based on the C4.5 algorithm. 1504
block images have been manually labeled into two
categories, as follows: “blurred” and “unblurred”.
Together with the color features, these were
involved in the training of the decision tree. The
most relevant decision rules for
, obtained using
the method C4.5, are presented in Figure 4.
Figure 4: Decision tree presenting the set of rules.
where Nedge represents the total number of edges,
Nda is the number of Dirac and A-Step classified
edges, and Nbrg describes the number of blurred
Roof-Step and G-Step edges.
The error rate in cross-validation is 0.01.
Table 1 shows the confusion matrix in cross-
validation.
Table 1: Confusion matrix on trained data set.
Groundtruth
Decision
Blurred Sharp Total
Blurred 495 10 505
Sharp 5 994 999
Total 500 1004 1504
The rules given by the supervised learning
have been involved in the threshold and decision
step. Based on the set of rules,
is labeled as
blurred or not blurred, respectively. Figure 5 shows
the block separation and labelling as “B” for blurred
and “OK” for un-blurred image blocks. Two macro
images were analysed exhibiting sharp and blurred
foreground, respectively, where global metrics give
“blurred” decision.
Figure 5: Blurred blocks labeling based on the set of rules
(left – sharp foreground; right – blurred foreground).
We can compute a global blur metric based on
the existent number of blurred blocks given by (2).
(2)
where
represents the number of blurred
blocks and
represents the total number of
blocks of the image.
4 EXPERIMENTAL RESULTS
Tests were performed on two databases: LIVE
database (174 images), (Sheikh, Wang, Cormack,
and Bovik), and our ReVeS databases (94 images).
ReVeS images consist of a collection of
unprofessional user-taken photos using a smartphone
camera. Each photo represents one or more parts of
a plant in its natural habitat. 1504 non-overlapping
block images were manually labeled into two
categories: blurred and non-blurred.
On the previously described databases we
performed our method and the objective evaluation
using the cumulative probability blur detection,
CPBD (Narvekar and Karam, 2011), and blind
image quality index, BIQI (Moorthy and Bovik,
2010). These methods offer global metrics. For
comparison, we computed the global blur parameter
for each photo given by (2).
Table 2 presents test results obtained on the
analyzed databases for each algorithm. The last
column in Table 2 presents the Spearman rank order
correlation coefficient (SROCC) between the blur
coefficient of the CPBD algorithm and our blur
coefficient. We can observe a moderately strong
positive correlation of 0.74 between our results and
VISAPP 2012 - International Conference on Computer Vision Theory and Applications
126
the CPBD for the test performed on entire images.
On the contrary, tests conducted over ReVeS
database show a negative correlation which is
explained by a high quantity of images with out-of-
focus blur (small sharp object surrounded by a
blurred background) or images containing motion
blur which is not detected by the CPBD algorithm.
Table 2 : Test results on different databases.
DB DB size Algorithm SROCC
LIVE 174 CPBD 0.74
LIVE 174 BIQI 0.87
ReVeS 94 CPBD -0.85
ReVeS 94 BIQI 0.73
Figure 6: ReVeS database images (left – Out-of-focus
blur; right – camera-shake blur).
Figure 6 highlights common problems
encountered in macro-like images taken by users
with smartphone cameras. There are two frequent
blur types that degrades the image quality, out-of-
focus blur affecting the object of interest and
camera-shake blur, respectively. An objective
evaluation using the CPBD metric predicts rather
sharpness on both images. The computed values are
0.85 and 0.77, where the maximum of 1.00 stands
for “sharp image”. However, our proposed method
successfully detects the degradations with a blur
estimation of 0.99 and 0.98, where the maximum of
1.00 designs a “blurred image”.
The local assessment has been performed on
non-overlapping image blocks. The images from
ReVeS database have been divided into blocks as
described in the previous section and stored as JPG
images with the size of 2
2
. Tests revealed that
in order to be able to identify all four edge types on
the three decomposition levels, the minimum block
size must be 2
2
. Table 3 shows the influence of
size on the edge detection.
Table 3: Influence of block size on edge detection.
Block Size Detected Edge Types
1616 No edges
3232 Non-discernible edge types
6464 Ambiguous parameters
128128 OK
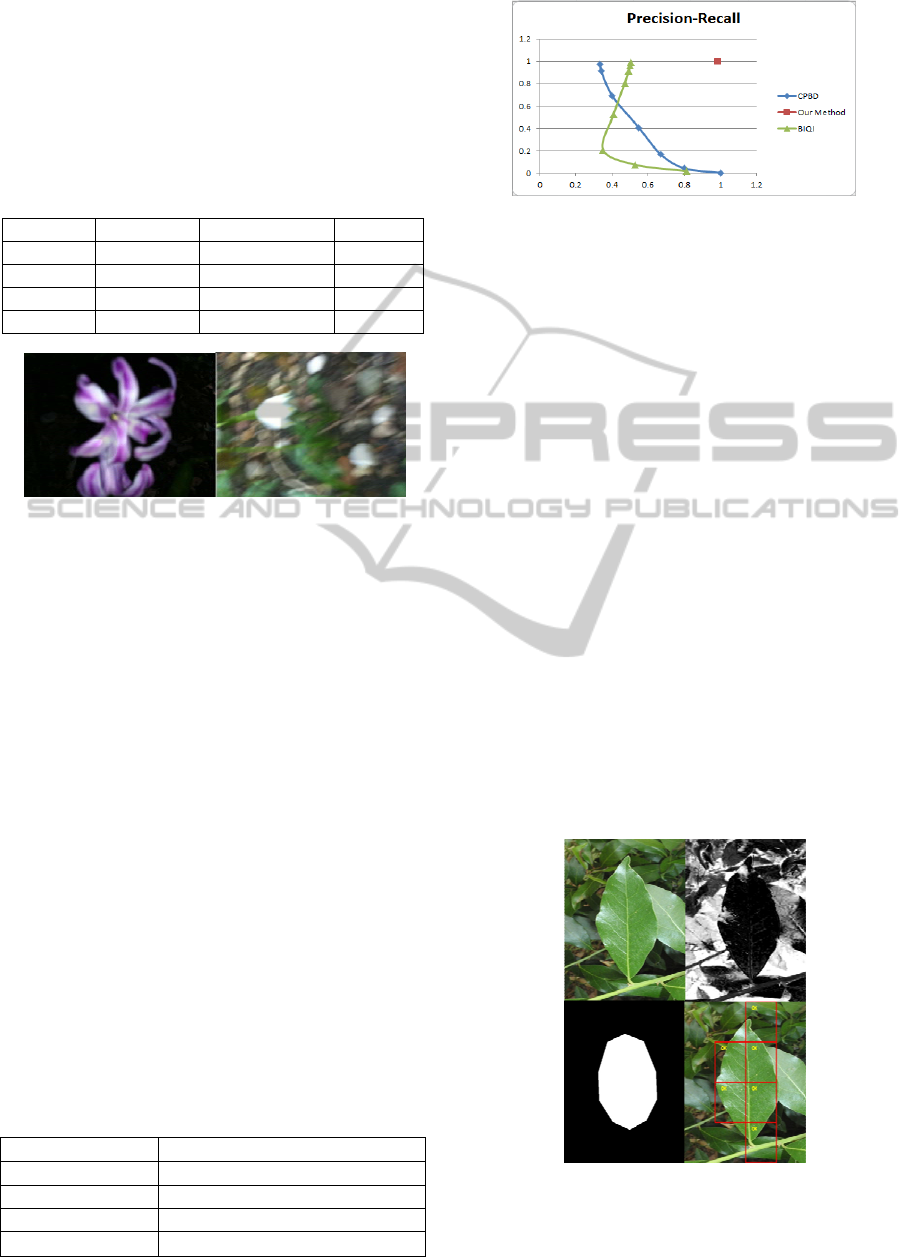
Figure 7: Graphical representation of precision-recall over
the manually labeled image blocks from ReVeS database.
Figure 7 presents the precision and recall (ROC
curve) for the three algorithms applied on the image
blocks generated from the ReVeS database. The red
point represents the precision/recall of our
algorithm. The result of our algorithm is a
qualitative decision (blurred/unblurred) given by the
decision tree presented in Figure 4. For the two other
methods, in order to compare them with our method,
we vary the threshold allowing a decision as
blurred/unblurred according to the coefficients
calculated in their algorithms – in order to take the
best value for this threshold. We vary the threshold
by a 0.1 step. The ideal point in the ROC curve is
(1,1): precision = 1 and recall = 1. Our algorithm
gives the best results (0.984, 0.998), even for the
best threshold values for each of the CPBD and
BIQI algorithms.
As our interest is the contour of a shape, we use
the pre-segmented model to find the approximate
region of analysis. Figure 8 illustrates results
obtained by our method. Note that missing blocks
over the leaf object are due to the thresholds
imposed on the pre-segmented model for the amount
of black and white pixels distribution.
Figure 8: Test result using the proposed method (first row
from left to right – original image and the distance map;
second row from left to right – pre-segmented model and
algorithm output).
LOCAL BLUR ASSESSMENT IN NATURAL IMAGES
127

5 CONCLUSIONS
In this paper we presented a no-reference local blur
assessment method for macro-like images. Contrary
to other blur detection methods, the proposed
algorithm can localize blurred regions over the
image and with the computed model, the estimation
can be done over the region of interest.
The proposed method uses wavelet analysis for
edge detection and classification. The obtained
parameters are adjusted by using a supervised
decision tree algorithm trained on a manually
labeled base of 1504 blurred/un-blurred images
According to the difficulty of achieving a
qualitative blur decision based on a single
quantitative value, the set of rules given by the
decision tree let us partition an image into blurred
and sharp regions while the pre-segmentation model
localizes the rough position of the object of interest.
The use of the pre-segmented model also reduces the
computational costs.
Future work includes studying the possibility of
a separation between foreground and background
using the proposed algorithm. The REVES project
had proposed to include the quality detection as a
first step of a complete processing chain. These first
results suggest that segmentation and quality
assessment should rather cooperate: the
segmentation can help blur detection, the blur
estimation process can also help the identification of
different planes in the scene.
ACKNOWLEDGEMENTS
This work has been supported by the French
National Agency for Research with the reference
ANR-10-CORD-005 (REVES project) and co-
financed from SIDOC - POSDRU/88/1.5/S/60078
project.
REFERENCES
Cerutti, G., Tougne, L., Vacavant, A., & Coquin, D.
(2011). A Parametric Active Polygon for Leaf
Segmentation and Shape Estimation. 7th International
Symposium on Visual Computing. Las Vegas.
Chen, M.-J., & Bovik, A. C. (2011, July). No-reference
image blur assessment using multiscale gradient.
EURASIP Journal on Image and Video Processing.
Hsu, P., & Chen, B. Y. (2008). Blurred image detection
and classification. Proceedings of the 14th
international conference on Advances in multimedia
modeling (pp. 277-286). Germany: Springer.
Joshi, N., Szeliski, R., & Kriegman, D. (2008). PSF
Estimation using Sharp Edge Prediction. IEEE
Conference on Computer Vision and Pattern
Recognition, (CVPR) , (pp. 1 - 8). USA.
Lim, S. H., Yen, J., & Wu, P. (2005). Detection of Out-of-
Focus Digital Photographs. HP Reasearch Lab,
Imaging System Laboratory.
Moorthy, A. K., & Bovik, A. C. (2010). A Two-Stage
Framework forBlind Image Quality Assessment. IEEE
International Conference on Image Processing, (pp.
2481 - 2484). China.
Narvekar, N. D., & Karam, L. J. (2011, September). A
No-Reference Image Blur Metric Based on the
Cumulative Probability of Blur Detection (CPBD).
IEEE Transactions on Image Processing, 20(9), 2678
- 2683 .
Sheikh, H. R., Wang, Z., Cormack, L., & Bovik, A. C.
(n.d.). LIVE Image Quality Assessment Database
Release 2. Retrieved from http://live.ece.utexas.edu
/research/quality
Tong, H., Li, M., Zhang, H., & Zhang, C. (2004). Blur
Detection for Digital Images Using Wavelet
Transform. IEEE International Conference on
Multimedia and Expo, 1, pp. 17-20.
VISAPP 2012 - International Conference on Computer Vision Theory and Applications
128
