
IMPLEMENTATION AND EVALUATION
OF A PHYSICAL ACTIVITY AND ENERGY EXPENDITURE
ALGORITHM IN A SENSIUM™-BASED BODY-WORN DEVICE
M. Hernandez-Silveira, S.-S. Ang, T. Mehta, B. Wang
and A. Burdett
Toumaz UK Ltd, Building 3, 115 Milton Park, OX14 4RZ, Abingdon, United Kingdom
Keywords: Activity energy expenditure, Accelerometer, Heart rate, Calibration.
Abstract: It is well known that sedentary life style lead to conditions such as obesity and diabetes. In recent years,
there has been increasing interest in devices capable of measuring activity energy expenditure (AEE) and
physical activity intensity (PAI) without disrupting the activities of daily living. In this paper we introduce a
portable and light-weight device based on our Sensium
TM
technology. Unlike existing commercially
available devices, the latter can measure both AEE and PAI in a real-time basis and convey the resultant
calculations wirelessly to a remote PC and/or sever. Such calculations are carried out by means of a
mathematical model, which combines heart rate and accelerometer information to produce PAI and AEE
estimations. The model was calibrated against a reference indirect calorimetry system. In particular,
simulated annealing was used to adjust the model parameters so as to allow a closer match between the
predicted and reference values. The resulting model was tested using a separate dataset with reference to
indirect calorimetry. The 95% prediction interval and the Spearman’s correlation coefficient (r) for PAI
were found to be [-0.1307, 0.171] kJ/kg/min and 0.903 (p<0.001) respectively. In addition, the results
revealed that there is agreement between Sensium
TM
and a similar reference (validated) device.
1 INTRODUCTION
Sedentary individuals are more susceptible to a wide
range of diseases. Different studies have made
associations between the lack of physical activity,
diabetes as well as obesity and heart conditions
(Marchand et al., 1997).
Consequently, there has been substantial interest
in affordable and portable devices to enable accurate
estimations of Physical Activity (PA) on a routine
basis. An example of such a device is the
Actiheart®. It comprises a portable, light-weight
device that measures activity energy expenditure
using a group-calibrated set of equations. This
mathematical approach is known as the Branch
Equation Model (Brage et al., 2004). It has been
validated against a number of well-established
techniques, including direct and indirect calorimetry
(Brage et al., 2005, Brage et al., 2004). The
Actiheart® is mounted on the chest region of the
subject, and data that is acquired from the subject is
stored locally. Unfortunately, the Actiheart® is a
data-logger that has to be removed from the subject
to download the data for analysis. This restricts the
possibility of continuous monitoring and feedback
by medical experts in real-time, which is desirable in
some clinical and sports contexts.
In contrast, the wireless device proposed here is
capable of processing the acquired data and
streaming it wirelessly in real-time to a base station.
Thus, the results can be relayed to a central server
that can be accessed by medical professionals, who
can potentially provide information to subjects to
allow changes to lifestyles at any time.
Therefore, the aim of this work was to adapt the
branched equation model to our system, and
evaluate its performance against two valid reference
devices – an indirect calorimetry system and the
Actiheart® when tested in normal individuals.
2 RELATED WORK
In 2004, Brage and colleagues developed and
evaluated a method (Branched Equation Model -
BEM) for measuring levels of PA and EE by
219
Silveira M., Ang S., Mehta T., Wang B. and Burdett A..
IMPLEMENTATION AND EVALUATION OF A PHYSICAL ACTIVITY AND ENERGY EXPENDITURE ALGORITHM IN A SENSIUM
TM
-BASED
BODY-WORN DEVICE.
DOI: 10.5220/0003786902190223
In Proceedings of the International Conference on Biomedical Electronics and Devices (BIODEVICES-2012), pages 219-223
ISBN: 978-989-8425-91-1
Copyright
c
2012 SCITEPRESS (Science and Technology Publications, Lda.)
combining accelerometry with HR monitoring,
demonstrating improved estimation of these
parameters when tested in 12 male normal subjects.
The approach relies on a set of rules, regression
equations and thresholds to estimate the PA or EE.
Thus, these parameters are estimated by means of the
selected piecewise function (i.e. one out of the four
available in the branched model) which best suit to the
level and intensity of the activity currently performed.
Later, the BEM approach was implemented in
the ActiHeart® (CamNTech, Cambridge, UK). This
device was shown to be reliable in estimating PA
intensity reliably in several studies (Brage et al.,
2005, Crouter et al., 2007), particularly for activities
such as walking and running. However, one
important drawback of this device is its inability to
transmit data in real time. The latter has a negative
impact on different aspects. First of all, the device
may need to be applied to and removed from the
patient several times until downloaded data reflects
the adequacy of electrode placement. Secondly, the
data logging capability is limited. For these reasons,
this device is neither an option for long-term follow-
up studies requiring several weeks or months; nor for
a final product intended for continuous real-time
feedback of physical activity and calorie expenditure.
3 SENSIUM PA-EE ESTIMATION
The approach adopted for PA-EE estimation can be
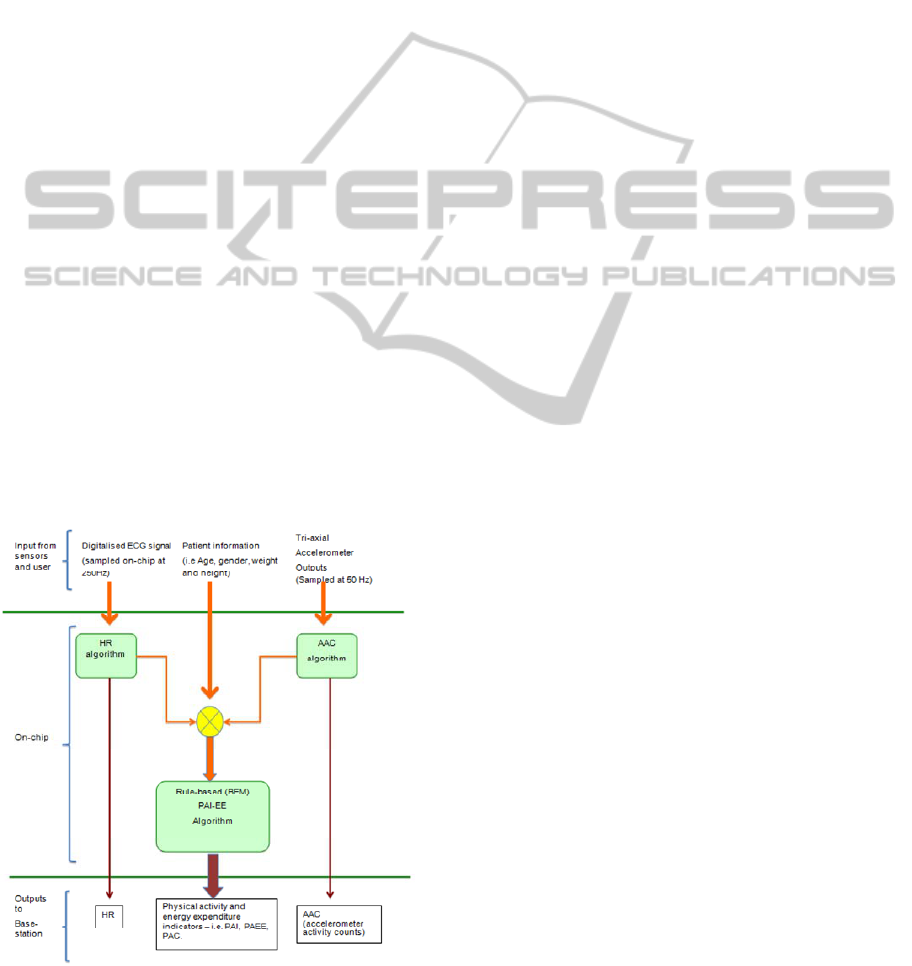
explained from Figure 1 as follows:
Figure 1: Block diagram of the Sensium™ PA-EE
algorithm.
Raw ECG and tri-axial accelerometer data are
collected by the Sensium
TM
body worn device at
sampling frequencies of 250 and 50 Hz respectively,
whereas patient information (i.e. age, gender, weight
and height) is manually entered by the user into the
system. The ECG and accelerometer data are fed to
the HR and AAC modules in fixed epoch durations
of 15 seconds.
The HR module was based on the Open Source
ECG Algorithm (OSEA) (Hamilton and Tompkins,
1986, Pan and Tompkins, 1985). The authors of
OSEA have reported high reliability and accuracy of
OSEA when tested using ECG data from the MIT-
BIH database. Nevertheless, a number of
modifications were necessary to adapt the algorithm
to the Sensium™. Firstly, the Sensium™ is
positioned at a non-standard position (lower chest
region, parallel to the Lead 1 position).
Subsequently, the threshold that is used in QRS peak
detection has been adjusted accordingly. Secondly,
extra rules have been included to reject signals
corrupted by motion artefacts. A preliminary
evaluation indicated that these changes did not affect
the efficacy of this algorithm. These results are
available on request to the authors.
The AAC algorithm is based on previous work
by Bouten and colleagues. Firstly, the signal is
filtered using a Butterworth fourth-order band-pass
filter (0.25-6Hz), designed for rejecting spurious
noise without distorting the information
corresponding to physical activities associated with
the intended user population. Of particular interest,
the upper limit of the filter bandwidth was chosen to
attenuate high frequency disturbances occurring
when the swinging foot impacts the ground during
walking at initial contact. This frequency band is in
the region of 15 Hz (Antonsson and Mann, 1985).
After filtering, the accelerometer data corresponding
to each axis is individually rectified and integrated
over 15 seconds to obtain AAC.
In the final stage of the algorithm, the HR and
AAC information are used to estimate the physical
activity intensity. As discussed above, such
estimation is possible by means of a rule-based
algorithm that relies on a set of pre-defined
thresholds, regression equations and weights,
expressing the existing relationship between the
duple HR/AAC and energy expenditure derived
from oxygen consumption (VO2).
BIODEVICES 2012 - International Conference on Biomedical Electronics and Devices
220

4 EXPERIMENTAL METHODS
AND CALIBRATION
To calibrate the BEM, and to assess the reliability of
this model, experiments were conducted to collect
two separate datasets. In both experiments, the
activities undertaken by the subjects include
stepping exercises, cycling on a stationary bicycle,
walking and running on a treadmill. These
experiments have been approved by the Toumaz
internal ethics committee.
In the calibration dataset, the accelerometer,
ECG and VO2 data were simultaneously collected
from 8 healthy participants (6 males and 2 females;
age 26.11 ± 11.45 years old; weight 72.01 ± 9.35
Kg; and height 157.72 ± 59.47 cm) using the
Sensium
TM
and a indirect calorimeter (CPX-express,
Medgraphics, USA). The indirect calorimeter
automatically converts the VO2 data into normalised
PAI units (cal/kg/min) using the widely accepted
Weir formulation (Weir, 1949).
The calibrated Sensium™ algorithm was tested
using a dataset collected from three systems:
Sensium
TM
, Actiheart®, and indirect calorimetry.
The experimental subjects involve 6 additional
healthy volunteers (1 female, 5 male), of weight
69.62 ± 11.25 Kg, height 174.95 ± 9.36 cm, and
26.67 ± 4.32 years old.
4.1 Calibration Process
In the calibration process, four piece-wise functions
together with a set of thresholds and coefficients are
required to determine PAI at low-moderate and
moderate-high intensities using the BEM approach.
These regression functions describe the relationships
between the PAI and HR, as well as between PAI
and AAC. Data from only treadmill activity was
used to obtain the equations, as treadmill exercise is
the best controlled part of the experiment.
First, the transition points between piece-wise
functions were selected by means of visual
inspection. Specifically, this was performed by
manually adjusting the value of the transition point
thresholds for both HR and AAC data; and then re-
running the regression procedure repeatedly to
generate the curves that best fit to the treadmill data.
The resultant HR-PAI polynomials for low-moderate
(PHL) and moderate-high PAI (PHH) are shown in
(1) and (2).
2
0376.02475.0 HsHsPHL +−=
(1)
2588.431364.1 +
=
HsPHH
(2)
‘Hs’ corresponds to the HR above sleeping, and it
was obtained by subtracting 10 bpm from the resting
heart rate (RHR), as shown in (3). This is consistent
with the procedure found in (CamNTech, 2009).
10−
=
RHRHs
(3)
Likewise, the AAC-PAI expressions for low-
moderate (PAL) and moderate-high (PAH) levels of
activity are found using (4) and (5).
AACPAL 167.0
=
(4)
9311294.811921572.0
2
0002832.0 +−= AACAACPAH (5)
Subsequently, the HR flex-points for low-moderate
and moderate-high activity levels were determined
by applying regression analysis over all the data
points collected from different types of exercises
except resting, since HR is not a reliable parameter
for estimation of EE at low activity levels (Andre
and Wolf, 2007). The heart rates (above sleeping)
corresponding to 3.5 and 5.5 METs were then
derived as initial HR flex-points. Likewise, the
initial AAC flex-point between moderate and high
levels of activity was found using regression,
involving only the cycling data. This made possible
the selection of a threshold value which was low
enough to reject the majority of noise, but
sufficiently high to account for the low ground-
impact of some strenuous activities such as cycling,
rowing and cross training.
The initial weights towards the AAC-PAI and
the HR-PAI relationships were chosen from (Brage
et al., 2004). Further refinement to the model is
carried out by Simulated Annealing (Bertsimas and
Tsitsiklis, 1993). Using this technique, the weights,
and threshold values were adjusted to minimize the
absolute error of the model. The optimized model is
shown in Figure 2.
Figure 2: Branch equation model after the application of
simulated annealing.
IMPLEMENTATION AND EVALUATION OF A PHYSICAL ACTIVITY AND ENERGY EXPENDITURE
ALGORITHM IN A SENSIUM™-BASED BODY-WORN DEVICE
221
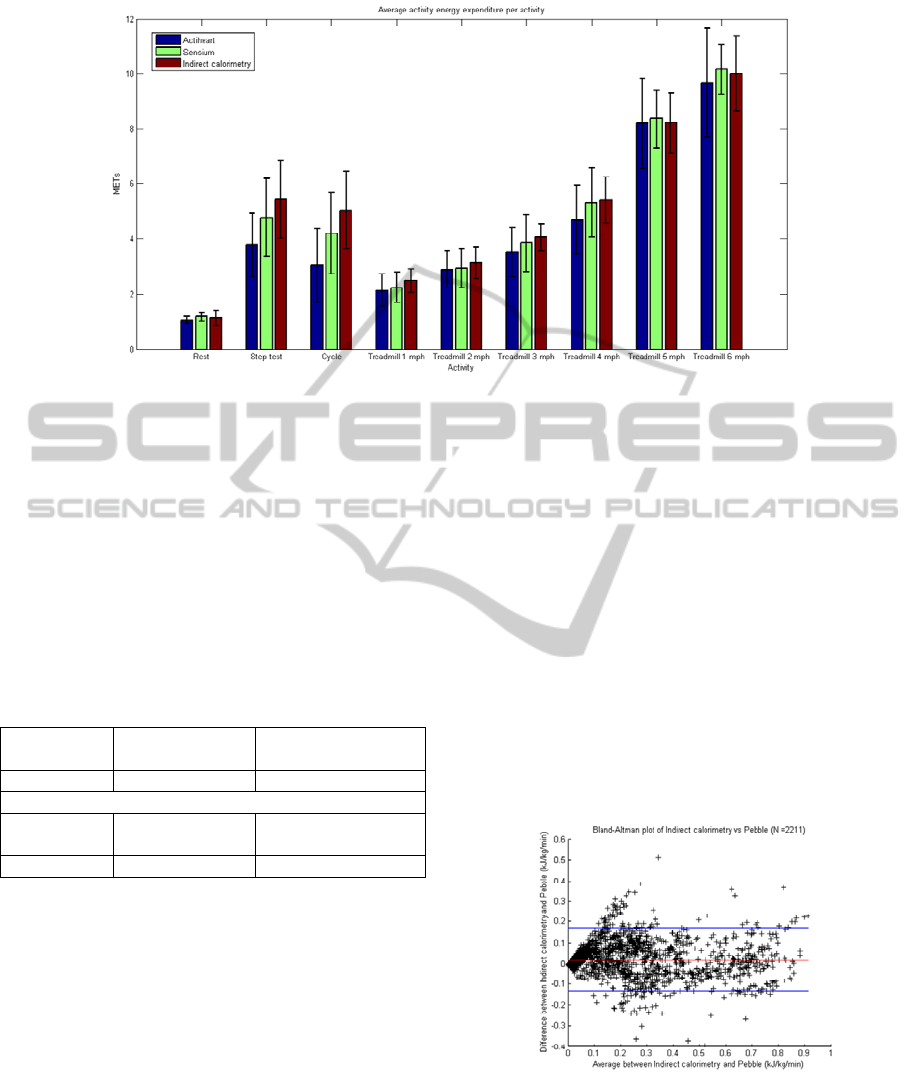
Figure 3: Activity energy expenditure results for different activity types, derived from Actiheart®, Sensium™, and indirect
calorimetry.
4.2 Discussion
Inferential statistics using ANOVA (Analysis of
Variance) was carried out on the experimental
datasets. Table 1 shows the results. These results
indicate that the differences between the Indirect
Calorimetry, Actiheart, and Sensium measurements
are statistically significant.
Table 1: ANOVA and t-test results from indirect
calorimetry, Sensium™, and the Actiheart®.
F-test
Mean sum of
squares
p-value
16.96 0.801 <0.001
t-test results from Sensium™ and Actiheart®
Degrees of
freedom
95% CI
(kJ/kg/min)
Difference of the
means (kJ/kg/min)
2209 [0.0170, 0.0234] 0.0202 (p<0.001)
The Bland-Altman plot corresponding to the
Sensium
TM
and indirect calorimetry (Figure 4)
reflects a bias and the 95% PI of 0.0179 kJ/kg/min
(0.26 MET) and [-0.134, 0.170] kJ/kg/min ([-1.922,
2.438] METs) respectively. These results indicate
that the differences for the Sensium
TM
and
Actiheart®, with reference to indirect calorimetry,
are similar. Also, by comparing the Actiheart® with
the indirect calorimeter, the 95% PI was found to be
[-0.170, 0.246] kJ/kg/min. This range is consistent
with the a previous study done by (Brage et al.,
2004). In addition, a two-tailed t-test was carried out
between the Actiheart® and Sensium™, in order to
confirm the similarity between these two devices.
The results of this test are summarised in Table 1,
and revealed statistically significant (although small)
differences.
Finally, the results from the second experiment
were grouped into different categories of activities,
as shown in Figure 3. From the chart, it can be
observed that the average activity expenditure for
the Sensium
TM
and Actiheart are similar for most of
the activities. For the step test and cycling activities,
the Sensium™ algorithm produced results closer to
indirect calorimetry than the Actiheart®. Overall,
the results from the Sensium
TM
were found to be
closer to the ones obtained from Indirect
Calorimetry system. This can be expected as the
Sensium
TM
algorithm was calibrated with data
obtained from this particular reference system.
Figure 4: Bland-Altman plot of indirect calorimetry vs
Sensium™.
5 CONCLUSIONS
This paper reported on the incorporation of an
BIODEVICES 2012 - International Conference on Biomedical Electronics and Devices
222

algorithm for estimation of physical activity
intensity and energy expenditure as part of a
wireless body-worn device. The algorithm was
calibrated for a Sensium
TM
device, embedded with a
triaxial accelerometer and ECG sensors.
The results for the evaluation of the algorithm
revealed that statistically significant differences
between indirect calorimetry, Actiheart, and the
Sensium™. However, these differences were small
and similar to those found in a separate study
(Crouter et al., 2007). In addition, it was found that
with reference to indirect calorimetry, the mean
error for the Sensium
TM
was lower for certain
activities, including the step test exercise and
cycling on a stationary bicycle.
In this work, the authors found that the use of
simulated annealing was successful in adapting the
Branch Equation Model to the Sensium™ platform,
indicating the generality of this model. Future work
include the use of automatic activity classification,
to reduce the errors caused by different activity
types. Another limitation of this investigation is the
limited scope of activities considered. Therefore,
future directions will consider the inclusion of
further and more representative activities of daily
living and exercise.
ACKNOWLEDGEMENTS
The authors will like to thank the volunteers who
took part in the experiments.
REFERENCES
Andre, D. & Wolf, D. (2007) Recent Advances in Free-
Living Physical Activity Monitoring: A Review. Journal
of Diabetes Science and Technology, 1, 760-767.
Antonsson, E. & Mann, R. (1985) The frequency content
of gait. Journal of Biomechanics, 18, 39-47.
Bertsimas, D. & Tsitsiklis, J. (1993) Simulated Annealing.
Statistics, 8, 10-15.
Brage, S., Brage, N., Franks, P. W., Ekelund, U. &
Wareham, N. J. (2005) Reliability and validity of the
combined heart rate and movement sensor Actiheart.
European Journal of Clinical Nutrition, 59, 561-570.
Brage, S., Brage, N., Franks, P. W., Ekelund, U., Wong,
M.-Y., Andersen, L. B., Froberg, K. & Wareham, N. J.
(2004) Branched equation model of simultaneous
accelerometry and heart rate monitoring improves
estimate of directly measured physical activity energy
expenditure. . Journal of Applied Physiology, 96, 343-
351.
CamNTech (2009) The Actiheart Guide to Getting Started.
Crouter, S., Churilla, J. & Bassett, D. (2007) Accuracy of
the Actiheart for the assessment of energy expenditure
in adults. European Journal of Clinical Nutrition, 1-8.
Hamilton, P. & Tompkins, W. (1986) Quantitative
investigation of QRS detection rules using the
MIT/BIH arrhythmia database. IEEE transactions on
biomedical engineering, 33, 1157-1165.
Marchand, L. L., Wilkens, L. R., Kolonel, L. N., Hankin,
J. H. & Lyu, L.-C. (1997) Associations of Sedentary
Lifestyle, Obesity, Smoking, Alcohol Use, and
Diabetes with the Risk of Colorectal Cancer. Cancer
Research, 57, 4787-4794.
Pan, J. & Tompkins, W. (1985) A real-time QRS detection
algorithm. IEEE transactions on biomedical
engineering, 32, 230-236.
Weir, J. (1949) New methods for calculating metabolic
rate with special reference to protein metabolism. .
Journal of Physiology, 109, 1-9.
IMPLEMENTATION AND EVALUATION OF A PHYSICAL ACTIVITY AND ENERGY EXPENDITURE
ALGORITHM IN A SENSIUM™-BASED BODY-WORN DEVICE
223
