
EEG/SEEG SIGNAL MODELLING USING FREQUENCY AND
FRACTAL ANALYSIS
Vairis Caune
1
, Juris Zagars
1
and Radu Ranta
2
1
Ventspils University College, Inzenieru iela 101a, LV-3601, Ventspils, Latvia
2
CRAN UMR 7039, Nancy Université - CNRS, Vandoeuvre les Nancy, France
Keywords:
EEG Modelling, Fractal Dimension, Frequency Analysis.
Abstract:
EEG (Electroencephalography) is used to measure the electrical activity of a human brain. It is widely used to
analyse both normal and pathological data, because of its very high temporal resolution. Different algorithms
were proposed in the literature for EEG signal processing, but a difficult issue is their validation on real
signals. An important goal is thus to realistically simulate EEG data. The starting point of this research was
the model proposed by Rankine et al. for the surface newborn EEG signal generation. The model, based on
both statistical, fractal and classical frequency modelling, has parameters estimated from the real data. A first
objective is to validate and parametrize this model on adult surface EEG. A second and more important goal
is to parametrize it and to apply it to depth EEG measurements (SEEG). The first results presented in this
communication show that the proposed model can be applied in both cases (surface and depth adult EEG),
although the parameters are slightly different. As expected, seizures cannot be modelled using this approach.
1 INTRODUCTION
Electroencephalography (EEG) is the most widely
used method to record electrical activity of the hu-
man brain. This data can be used to analyse the be-
haviour of the normal brain, as well as to diagnose
different pathologies, as for example epilepsy. Since
our knowledge about the generators of the electrical
activity in brain is still on a fairly basic level, most of
the signal processing algorithms developed for EEG
signals can be validated only by medical expertise. In
order to have reliable results, we need to use large
datasets for testing. Since EEG recording is time con-
suming and problematic (because of the high variabil-
ity of the signals), consistent large data sets are quite
difficult to obtain. Simulated realistic datasets would
help to build more consistent algorithms and test them
more properly.
Depth EEG (called further as SEEG – Stereoelec-
troencephalography) uses the same principle of elec-
trical activity recording like EEG, but electrodes are
surgically inserted into the brain. As expected, be-
cause of the invasiveness of the technique, SEEG data
is even less frequent than EEG data. Because of their
acquisition method, the SEEG signals supposedly di-
rectly record brain sources, while the surface EEG
is a mixture of source signals. Simulated signal can
be useful both for SEEG dedicated studies and for
forward/inverse problem applications: with a realis-
tic source modelling, one can expect more realistic
scalp EEG modelling. Moreover, in an inverse prob-
lem setup, simulated SEEG can be compared to the
one obtained by the source estimation algorithms and
thus used to validate them.
2 EEG MODELS
There are several different approaches to model and
simulate EEG signals, depending on the purpose of
their applications. The most popular of them are:
• Source modelling from EEG signals (inverse
problem, source separation)(Delorme et al., 2007)
• Biological neurocomputing(Robinson et al.,
2003; Wendling et al., 2005)
• EEG/SEEG modelling mimicking real signals
(Rankine et al., 2008)
Following (Rankine et al., 2008; Stevenson et al.,
2005), we focus in this paper on third approach. Sig-
nal imitation is made using real signal characteris-
tics. Datasets of real EEGs are analysed, in order to
obtain these characteristics. Depending on the model,
249
Caune V., Zagars J. and Ranta R..
EEG/SEEG SIGNAL MODELLING USING FREQUENCY AND FRACTAL ANALYSIS.
DOI: 10.5220/0003780302490253
In Proceedings of the International Conference on Bio-inspired Systems and Signal Processing (BIOSIGNALS-2012), pages 249-253
ISBN: 978-989-8425-89-8
Copyright
c
2012 SCITEPRESS (Science and Technology Publications, Lda.)

different supplementary assumptions are made, and
validation is performed against large real datasets.
Rankine et al. separate two models having differ-
ent characteristics: seizure model and background
model, aiming to characterize different new-born real
EEGs (Figs. 1 and 2). We focus here on the (Rank-
50 100 150 200 250
Real EEG
Time (samples)
Figure 1: Background EEG signal.
50 100 150 200 250
Real EEG
Time (samples)
Figure 2: Seizure EEG signal.
ine et al., 2008) background EEG model, our aim be-
ing to find if it can be applied on adult surface and
depth data. We will asses its validity for both back-
ground and seizure signals. The different steps of the
cited model and employed methodological tools, are
described in more detail in the next section.
2.1 Background EEG Modelling
According to (Rankine et al., 2008) and the references
cited therein, the power spectrum of a background
surface EEG approximately follows a power law:
S( f) ≈
c
|f|
γ
(1)
where c is constant, f is frequency and γ is the power
law exponent
1
. If one wants to generate a simulated
EEG signal x(t), the first step is to express S( f) as
X( f)X
∗
( f), with X( f ) being the amplitude spectrum
of x(t), obtained by the Fourier transform:
X( f) =
√
c
|f|
γ
2
e
jθ( f)
, (2)
where θ( f) is the phase of the Fourier transform. In
order to obtain a more realistic signal, (Rankine et al.,
2008) proposes to generate several X
i
( f) using differ-
ent phase vectors θ
i
( f). Several x
i
(t) can be obtained
by inverse Fourier transform from X
i
( f), and the final
simulated background EEG signal is generated as
x(t) =
∑
i
F
−1
(X
i
( f)) (3)
1
Since real EEGs are non-stationary, γ is considered
constant for every epoch of 4 seconds (assuming a quasi-
stationary signal during one epoch).
As it can be seen, this model needs three parameters:
c, γ and θ(f). The amplitude c is of secondary impor-
tance, so we will focus only on the last two param-
eters. In order to use realistic values, they must be
extracted from real data.
2.1.1 Parameter Estimation
The method used in (Rankine et al., 2008) to estimate
the power law exponent γ exploits the linear relation-
ship between γ and the fractal dimension FD of a sig-
nal (Wornell and Oppenheim, 1992), expressed by:
FD =
5−γ
2
(4)
This step is useful because the FD can be estimated
from the real EEGs using one of the fractal dimension
estimation methods. Different fractal dimension esti-
mators such as Box-counting, Information and Corre-
lation dimensions (Ott, 2000) can be used, with quite
similar results on classical fractals. Higuchi’s FD es-
timation (Higuchi, 1988) is a particular example of
fractal dimension derived from box-counting. This al-
gorithm works directly in the time domain (analysing
the geometrical form of signal), so it can be used for
relatively short signal lengths (recall that EEG’s are
assumed stationary on short time intervals).
As said previously, in order to simulate realistic
signals, the needed parameters (FD and θ( f)) must
respect real signals characteristics. As in (Rankine
et al., 2008), we have estimated them using the fol-
lowing procedure, applied to a database of real adult
background EEG/SEEG signals:
• compute the FD and the phase for each signal
• assume that, over the database, FD follows a beta
distribution and estimate the distribution param-
eters (method of moments (NIST/SEMATECH,
2011)). Probability density function of a beta dis-
tribution with two parameters, α and β can be ex-
pressed as
f(x;α,β) =
Γ(α+ β)
Γ(α)Γ(β)
x
α−1
(1−x)
β−1
, (5)
where x ∈ [0,1] and Γ(z) =
Z
∞
0
t
z−1
e
−t
dt is the Γ
function.
• assume that the phase θ follows a uniform distri-
bution in [−π,π]
• test (Kolmogorov-Smirnov) the empirical distri-
butions against theoretical distributions generated
using the previously estimated parameters.
BIOSIGNALS 2012 - International Conference on Bio-inspired Systems and Signal Processing
250
2.1.2 Signal Simulation
Assuming that estimated realistic probability distribu-
tions have been obtained for both the fractal dimen-
sions FD and for the phases θ( f), a realistic simu-
lated background EEG can be generated by randomly
choosing a value for FD and a phase vector θ( f) and
introducing them in (4),(2) and (3).
In order to validate the approach, (Rankine et al.,
2008) suggests to extract FD and θ( f) from a real
EEG measurements and to use the described method
to generate a synthetic signal: if the method is correct,
then the original signal and the simulated one should
be similar (correlated). The correlation index, noted
further on as ρ, can be computed in time domain (ρ
t
),
as well in frequency (after computing the Welch peri-
odogramm, ρ
f
) and in time-frequency (spectrograms
after short-time Fourier transforms, ρ
t f
).
3 RESULTS
The described model was applied to different classes
of EEG signals: surface and depth, background and
seizure. The database contained 400 signal fragments
from 3 different patients, 4 seconds each. Seizure pe-
riods were pointed out by neurologists beforehand.
Surface EEG signal was filtered with cut-off frequen-
cies at 0.5 and 30Hz whereas source SEEG signal was
filtered with low-pass filter at 128Hz (no assumptions
on SEEG signal spectral behaviour was made). Con-
sequently, surface EEG signals contained 256 sam-
ples and source SEEG signals contained 1024 sam-
ples for every 4 seconds window.
3.1 Adult Surface EEG
At first, the simulation method was applied to adult
surface EEG data. For generality, we tested the model
both to background and seizure EEG, downsampled
to 64Hz (as in (Rankine et al., 2008)).
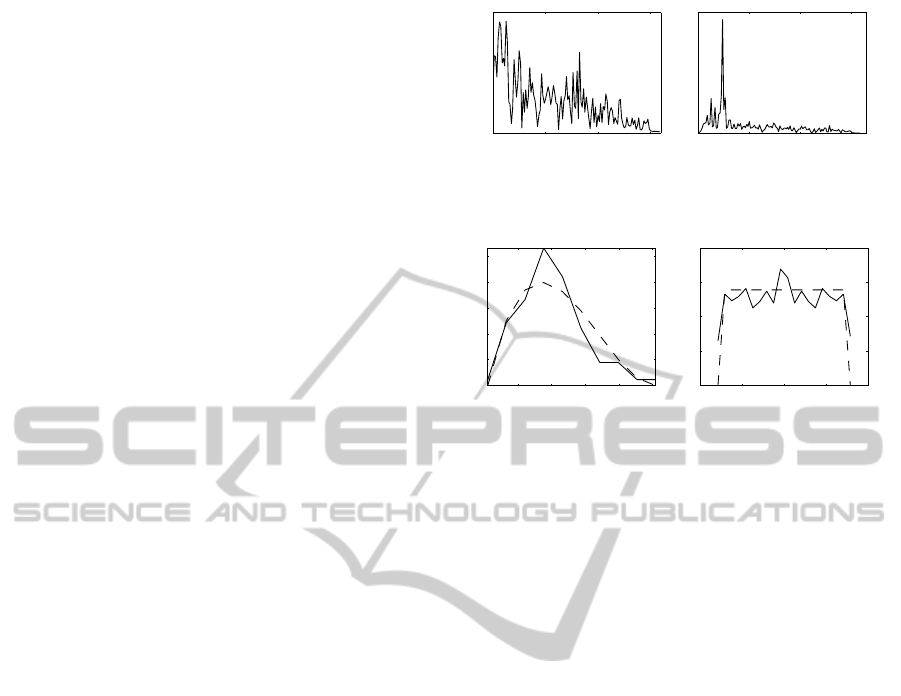
The power spectral density (PSD) was computed
for several time windows of 4s length, to find out if it
exhibitsa power law (1) process behaviour (figure 3).
Under this hypothesis, the fractal dimension FD can
be estimated using (4).
3.1.1 Parameter Extraction for Background
EEG Data
Fractal dimension (thus γ) and phase spectrum were
calculated for every time window from the database
and empirical distributions were estimated as de-
scribed previously. Results are shown in figure 4. γ
0 10 20 30
Frequency (Hz)
Magnitude
0 10 20 30
Frequency (Hz)
Magnitude
Figure 3: Adult scalp EEG power spectra: background (left)
and seizure (right).
1.3 1.4 1.5 1.6 1.7
0
0.05
0.1
0.15
0.2
0.25
(a) γ
−4 −2 0 2 4
0
0.02
0.04
0.06
0.08
(b) θ
Figure 4: Empirical distributions of the power coefficient γ
and of the phase θ for adult scalp background EEG. Theo-
retical distributions (beta and uniform respectively) are rep-
resented by dotted lines.
was found to follow a beta distribution with α = 1.936
and β = 2.975. θ was found to follow uniform distri-
bution in [−π,π]. These hypothesis were confirmed
using Kolmogorov-Smirnov test at a 5% significance
level.
3.1.2 Parameter Extraction for Seizure EEG
Data
The same procedure could be applied also for seizure
signals. Still, as seen in Fig. 3, the PSD does not
display a power law process behaviour: because of
rhythmic seizure activity, a peak in the seizure fre-
quency band might be observed. Consequently, eq.
(4) does not hold and other modelling techniques
must be applied (see also (Rankine et al., 2008)).
3.1.3 Validation
In order to validate the approach, the second proce-
dure described previously was used: starting from a
real signal, FD is estimated and thus γ. Its phase spec-
trum was computed (θ) as well as its power (used to
estimate c). These parameters were used to generate
a particular synthetic signal that was later compared
with the real one using the validation procedure de-
scribed previously (3 correlations ρ
t
, ρ
f
, ρ
t f
).
Background EEG. The obtained modelling results
are rather similar between new-born and adult data
(see table 1). Adult modelled signals show a better
EEG/SEEG SIGNAL MODELLING USING FREQUENCY AND FRACTAL ANALYSIS
251
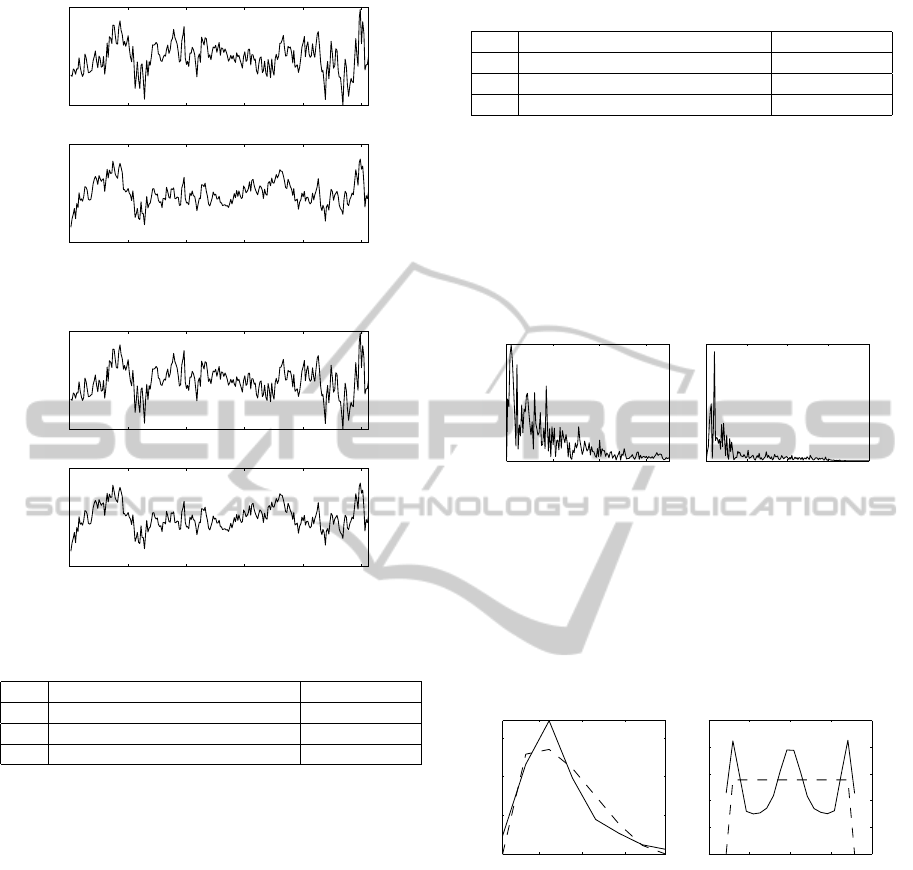
Real EEG
0 50 100 150 200 250
Simulated EEG
Time (samples)
Figure 5: Real and simulated background EEG signals.
Real EEG
0 50 100 150 200 250
Simulated EEG
Time (samples)
Figure 6: Real and simulated seizure EEG signals.
Table 1: Correlations (mean and sd) for background EEG.
ρ new-born (Rankine et al., 2008) adult
ρ
t
0.795 (0.081) 0.675 (0.075)
ρ
f
0.716 (0.131) 0.803 (0.150)
ρ
t f
0.817 (0.113) 0.705 (0.075)
correlation than new-borns in the frequency domain,
but correlation in time and time-frequency domains
are lower. Globally, it seems that the model proposed
for newborns by (Rankine et al., 2008) can be used
also for adult surface background EEG modelling.
Seizure EEG. Same analysis was performed for
seizure EEGs. We compare the correlations of our
FD-based model with Rankine’s et al.seizure model
(developed using a time-frequency approach).
Results from table 2 indicate that, unlike in the
previous case, in the time domain this method give
better results than (Rankine et al., 2008). On the con-
trary, in frequency domain correlations are very low.
This might be related to the power spectrum density
of surface seizure EEG that does not follow power
law. Still, due to the high result in the time domain,
we think that after an appropriate power spectrum
density estimation (i.e. different from 1/ f process),
this model could be used also for adult seizure EEGs.
Table 2: Correlations (mean and sd) for seizure EEG.
ρ new-born (Rankine et al., 2008) adult
ρ
t
0.345 (0.176) 0.661 (0.705)
ρ
f
0.799 (0.093) 0.494 (0.178)
ρ
t f
0.901 (0.056) 0.680 (0.090)
3.2 Adult Depth EEG (SEEG)
The main difference from a methodological point of
view between applying the same approach on EEG
and SEEG data is that, since the frequencies contained
in the SEEG might be higher, filtering and downsam-
pling are not applied. Examples of power spectra are
given Fig. 7.
0 10 20 30
Frequency (Hz)
Magnitude
0 10 20 30 40
Frequency (Hz)
Magnitude
Figure 7: PSD of an adult background (left) and seizure
(right) SEEG signal.
3.2.1 Parameter Extraction for Background
SEEG
Fractal dimension (and thus γ) and phase spectrum
were estimated for every time window. Results are
shown in Fig. 8.
1.6 1.8 2
0
0.1
0.2
0.3
(a) γ
−4 −2 0 2 4
0
0.02
0.04
0.06
0.08
0.1
(b) θ
Figure 8: Empirical distributions of the power coefficient γ
and of the phase θ for adult depth background SEEG. Theo-
retical distributions (beta and uniform respectively) are rep-
resented by dotted lines.
According to power spectrum density (Fig. 7),
we can see that SEEG could be considered as a 1/ f
process. The fractal dimension γ distribution was
found to follow beta distribution with α = 1.578 and
β = 2.945 (note that the values are quite different
from the surface EEG). This hypothesis was tested
with Kolmogorov-Smirnov test and could not be re-
jected at the 5% significance level. Meanwhile θ dis-
tribution was not uniform (Fig. 8(b)), so other dis-
tributions models should be used to model the phase
(Gaussian mixtures for example).
BIOSIGNALS 2012 - International Conference on Bio-inspired Systems and Signal Processing
252
3.2.2 Parameter Extraction for seizure SEEG
The same procedure has been applied also for seizure
SEEGs. As expected, the PSD does not display a 1/ f
behaviour, and phase distribution as well is far from
the uniform distribution: the described approach is
not appropriate for a reasonable simulation of seizure
SEEG data.
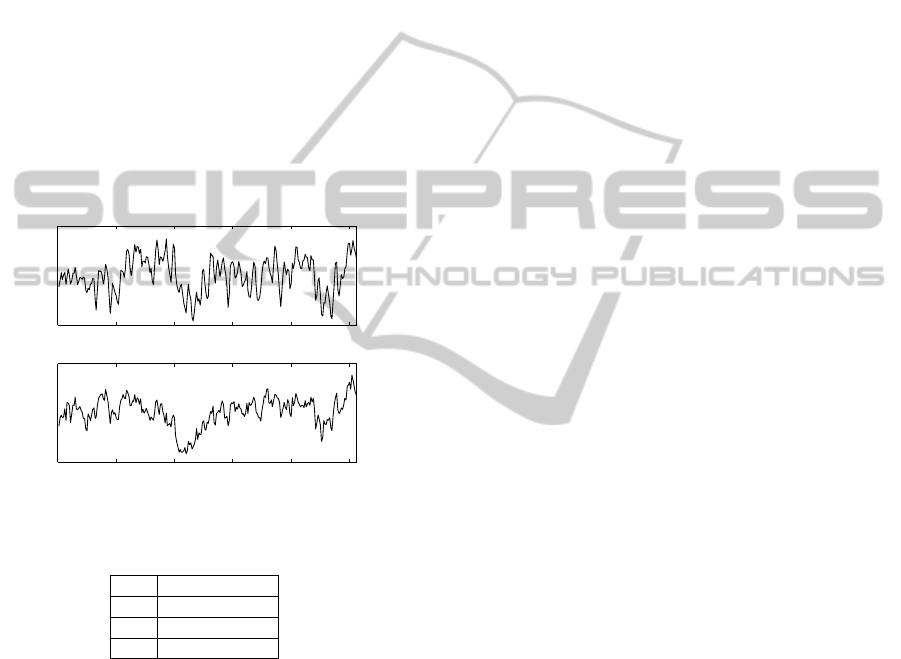
3.2.3 Validation
Background SEEG. As before, for every particu-
lar signal of background SEEG a synthetic signal was
generated using the extracted parameters.
According to Table 3, the simulated and real sig-
nals are moderately correlated (a higher value for the
time-frequency correlation though). Still, as shown
in Fig. 9, the modelling gives rather visually correct
results when compared to real data.
Real EEG
0 50 100 150 200 250
Simulated EEG
Time (samples)
Figure 9: Real and simulated background SEEG signals.
Table 3: Correlation (mean and sd) for background SEEG.
ρ adult SEEG
ρ
t
0.587 (0.064)
ρ
f
0.582 (0.201)
ρ
t f
0.720 (0.049)
Seizure SEEG. For consciousness, the same proce-
dure was applied for adult SEEG seizures. As ex-
pected, the obtained signals show very low corre-
lations results both in time and frequency domains.
Again, this is probably due to the specific frequency
content of epileptic seizures.
4 CONCLUSIONS AND FUTURE
RESEARCH
The goal of the research presented in this paper was
to explore if an existing model of surface new-born
background EEG (Rankine et al., 2008) can be used
for adult EEGs (background and seizure, surface and
depth). According to our results, it seems that it is
possible (although slightly less reliable) to generate
an adult background EEG than a newborn EEG. Sim-
ilarly, it is harder (but possible, mainly if a more
realistic phase model is used) to mimic background
SEEG signals than surface EEGs. On the contrary,
seizure EEG/SEEG signals cannot be reliably gener-
ated, probably due to the model assumption on the
spectral behaviour (1/ f).
A first immediate perspective is to confirm the
presented findings on a larger database. It might be
useful to introduce some categorisation in order to
have more specific classes of EEG signals to work
with (depending on the actual cerebral activity or on
the recording site). Finally, it could be interesting to
apply differentmodels for the power spectrum estima-
tion (besides 1/ f, clearly not appropriate for seizure
data) and for the phase (not necessarily following a
uniform distribution, as seen in the SEEG case).
REFERENCES
Delorme, A., Sejnowski, T., and Makeig, S. (2007). En-
hanced detection of artifacts in EEG data using higher-
order statistics and independent component analysis.
NeuroImage, 34:1443–1449.
Higuchi, T. (1988). Approach to an irregular time series on
the basis of the fractal theory. Physica D: Nonlinear
Phenomena, 31(2):277 – 283.
NIST/SEMATECH (2011). e-Handbook of Statistical
Methods. Oxford University Press.
Ott, E. (2000). Chaos in dynamical systems. Cambridge
University Press.
Rankine, L. et al. (2008). A Nonstationary Model of New-
born EEG. IEEE Transactions on Biomedical Engi-
neering, 54(1):19–28.
Robinson, P. A. et al. (2003). Neurophysical modeling of
brain dynamics. Physica D: Nonlinear Phenomena,
28(1):S74 – S79.
Stevenson, N. et al. (2005). Newborn EEG seizure simula-
tion using time–frequency signal synthesis. In Proc.
Workshop Digital Image Computing.
Wendling, F. et al. (2005). Interictal to ictal transition in
human temporal lobe epilepsy: Insights from a com-
putational model of intracerebral EEG. Clinical Neu-
rophysiology, 22(2):343–356.
Wornell, G. W. and Oppenheim, A. V. (1992). Estima-
tion of fractal signals from noisy measurements using
wavelets. IEEE Transactions on Signal Processing,
40(3):611 – 623.
EEG/SEEG SIGNAL MODELLING USING FREQUENCY AND FRACTAL ANALYSIS
253
