
ICOUNTER
Development of an Optical Readout Method for Mechanical Counters
Dirk Benyoucef, Pirmin Held and Thomas Bier
Digital Communications & Signal Processing Lab, Furtwangen University,
Robert-Gerwig-Platz 1, 78120 Furtwangen, Germany
Keywords:
Mechanical counter, Bayes classifier, Nearest neighbors classifier, Pattern recognition, Gray scale recognition,
Cluster analysis.
Abstract:
Mechanical counters are still very common in electricity, water and gas meters. Automatic readout of the
dial count without modifying the mechanics of the counter is only possible using expensive image processing
methods. Therefore the topic of this report is a new method for automatically reading out the counter values
without the need of additional mechanical or parallel electronic parts inside the counter. Instead the different
reflection properties of the different digits are measured and evaluated. This is done using only simple elec-
tronic parts and a microcontroller.
In the first part of the paper the hardware for measuring the reflection values is presented. A model of this
hardware with special emphasis on the influences of the environment is discussed in the next part. Following
this, two classification methods, for distinguishing the digits are analyzed. For showing the properties of the
new readout system measurements and simulations are given in the end.
1 INTRODUCTION
Mechanical counters are used in many different de-
vices, such as for example electricity, water, and
gas counters, cash mashines, and gambling machines.
Most often mechanical counters are used because of
their protection against manipulation. The readout of
the counter values is typically done by a person writ-
ing down the values on paper or computers which in-
volves high costs and makes continuous readout im-
possible. Therefore a possibility for automatically
evaluating the counter value is sought. Most of the
currently known methods for electronic readout use a
parallel electronic counter which is connected to the
mechanics of the counting unit. This does not read
the actual counter value but it reads the value of the
electronic counter. This undoes the advantage of pro-
tection against manipulation of the mechanical coun-
ters.
2 STATE OF ART
The evaluation of optically acquired counter values
is done applying digital signal processing. Pattern
recognition methods are used for the classification of
the digits. Especially the area of image processing
is concerned with finding a pattern in an optically
recorded image of this pattern. One way of achiev-
ing this is based on the gray level recognition. Otsu
has evaluated histograms of gathered images for this
purpose (Otsu, 1979). A second application was de-
scribed by (Martinez-Carballido et al., 2011). An-
other work concerned with the recognition of digits
was carried out in the year 2006 (Qian et al., 2006).
Many different methods can be applied in the area of
the optical recognition of counter values (Shu et al.,
2007). In 2010 Zhang et al. developed a portable
optical system (Zhang et al., 2010). For the pattern
recognition they applied different algorithms com-
prising including morphology, gray scale conversion,
edge detection and the Hough transformation. The
disadvantage of this method is that the readout of the
counter values has to be done manually. Another ap-
proach is based on the optical scanning using a video
camera. In 2007 Shu et al. presented a method for
recording the values of electronic counters (Shu et al.,
2007).
The disadvantages of the methods shown before
are the fact that the data acquisition has to be done
manually and that the presented readout units need ex-
pensive hardware. This is the basis for a new system.
The main advantage of this system is that no modifi-
576
Benyoucef D., Held P. and Bier T. (2012).
ICOUNTER - Development of an Optical Readout Method fot Mechanical Counters.
In Proceedings of the 1st International Conference on Pattern Recognition Applications and Methods, pages 576-580
DOI: 10.5220/0003779605760580
Copyright
c
SciTePress

cation of the mechanics of the counter is needed and
that the counter is read out directly without applying
an additional parallel counter. Furthermore the elec-
tronic hardware presented in the following is small
and inexpensive allowing for remote readout of the
counter values.
3 REFLECTION FACTOR
MEASUREMENT METHOD
The measurement of the reflection factors / gray value
is following the block diagram shown in Figure 1.
Each figure wheel is illuminated by two LEDs. The
reflected light is measured by three photo transistors
each. This assembly is attached to each figure wheel.
In this report a counter with six figure wheels is used.
The two light sources and the three light sinks result
Figure 1: Structure of the measurement system.
in three illumination settings and 9 measurements for
each figure wheel. After a measurement is completed
the first figure wheel representing the lowest order
digit is increased by one step. This way each mea-
sured value can be assigned to a counter value.
4 SYSTEM MODELING
In order to reduce the influence of external light a ref-
erence measurement is performed before each mea-
surement. Afterwards the first LED is switched on
and the reflected light is measured by the three opti-
cal sensors. The same procedure is performed for the
second LED and for the simultaneous operation of the
first and the second LED. The illumination with dif-
ferently located LEDs results in a nine-dimensional
feature vector ~r
m
, m ∈ [0,...,9] denoting the digit,
which allows for the recognition of the digits. The
formation of this vector is shown in equation (1).
The operation of LED
1
yields the reflection values t
1
through t
3
. Illumination by LED
2
is represented by t
4
through t
6
. The last three elements are the result of
the simultaneous operation of the two LEDs.
~r
m
=
t
1
t
2
t
3
| {z }
LED
1
t
4
t
5
t
6
| {z }
LED
2
t
7
t
8
t
9
| {z }
LED
1+2
T
(1)
For the following investigations the first three fig-
ure wheels are used. After 64 measurements of each
wheel the counter value is increased by one. This has
to be repeated 1000 times in order to measure each
possible digit combination of the first three wheels.
5 SYSTEM ANALYSIS
The measurement results are influenced by various
disturbances. The main factors are the variations of
the ambient temperature and the scattered light. For
a reliable recognition of each digit from the feature
vector~r
m
it is required to minimize these influences.
5.1 Influence of Scattered Light
The influence of scattered light can be divided into
constant and random light sources. The constant light
sources are modeled as an offset l
i
which results from
extraneous light and superposes the actually mea-
sured value t
i
, i ∈ [1,...,9].
t
0
i
= t
i
+ l
i
(2)
Light sources that vary during the measurement are
eliminated by a reference measurement at the begin-
ning of the process. However the operating point of
the photo transistors may be shifted by strong extra-
neous light sources. This influences is diminished by
the use of the aperture. Non-constant (sporadic) light
sources are modeled as a random variable s
i
. In the
case of an incandescent lamp which is turned on and
off periodically a normal distribution with non-zero
mean is assumed because of the integral behavior of
the lamp. The random variable is added to the actu-
ally measured value as well.
t
0
i
= t
i
+ s
i
(3)
When considering the expected value of t
0
i
the random
variable s
i
becomes a constant offset.
E
t
0
i
= E
{
t
i
}
+ E
{
s
i
}
= t
i
+ µ
s
i
(4)
Equation (4) shows that the influence of random ex-
traneous light can be eliminated by simple averaging.
As for the constant light source the resulting offset
can be compensated by a reference measurement.
ICOUNTER - Development of an Optical Readout Method fot Mechanical Counters
577
5.2 Tolerance of the Counter
Due to mechanical tolerances each figure wheel has
a mechanical slackness. This increases the disper-
sion of the measurement results. Additionally a fig-
ure wheel does not always rest in a defined position
which changes the reflection factors t
i
. For the anal-
ysis of this problem several measurements were per-
formed where a figure wheel reaches each digit multi-
ple times. This results in a vector of reflection factors
~
t
i
k
=
t
i
1
t
i
2
.. . t
i
n
T
(5)
with t
i
k
denoting the k-th realization of the i-th reflec-
tion factor. The reflection factor can be modeled as
the sum of the noise free reflection factor and the in-
fluence of the mechanical play
t
i
k
= t
i
+ m
i
. (6)
The mechanical play is modeled as a random variable
where the properties of this variable have to be de-
fined exactly. For this purpose the measurements of
t
i
are evaluated. First the probability density function
of m
i
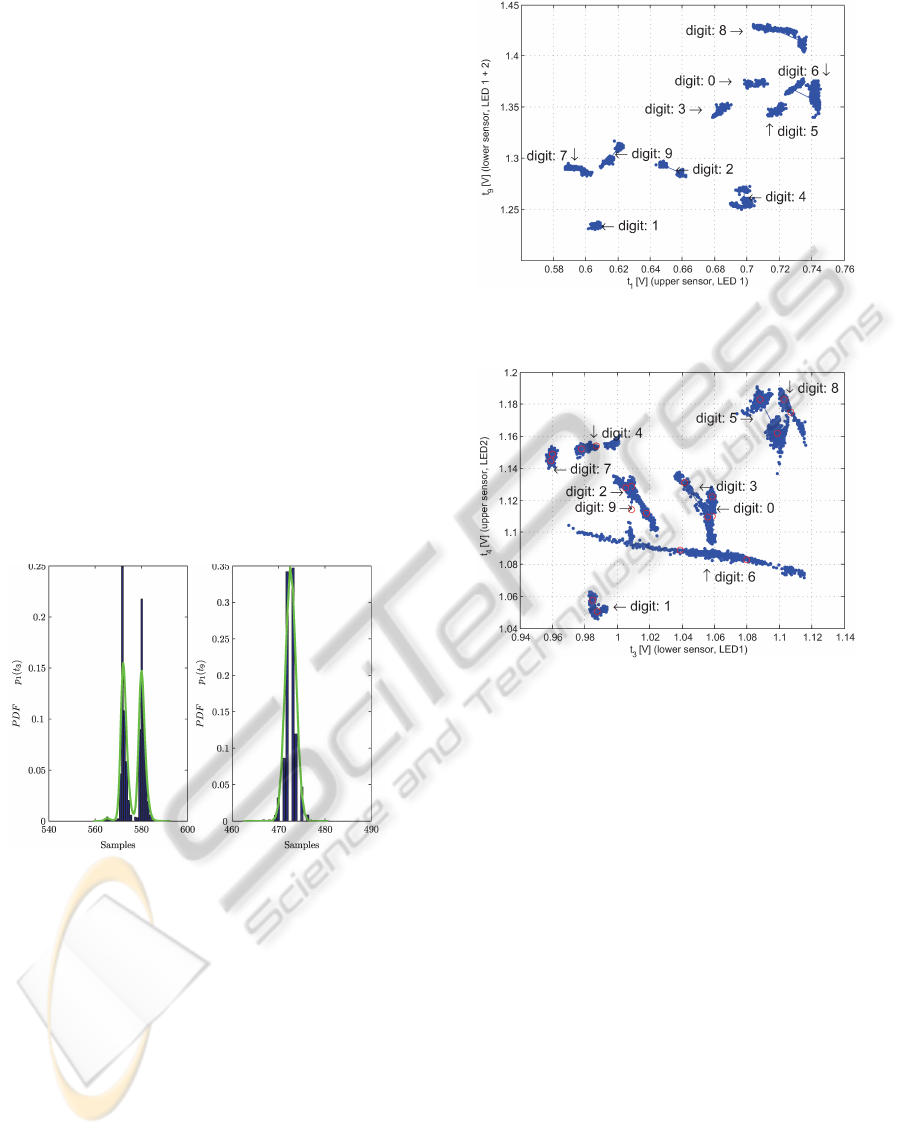
is used. The probability densities of the detector
signals t
3
and t
9
are shown in Figure 2. It is easy to see
Figure 2: Probability density function, Position 2, Digit 1,
LED 1 and 2.
that the signal t
3
forms a double normal distribution
whereas the signal t
9
shows a signal normal distribu-
tion. The evaluation of all sensor signals for all digits
shows that there is always either a single or a double
peak distribution which is the result of the mechanical
slackness of the figure wheels. The two-dimensional
distribution of the sensor signals is shown in Figures
3 and 4 as an example for this.
6 CLUSTER ANALYSIS
Based on the system analysis in the previous section
two approaches for the recognition of digits on the
Figure 3: Distribution of the clusters of the first figure wheel
with the features t
1
and t
9
.
Figure 4: Distribution of the clusters of the second figure
wheel with the features t
3
and t
4
.
figure wheel are shown in this section. The basis for
both algorithms is the separability of the digits in the
feature space. As seen in Figures 3 and 4 it is pos-
sible to separate the values of each digits in the two-
dimensional space. The first approach is based on the
k-Nearest Neighbors algorithm (kNN) with the modi-
fication that only single reference points are used. The
second approach uses a Bayes classifier.
6.1 Modified k-Nearest Neighbor
Algorithm
In order to reduce the computation complexity and
memory requirements the k-Nearest Neighbor algo-
rithm was modified. The new algorithm uses two ref-
erence points for each digit. These reference points
have to be determined in advance. The two reference
points are needed, because some distributions of the
reflection factors t
i
have, as shown in Figure 2, two
local maxima.
The reference are determined by computing the
expected value E
{
~r
m
}
=~µ
r
m
of the whole cluster of
ICPRAM 2012 - International Conference on Pattern Recognition Applications and Methods
578

one digit m and the reflection value t
1
which has the
longest distance d
1
to the expected value~µ
r
m
. All re-
flection values with distance to the reflection value t
1
smaller than the distance to the expected value d
1
are
assigned to the partial cluster c = 1. After this the
reflection value t
2
with the longest distance d
2
to the
expectation value ~µ
r
m
is computed. This value must
be in the whole cluster but it must not be in the par-
tial cluster c = 1. All reflection values with distance
to t
2
smaller than d
2
are assigned to the partial clus-
ter c = 2. This is done for all nine dimensions. After
the assignment of the values to the partial cluster the
expected value is computed for each of those partial
clusters c = 1 and c = 2.
~rz
c
m
= E
{
~r
c
m
}
c ∈ {1,2} (7)
A disadvantage of this method is that the statis-
tics of the distribution of the measured values is not
included in the recognition process. This may lead
to wrong results when dealing with large variances of
the probability density functions.
6.2 Bayes Classifier
In contrast to the classification based on the euclidean
distance the Bayes classifier makes use of the statisti-
cal characteristics of the values to be separated. Start-
ing point is the feature vector~r
m
which should be used
for deciding which number it represents. The Bayes
classifier assigns the value to the cluster which maxi-
mizes the a-posteriori probability P(m|~r
m
).
e = arg max
m=1,...,9
P(m|~r
m
) (8)
Using the Bayes theorem (Hoffmann, 1997) the deci-
sion rule can be expressed in values that can be deter-
mined from training values.
e = arg max
m=1,...,9
{
P(~r
m
|m) · P(m)
}
(9)
P(m) is the a-priori class probability and P(~r
m
|m) is
the conditional probability that the feature vector ~r
m
belongs to the class m.
As shown in section 5.2 the probability density
functions of the feature vectors~r
m
follow a single or
double normal distribution. Equation (10) declares
the multi-dimensional probability density function of
a single normal distribution (Hoffmann, 1997).
p(~r
m
|m) =
1
(2π)
N/2
· |K
m
|
1/2
· exp
−
1
2
· (~r
m
−~µ
r
m
)
T
· K
−1
m
· (~r
m
−~µ
r
m
)
(10)
~µ
r
m
is the expected value of the feature vector~r of the
class m and K
m
is the covariance matrix of the class
m.
7 EXPERIMENTAL RESULTS
The analysis of the classification algorithms is based
on the measurements of mechanical counters. The
data were separated into the training sequence for the
estimation of the parameters for the algorithms and a
test set for judging the quality of the algorithms. The
quality criterion was the classification error.
Figure 5: Analysis of the eigenvalues of the covariance ma-
trix K
m
of the digits 1, 3, 5, 7, and 9.
The eigenvalues of the covariance matrix for each
of the nine digits is shown in Figure 5. The figure
shows a distinct difference in the magnitude of the
eigenvalues. The condition number
χ(K
m
) =
λ
max
λ
min
, (11)
the ratio of the largest and the smallest eigenvalue, is
around 1000 for all digits. This means that there is
a strong correlation between the individual features.
This represents the physical dimensions of the mea-
surement board because the optical sensors are placed
very close together. So all three sensors of one fig-
ure wheel measure approximately the same reflection
factor. A comparison of the two classification algo-
rithms is shown in Figures 6 (a) and (b). In both
graphs the classification error is plotted against the
dimension of the feature vector dim{~r
m
}. All com-
binations of the features t
i
in dependence on the di-
mension were evaluated. The classification error was
obtained by computing the mean value. Therefore the
curves show an approximation of the maximum error.
The data used for the analysis were the test set values
described in the beginning of this section. The red
line at an error of
1
2500
marks the minimum error level
that can be reached. This is restricted by the available
number of values. The comparison of the algorithms
shows that the modified Nearest Neighbor algorithm
ICOUNTER - Development of an Optical Readout Method fot Mechanical Counters
579
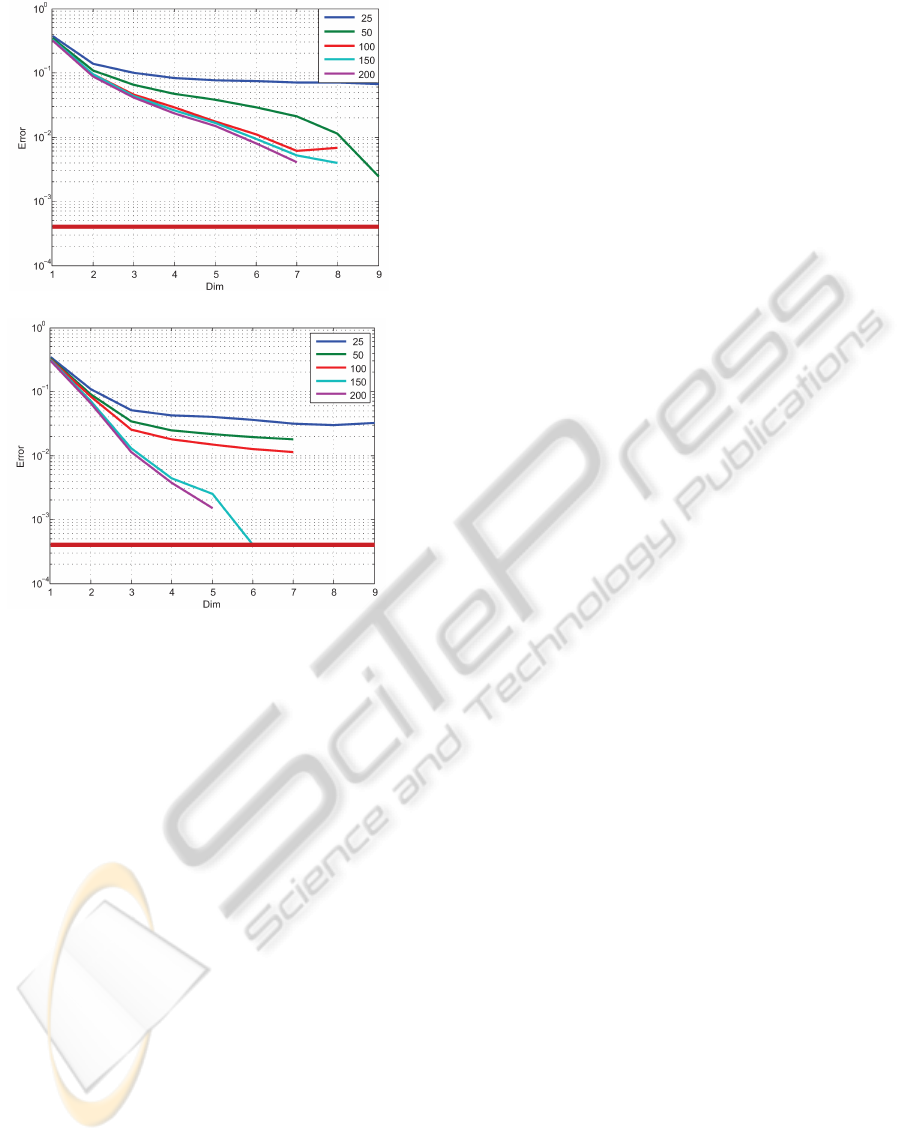
(a) Modified Nearest Neighbor algorithm.
(b) Bayes classifier.
Figure 6: Investigation of the classification error for differ-
ent numbers of training values for the parameter estimation.
The simulation is based on 2500 values of the test set.
produces considerably more errors 6 (a). When us-
ing 200 training values and requiring an error of 1 %
the Bayes classifier needs three dimensions whereas
the modified Nearest Neighbor classifier needs six di-
mensions. The error rate goes down to the minimum
if 8 dimensions are given. In the system all 9 dimen-
sions are used so the modified Nearest Neighbors al-
gorithm is advantageous because of its low computa-
tion complexity. The simulations show that the Bayes
classifier reaches zero error (which cannot be shown
in the logarithmic plot) at 8 dimensions and 50 train-
ing values as well.
8 CONCLUSIONS
In this report a system allowing the automatic readout
of the digits of mechanical counters was presented.
This method makes use of reflection values of the
figure wheels. The special advantage of the system
is that it does not require modifications of mechan-
ics of the counters and that the electronic parts used
are inexpensive. This method is not only restricted to
this special application but it can be used where ever
a limited number of symbols have to be recognized.
Another application may be for the manufacturers the
continuous check of the counter operation during the
production process and the quality assurance.
In this report the different influences of the envi-
ronment, such as extraneous light and the mechani-
cal tolerances of the counter, were analyzed. It was
shown that the influence of these disturbances can be
reduced to a level, that allows the error free recogni-
tion of the digits, by different means.
REFERENCES
Hoffmann, R. (1997). Signalanalyse und -erkennung: Eine
Einf
¨
uhrung f
¨
ur Informationstechniker. Springer, 1 edi-
tion.
Martinez-Carballido, J., Alfonso-Lopez, R., and Ramirez-
Cortes, J. (2011). License plate digit recognition us-
ing 7x5 binary templates at an outdoor parking lot en-
trance. In Electrical Communications and Computers
(CONIELECOMP), 2011 21st International Confer-
ence. IEEE.
Otsu, N. (1979). A threshold selection method from gray-
level histograms. In IEEE TRANSACTIONS ON SYS-
TEMS, MAN, AND CYBERNETICS, VOL. SMC-9,
NO. 1. IEEE.
Qian, J., Qian, D., and Zhang, M. (2006). A digit recogni-
tion system for paper currency identification based on
virtual instruments. In ICIA 06. IEEE.
Shu, D., Ma, S., and Jing, C. (2007). Study of the automatic
reading of watt meter based in image processing tech-
nology. In Industrial Electronics and Applications,
2007. ICIEA 2007. 2nd IEEE Conference. IEEE.
Zhang, Z., Chen, G., Li, J., Ma, Y., and Ju, N. (2010). The
research on digit recognition algorithm for automatic
meter reading system. In Intelligent Control and Au-
tomation (WCICA), 2010 8th World Congress. IEEE.
ICPRAM 2012 - International Conference on Pattern Recognition Applications and Methods
580
