
UNIVERSAL k-NN (UNN) CLASSIFICATION OF CELL IMAGES
USING HISTOGRAMS OF DoG COEFFICIENTS
Paolo Piro
1
, Wafa Bel Haj Ali
2
, Lydie Crescence
3
, Oumelkheir Ferhat
3
,
Jacques Darcourt
3
, Thierry Pourcher
3
and Michel Barlaud
2
1
Italian Institute of Technology (IIT), Genoa, Italy
2
I3S-CNRS Laboratory, University of Nice-Sophia Antipolis, Nice, France
3
Team Tiro CEA, University of Nice-Sophia Antipolis-CAL, Nice, France
Keywords:
Cell classification, NIS protein, k-NN, boosting.
Abstract:
Cellular imaging is an emerging technology for studying many biological phenomena. Cellular image analy-
sis generally requires to identify and classify cells according to their morphological aspect, staining intensity,
subcellular localization and other parameters. Hence, this task may be very time-consuming and poorly repro-
ducible when carried out by experimenters. In order to overcome such limitations, we propose an automatic
segmentation and classification software tool that was tested on cellular images acquired for the analysis of
NIS phosphorylation and the identification of NIS-interacting proteins. On the algorithmic side, our method
is based on a novel texture-based descriptor that is highly discriminative in representing the main visual fea-
tures at the subcellular level. These descriptors are then used in a supervised learning framework where the
most relevant prototypical samples are used to predict the class of unlabeled cells, using a new methodology
we have recently proposed, called UNN, which grounds on the boosting framework. In order to evaluate the
automatic classification performances, we tested our algorithm on a significantly large database of cellular
images annotated by an expert of our group. Results are very promising, providing precision of about 84% on
average, thus suggesting our method as a valuable decision-support tool in such cellular imaging applications.
1 INTRODUCTION
High-content cellular imaging is an emerging technol-
ogy for studying many biological phenomena. Re-
lated cellular image analysis generally requires to
identify and classify many cells according to their
morphological aspect, staining intensity, subcellular
localization and other parameters. New powerful
fully motorized microscopes are now able to produce
thousands of multiparametric images. Then statistical
analyses on large populations (more than thousands)
of cells are required.
Unfortunately, humans are limited in their clas-
sification ability as the huge amount of image data
makes the classification a burdensome task. In or-
der to circumvent this drawback, we have developed a
new classification method for the analysis of the stain-
ing morphology of thousands (millions) of cells. First
a fast multiparametric image segmentation algorithm
extracts cells with their nucleus. Then, our indexing
process builds specific descriptors for each cell image.
Finally, our cell classification method consists of two
steps: first, a training step that relies on a set of rep-
resentative cell images for computing the prototypes,
and then a classification stage using a leveraged k-NN
linear classifier. Our approach applies to several ap-
plications involving cell imaging in the research areas
of basic biology and medicine as well as clinical his-
tology.
In the present work, we used our classification
method to study the pathways that regulate plasma
membrane localization of the sodium iodide sym-
porter (NIS for Natrium Iodide Symporter). NIS is
the key protein responsible for the transport and con-
centration of iodide from blood into the thyroid gland.
NIS-mediated iodide uptake requires its plasma mem-
brane localization that is finely controlled by poorly
known mechanisms. Previously, we observed that
mouse NIS catalyses mediate higher levels of iodide
accumulation in transfected cells compared to its hu-
man homologue. We showed that this phenomenon
is due to the higher density of the murine protein
at the plasma membrane. To reach this conclusion,
biologists had to classify several hundreds of cells
(Dayem et al., 2008). We are now focusing on the
analysis of NIS phosphorylation that most probably
303
Piro P., Bel Haj Ali W., Crescence L., Ferhat O., Darcourt J., Pourcher T. and Barlaud M..
UNIVERSAL k-NN (UNN) CLASSIFICATION OF CELL IMAGES USING HISTOGRAMS OF DoG COEFFICIENTS.
DOI: 10.5220/0003779203030307
In Proceedings of the International Conference on Bioinformatics Models, Methods and Algorithms (BIOINFORMATICS-2012), pages 303-307
ISBN: 978-989-8425-90-4
Copyright
c
2012 SCITEPRESS (Science and Technology Publications, Lda.)
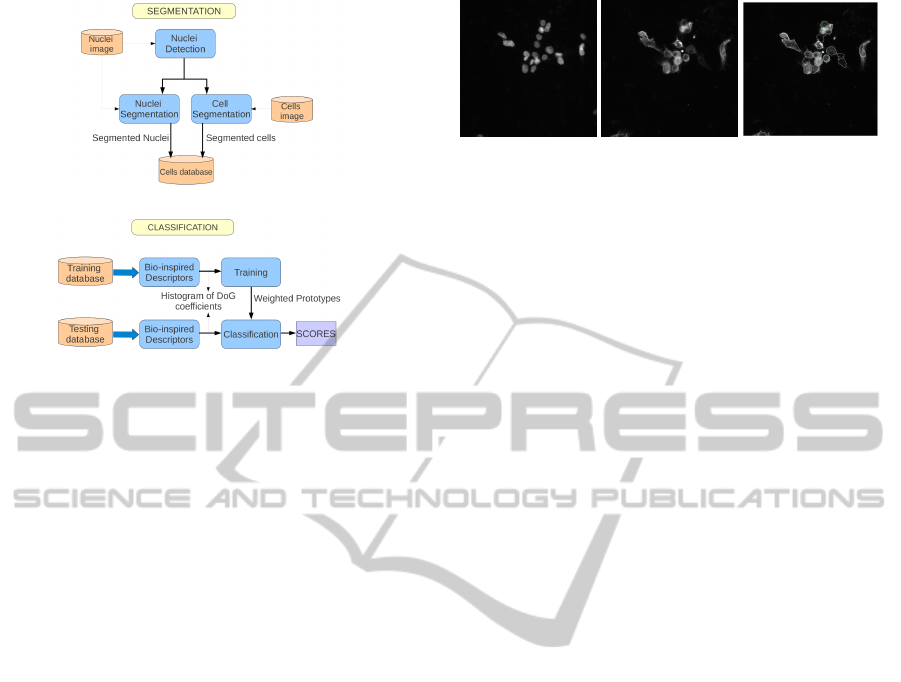
(a)
(b)
Figure 1: Block diagram of the proposed method for auto-
matic cell classification: (a) cell segmentation step and (b)
descriptor extraction and classification process.
plays an important role in the post-transcriptional reg-
ulation of the NIS. Using site-directed mutagenesis
of previously-identified consensus sites, we have re-
cently shown that direct phosphorylation of NIS alters
NIS targeting to the plasma membrane, as well as NIS
recycling, causing retention of the protein in intracel-
lular compartments such as the Golgi apparatus, the
endoplasmic reticulum or the early endosomes. We
have used a high-content cellular imaging to study
the impact of the mutation of several putative phos-
phorylation sites on the subcellular distribution of the
protein.
2 CLASSIFICATION METHOD
Our method for automatic classification of cell images
is depicted as a block diagram in Fig. 1. The first step
is a pre-processing segmentation of cells from the im-
ages. The database consists of two distinct parametric
fluorescence images. The first one, called nucleus im-
age, shows the nucleus, whereas the second, called
global image, shows the staining of the proteine. Nu-
cleus locations are detected from the nucleus image
and used as a prior for cell segmentation of the global
image. Then we split each cell region into two re-
gions of interest, corresponding to nucleus membrane
and cytoplasm, by using classic morphological opera-
tors. An example of both images and their segmenta-
tion is shown in Fig. 2. Then we apply our classifica-
tion method to the segmented cells. First we com-
pute bio-inspired region descriptors for each of the
segmented cells. These descriptors are then used in
(a) (b) (c)
Figure 2: Image of the nucleus-staining of representative
cells (a), NIS-specific immunostaining of the corresponding
cells (b) and their segmentation (c).
a supervised learning framework. We split this sec-
tion in two parts: the first describes the feature ex-
traction approach, whereas the latter is focused on our
prototype-based learning algorithm.
2.1 Region Bio-inspired Descriptor
Content information for classification of biologic
cells mainly relies on contrast. Our basic idea is to
use a region-based descriptor inspired to the natual vi-
sual system and reproducing the main features of reti-
nal processing. In fact, the first layer of retinal cells
is sensitive to local differences of illumination. This
low-level retinal processing stage is be modeled by
the Difference-of-Gaussian (DoG) as for the BIF de-
scriptors in (Bel Haj Ali et al., 2011). This descriptors
are well adapted to our cell images since the contrast
intensity of each single part of cells is the most rele-
vant feature for discriminating between different cat-
egories. Thus, we propose new cell descriptors based
on the local contrast in regions of interest of each cell
(nucleus, membrane and cytoplasm).
For this purpose, we implement filtering with dif-
ferences of Gaussians (DoG) centered at the origin.
Namely, we used DoG filters with the larger Gaus-
sian having three times the standard deviation as the
smaller one (Van Rullen and Thorpe, 2001). Af-
ter computing these contrast features C, we apply a
bounded non-linear transfer function, called neuron
firing rates. This function is written as:
R(C) = G ·C/(1 + Re f · G ·C), (1)
where G is the contrast gain and Re f is known as
the refractory period, a time interval during which
a neuron cell rests. The values of these two pa-
rameters proposed in (Van Rullen and Thorpe, 2001)
that best approximate the retinal system are: G =
2000Hz·contrast
−1
and Re f = 0.005 s. Therefore we
encode the firing rates coefficients by `
1
-normalized
histograms on segmented regions of interest: nucleus
and cytoplasm with membrane. Note that state-of-
the-art methods, such as the SIFT descriptor, encode
gradient directions on square blocks (Lowe, 2004).
BIOINFORMATICS 2012 - International Conference on Bioinformatics Models, Methods and Algorithms
304
2.2 Prototype-based Learning
We consider the multi-class problem of automatic cell
classification as multiple binary classification prob-
lems in the common one-versus-all learning frame-
work (Schapire and Singer, 1999). For this purpose,
we adopt the classification framework originally pro-
posed in (Piro et al., 2010b).
Our UNN classifier h
c
= {h
c
, c = 1,2,...,C} gen-
eralizes the classic k-NN rule as follows:
h
`
c
(x
q
) =
T
∑
j=1
α
jc
K(x
q
,x
j
)y
jc
, (2)
where x
q
denotes the query, x
j
denotes a labeled
prototype; y
jc
gives the (positive/negative) prototype
membership to class c; T denotes the size of the set of
prototypes that are allowed to vote (typically T m);
α
jc
are the so-called leveraging coefficients, that pro-
vide a weighted voting rule instead of uniform voting;
and K(·, ·) is the k-NN indicator function:
K(x
i
,x
j
) =
1 , x
j
∈ NN
k
(x
i
)
0 , otherwise
, (3)
where NN
k
(x
i
) denotes the k-nearest neighbors of x
i
.
Training our classifier essentially consists in se-
lecting the most relevant subset of training data, i.e.,
the so-called prototypes, whose cardinality T is gen-
erally much smaller than the original number m of an-
notated instances. The prototypes are selected by first
fitting the coefficients α
j
, and then removing the ex-
amples with the smallest α
j
, which are less relevant
as prototypes.
In order to fit our leveraged classification rule (2)
onto the training set, we minimize the following sur-
rogate exponential risk,
ε
exp
h
`
c
,S
.
=
1
m
m
∑
i=1
exp
n
−ρ(h
`
c
,i)
o
, (4)
where:
ρ(h
`
c
,i) = y
ic
h
`
c
(x
i
) (5)
is the edge of classifier h
`
c
on training example x
i
.
This edge measures the “goodness of fit” of the classi-
fier on example (x
i
,y
i
) for class c, thus being positive
iff the prediction agrees with the example’s annota-
tion.
UNN solves this optimization problem by using
a boosting-like procedure, i.e., an iterative strategy
where the classification rule is updated by adding a
new prototype (x
j
,y
j
) (weak classifier) at each step
t (t = 1,2,.. .,T ), whose leveraging coefficient α
j
is
computed as the solution of the following equation:
m
∑
i=1
w
i
r
i j
exp{−α
j
r
i j
} = 0 . (6)
(w
i
’s are updated at each iteration depending only on
the prototypes having been previously fit.) Details
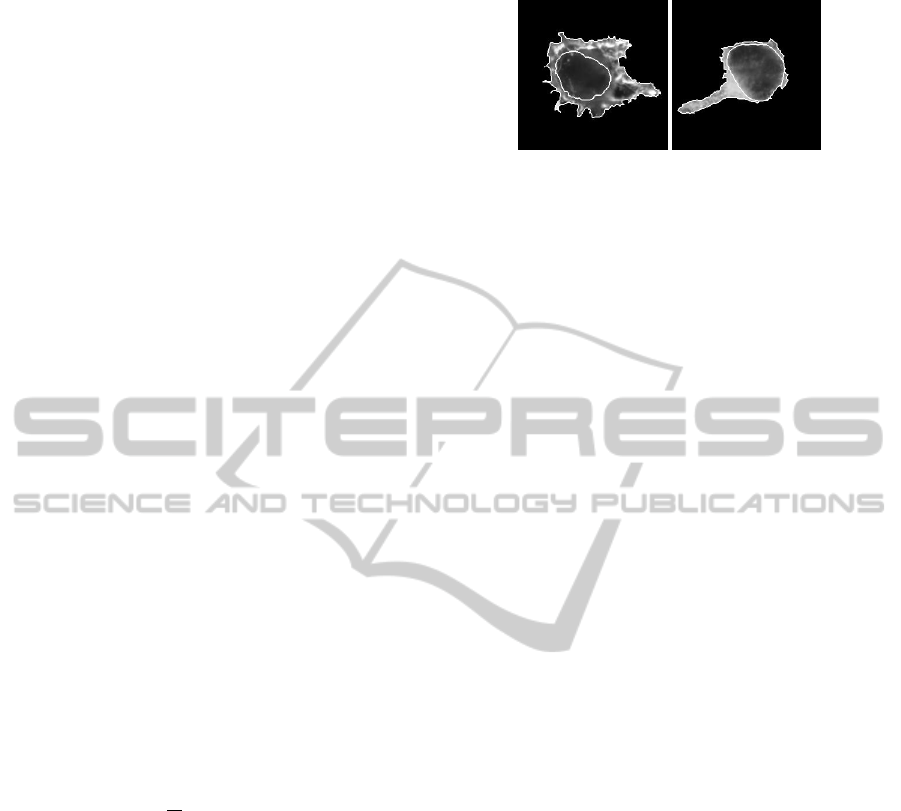
(a) (b)
Figure 3: An Mb (a) and an ER (b) cells from the database
segmented into their two regions of interest.
of our UNN algorithm and its properties are exten-
sively provided in (Piro et al., 2010a), where we have
proved a convenient upper bound for the convergence
of UNN under very mild hypotheses.
3 EXPERIMENTS
Images were acquired by means of a fully fluores-
cence microscope (Zeiss Axio Observer Z1) coupled
to a monochrome digital camera (Photometrics cas-
cade II camera). These images have a resolution
of 1024x1024 pixels. In our biological experiments,
we individually expressed different NIS proteins mu-
tated for putative sites of phosphorylation. The ef-
fect on the protein localization of each mutation was
studied after immunostaining using anti-NIS antibod-
ies as previously described (Dayem et al., 2008).
Immunocytolocalization analysis revealed three cell
types with different subcellular distributions of NIS:
at the plasma membrane; in intracellular compartment
(mainly endoplasmic reticulum); throughout the cy-
toplasm (with an extensive expression). Our analysis
aims to measure the effects of the different mutations
on ratios of the three cell types.
For this purpose, we collected 556 cell images of
such biological experiments and manually annotated
them according to the 4 classes, that are denoted in the
following as Mb protrusion and Mb (389 cells), ER
(100 cells), non classified NC (59 cells) and Round (8
cells). Since round cells are very easy to classify, we
focus on the three remaining categories: Membrane
(Mb), ER and NC. According to the visual aspect
of those classes, we compute cells descriptors using
two regions of interest: nuclei and external region, as
shown in Fig. 3. For both of them, 32-bins histograms
of rate coefficients (1) are extracted and concatenated
to build the global descriptor of the cell. Since we
deal with `
1
-normalized features, the histogram inter-
section (HI) distance is used as a similarity measure
between cells.
An important parameter for our DoG based de-
scriptors is the scale on which we compute the lo-
UNIVERSAL k-NN (UNN) CLASSIFICATION OF CELL IMAGES USING HISTOGRAMS OF DoG COEFFICIENTS
305
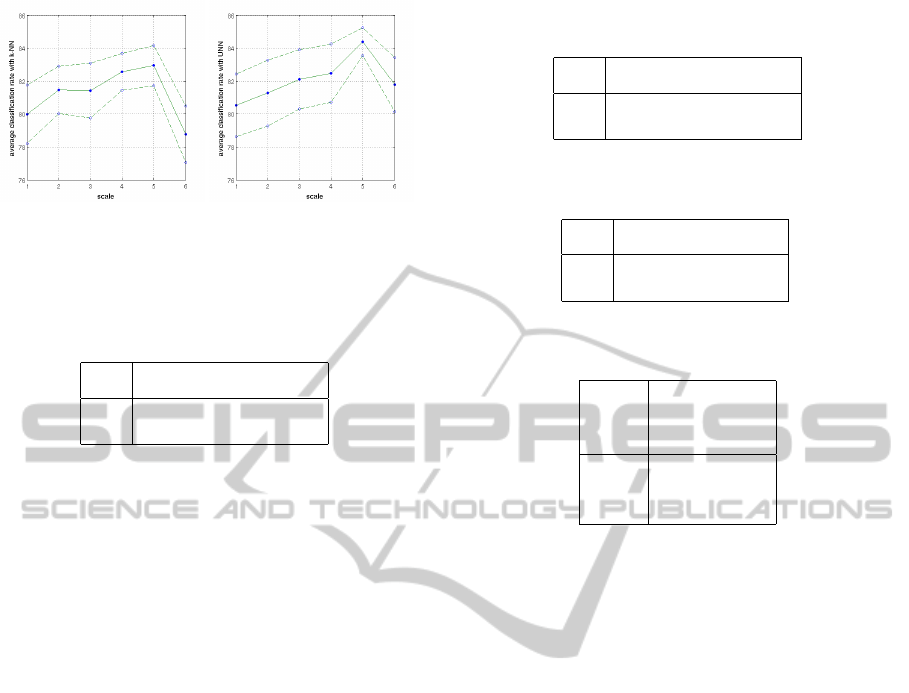
(a) (b)
Figure 4: The average classification rate and its standard
deviation in function of the descriptors scale for both k-NN
(a) and UNN (b).
Table 1: Confusion table for k-NN on the two-class
database we tested.
Mb
ER
NC
Mb 93,09 5,82 1,08
ER 25,20 72,80 2
cal contrast. In fact, the standard deviations of the
DoG are dependant of this parameter as follows: σ1 =
0.5 · 2
scale−1
and σ2 = 3 · σ1. We study first the more
relevant scale space and the evaluations on ten exper-
iments are reported in the curve of the Fig. 4. We note
that the scale 5 gives a relevant result for both UNN
and k-NN. In addition, the standard deviation of the
average classification rate with UNN for the scale 5
is quite interesting. Thus, the following evaluations
are performed using the scale 5 for descriptors.
Once we get descriptors of all the cells in the
database, we ran our UNN algorithm by training on
50% of the images, while testing on the remaining
50%. In order to get robust performance estimation,
we repeated the evaluation 10 times over different
random training/testing folds. We report the average
classification results as a confusion matrix in Tab. 2.
Remark that the mean average precision (MAP) is up-
per than 84% (average of diagonal entries in the con-
fusion matrix), which is a very promising result for
our cell descriptor and classification method. UNN
classification improves the MAP of the k-NN clas-
sifier of around 2% and the SVM one of more than
8%. Moreover some confusion (around 25% using
k-NN and 42% using SVM) arises on RE cells (see
Tab. 1) while they are reduced to 20% using UNN
classification. For the SVM classification, the result
in Tab. 3 shows that there is an important confusion
on RE cells. This confusion is due to the unbalanced
cells dataset, a common problem in cellular imaging
and for which SVM methods are quite sensitive. We
should note that we improved the standard deviation
of the average classification rate using the UNN ap-
proach by around 0,7% compared to k-NN and 4%
Table 2: Confusion table for UNN on the two-class
database we tested.
Mb
ER
NC
Mb 92,37 6,54 1,08
ER 20 76,40 3,60
Table 3: Confusion table for SVM on the two-class database
we tested.
Mb
ER
NC
Mb 94,89 5,10 0
ER 42.80 57.20 0
Table 4: The average and the standard deviation of the mAP
for k-NN , SVM and UNN.
µ(mAP)
σ(mAP)
k-NN 82.94 2.45
SVM 76.04 5.89
UNN 84.38 1.70
compared to SVM. We summarize evaluations on
Tab. 4.
4 CONCLUSIONS
In this paper, we have presented a novel technique
for automatic segmentation and classification of cell
images based on different subcellular distributions
of the NIS protein. Our method relies on extract-
ing highly discriminative descriptors based on bio-
inspired histograms of DoG coefficients on cellular
regions. Then, we carry out supervised learning by
using our UNN algorithm that learns the most rele-
vant prototypical samples for predicting the class of
unlabeled cellular images. We evaluated UNN per-
formances on a significantly large database of cellu-
lar images that were manually annotated. Although
being the very early results of our methodology for
such a challenging application, performances are re-
ally satisfactory (average precision of about 84%) and
suggest our approach as a valuable decision-support
tool in cellular imaging.
REFERENCES
Bel Haj Ali, W., Debreuve, E., Kornprobst, P., and Barlaud,
M. (2011). Bio-Inspired Bags-of-Features for Image
Classification. In KDIR 2011.
BIOINFORMATICS 2012 - International Conference on Bioinformatics Models, Methods and Algorithms
306

Dayem, M., Basquin, C., Navarro, V., Carrier, P., Marsault,
R., Chang, P., Huc, S., Darrouzet, E., Lindenthal, S.,
and Pourcher, T. (2008). Comparison of expressed
human and mouse sodium/iodide symporters reveals
differences in transport properties and subcellular lo-
calization. Journal of Endocrinology, 197(1):95–109.
Lowe, D. G. (2004). Distinctive image features from scale-
invariant keypoints. IJCV, 60(2):91–110.
Piro, P., Nock, R., Nielsen, F., and Barlaud, M. (2010a).
Leveraging k-NN for Generic Classification Boosting.
In MLSP 2010.
Piro, P., Nock, R., Nielsen, F., and Barlaud, M. (2010b).
Multi-Class Leveraged k-NN for Image Classification.
In ACCV 2010.
Schapire, R. E. and Singer, Y. (1999). Improved boosting al-
gorithms using confidence-rated predictions. Machine
Learning, 37:297–336.
Van Rullen, R. and Thorpe, S. J. (2001). Rate coding
versus temporal order coding: what the retinal gan-
glion cells tell the visual cortex. Neural Computation,
13(6):1255–1283.
UNIVERSAL k-NN (UNN) CLASSIFICATION OF CELL IMAGES USING HISTOGRAMS OF DoG COEFFICIENTS
307
