
FACTORIAL ANALYSIS TO MEASURE DEVELOPING
ABILITY OF LISTED RETAIL ENTERPRISES
Yi Feng
Beijing Jiaotong University, Shangyuancun Street, Beijing, China
Keywords: Developing ability, Listed retail enterprises, Factorial analysis, Operating component, Profit component.
Abstract: Retail business is the first to start and achieve the marketization in China. In recent years, China’s retail
business market has been developing rapidly, and in the meantime its status has been rising steadily. The
2008’s financial crisis struck the China’s retail business to some degree, but the government’s effective
policy of expanding domestic demand plays an important role in its development. Improving the
development of retail business industry will positively influence itself, but also the whole market and the
national economy. According to the factor analysis model,by using the method of empirical analysis, this
paper objectively evaluates the developing ability of our country’s listed retail enterprises and the key
factors which influence its developing ability. Meanwhile some proposals are put forward for the
development of our country’s retail business.
1 INTRODUCTION
Retail business is the industry selling products
directly to consumers or community groups. With its
growing effect in the national economy, retail
business has already become a leader to guide the
production and consumption. China’s retail business
has experienced a process from small to large,
closed to open, single to multiple in the nearly 30
years, and its position is rising in the global market
year by year. In 2009, the amount of China’s total
retail sales of social consumer goods is 12.53 trillion
Yuan, up 15.5% over 2008, and consumer-driven
economic growth is 3.9%. Therefore, I think doing
some analysis and research on China’s retail
business will be profound significant.
1.1 Literature Review
The achievement of factorial analysis in stock value
overseas is the conclusion that factorial analysis is
suitable for stock market, which contributed by S.
Genesalingam and Kuldeep Kumar in 2001. They
drew conclusions after analyzing some companies'
data obtained from US stock market from 1986 to
1991.
The application of factorial analysis in stock
market of China is some concrete analysis based on
the existing theories.
Limei Li and Xiangdong Liu. Factorial Analysis
in Stock Market. They choose five stocks from New
York stock market and abstracted two factors finally
to calculate scores and ranking of every enterprise.
Bing He and Xingsan Qian. Cluster Analysis and
Factorial Analysis in stock market. They divided
stocks of listed automobile companies into blue-chip
share, average share and trash share by cluster
analysis, and extracted three integrated factors to
reflect companies’ financial position which used to
evaluate the value of these companies.
1.2 The Trail of Thought
The author selected factorial analysis model to
conduct a research on the developing ability of
China’s retail business. First, I established a set of
financial index and collected data of listed retail
enterprises as samples. Second, I extracted main
components by Spss and drew a score function to
elicit a developing ability function. Third, I
calculated the scores of all companies and ranked
them based on the scores. At last, I made a sound
analysis according to the analysis integrated
practical situation.
553
Feng Y..
FACTORIAL ANALYSIS TO MEASURE DEVELOPING ABILITY OF LISTED RETAIL ENTERPRISES.
DOI: 10.5220/0003584705530556
In Proceedings of the 13th International Conference on Enterprise Information Systems (PMSS-2011), pages 553-556
ISBN: 978-989-8425-56-0
Copyright
c
2011 SCITEPRESS (Science and Technology Publications, Lda.)

2 MODEL AND INDEX
2.1 Factorial Analysis Model
The author selected factorial analysis as the main
method in this article. Factorial analysis is proposed
by British psychologist C. Spearman and used in the
field of psychology and social pedagogy. It is a
method extracting only a few integrated components
from a mass of figures based on the internal
correlation matrix. The fundamental idea of factorial
analysis is dividing the original variables into some
groups conformed to the principle that every
variable in the group is high related with each other,
while variables in different groups have low
correlative level. Every group is an integrated factor
called component which expresses an aspect of
essential features of original data.
2.2 Index
The author selected capital value-retaining and
value-increasing rate as dependent variable to
evaluate the developing ability of corporations.
Capital value-retaining and value-increasing rate
equals to the equity at the end of the year dividend
by equity at the beginning of the year. Higher this
figure is, better the condition of enterprise's capital
preserving ability, in turn stronger developing ability.
The author selected six financial ratios as the
independent variables:
1. Asset-to-debt ratio equals to the total assets
dividend by total debts. Asset-to-debt ratio reflects
the borrowing proportion in the total assets. The
higher the ratio is, the bigger the financial risk
enterprises are facing.
2. EPS reflects the profit level of common stock.
The compare between corporations contributes to
the evaluating of relative profit ability.
3. Net profit margin equals to the net income
divided by sales.
4. Cost-to-operating income ratio equals to
operating cost divided by operating income. It is an
important figure to evaluate the efficiency of
corporations' operation.
5. Total assets turnover equals to operating income
divided by average assets. It is an important figure to
evaluate the efficiency of assets turnover.
6. Equity turnover equals to sales divided by
average equity. It reflects the efficiency of the
management of assets.
3 ANALYSING PROCESS
3.1 Selecting Sample Data
This article gathered financial ratios from 58 listed
industrial retail enterprises in 2009 as the sample
data. According to China’s law, A-share and B-share
followed different accounting standards, so the
compare of their financial ratios is unreasonable.
Therefore, the author excluded B-stock listed
companies from research. In order to study theses
corporations' developing ability in the market full of
fierce competition, the author selected financial
ratios of all A-stock listed companies.
3.2 Resource of Data
All data used in this article is collecting from
Guotaian database (http://www.gtarsc.com).
3.3 Factorial Analysis
The author analyzed sample data by Spss.
Table 1: KMO and Bartlett's Test.
KMO and Bartlett's Test
Kaiser-Meyer-
Olkin Measure of
Sampling
Adequacy.
.487
Bartlett's Test of
Sphericity
Approx. Chi-
Square
109.553
df 15
Sig. .000
KMO test before analysis. The p value is 0.000,
less than 0.005. So we can conclude that factorial
analysis is available.
Table 2: Communalities.
Communalities
Initial Extraction
Asset-to-debt 1.000 .759
EPS 1.000 .606
Net profit margin 1.000 .522
Cost-to-operating income 1.000 .438
Total asset turnover 1.000 .849
Equity turnover 1.000 .764
The rate of extraction is quite high, which
indicates that most information has been extracted
by factorial analysis. So the analysis is effective. For
example, 0.759 means 75.9% information of sample
data has been extracted.
ICEIS 2011 - 13th International Conference on Enterprise Information Systems
554
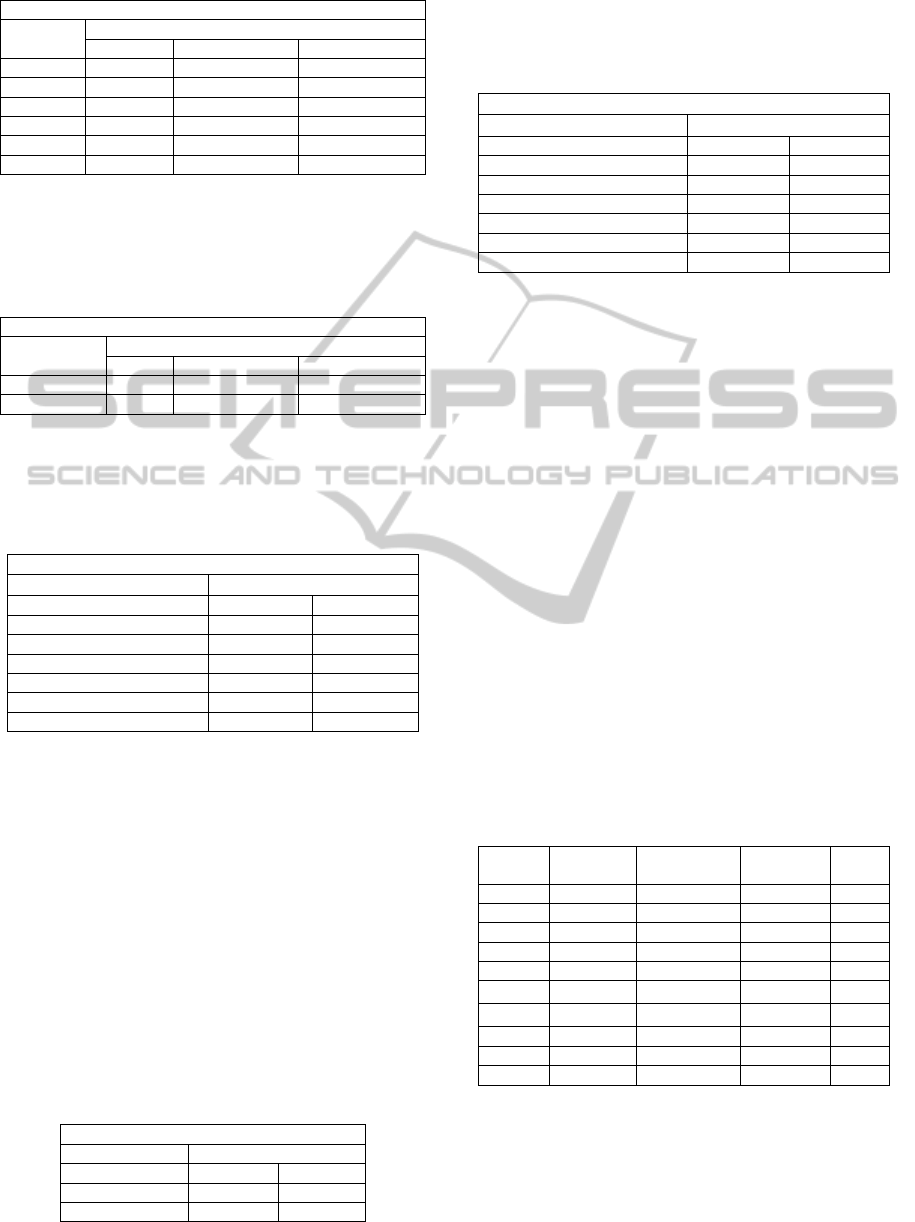
Table 3: Total Variance Explained.
Total Variance Explained
Component Initial Eigenvalues
Total % of Variance Cumulative %
1 2.276 37.935
2 1.662 27.704
3 .752 12.535 78.174
4 .685 11.419 89.593
5 .484 8.071 97.664
6 .140 2.336 100.000
According to Table 3, the first two factors'
eigenvalues is more than 1. So I extracted them as
the main factors.
Table 4: Total Variance Explained.
Total Variance Explained
Component Extraction Sums of Squared Loadings
Total % of Variance Cumulative %
1 2.276 37.935 37.935
2 1.662 27.704 65.638
The accumulated contribution rate of two factors
is 65.638%, largely reflected most information of the
original variables.
Table 5: Rotated Component Matrix.
Rotated Component Matrix
Component
1 2
Asset-to-debt .319 -.811
EPS .553 .548
Net profit margin .020 .722
Cost-to-operating income .637 -.180
Total asset turnover .878 .280
Equity turnover .830 -.273
Rotated component matrix reflects the
correlation coefficient between two components and
six variables.
Component 1 has a heavy loading on cost-to-
operating income, total asset turnover and equity
turnover, which indicates that operating capacity is
an important factor related to developing ability.
Therefore, I defined component 1 as Operating
Factor.
Component 2 has a heavy loading on asset-to-
debt, EPS and net profit margin, which indicates that
the proportion of loan and ability to profit are
important factors related to developing ability.
Therefore, I defined component 2 as Profit Factor.
Table 6: Component Transformation Matrix.
Component Transformation Matrix
Component
1 2
1 .998 -.060
2 .060 .998
The absolute value of correlation coefficient
between component 1 and component 2 is 0.06,
which indicates that they are irrelevant.
Table 7: Component Score Coefficient Matrix.
Component Score Coefficient Matrix
Component
1 2
Asset-to-debt .133 -.484
EPS .248 .335
Net profit margin .016 .434
Cost-to-operating income .278 -.102
Total asset turnover .389 .177
Equity turnover .363 -.156
I arrived at two component score functions by
regression method, using the information in Table 7:
1123
456
0.133 0.248 0.016
0.278 0.389 0.363
F
LLL
LLL
2123
456
0.484 0.335 0.434
0.102 0.177 0.156
F
LLL
LLL
Now, the variables applying to developing ability
analysis of retail business are 2 component variables
instead of 6 basic variables. Due to different
influence on the developing ability, I gave the two
components different weight which is their % of
variance.
1
2
Developing ability 0.37935
0.27704
F
F
I calculated the scores of developing ability of the 58
listed industrial retail enterprises according to the
developing ability equation. Followings are the top
five and last five ones:
Table 8: Scores.
Stock
code
F1 F2 Scores Rank
ing
600729 5.16200 -0.08833 1.93373 1
600306 4.61499 0.32048 1.83948 2
600693 4.17611 -0.95516 1.31959 3
600361 3.75471 -0.47394 1.29305 4
600560 3.14885 0.28592 1.27373 5
600738
0.41196 -0.29371 0.07491
54
600515
0.25753 0.37288 0.00561
55
600628 0.44913 0.92913 0.08703 56
600774 0.31733 -0.83568 -0.11114 57
000026 0.32905 -0.90545 -0.12602 58
3.4 Summary
There are two extracting factors affect developing
ability - Operating component and Profit component.
Both of them play crucial roles, while Operating
FACTORIAL ANALYSIS TO MEASURE DEVELOPING ABILITY OF LISTED RETAIL ENTERPRISES
555

component is relatively more important than Profit
component.
Chongqing Department Store (600729) ranked
first in the developing ability, and Commercial City
(600306) landed just behind it. At the bottom of the
table, are Hanshang Group (600774) and FIYTA A
(000026).
The operating ability of Chongqing Department
Store ranked first among the 58 stocks, which
indicates its outstanding asset management ability. It
can be revealed from following figure: Total asset
turnover ratio of Chongqing Department Store is
368.28%, while 10.29% of Hanshang Group. The
high ratio indicates a fast turnover speed of assets
from input to output, in turn a strong sales force.
This result corresponds to reality. Chongqing
Department Store adopted the advanced chain-like
management developing model. Due to splendid
management team, rich market resource and gook
prestige, its brand has stricken root in the hearts of
the consumers. As a result of 2008 Financial Crisis,
retail business experienced a recession. However,
Chongqing Department Store maintained sound
momentum of development.
Among 58 listed companies, the operating ability
of FIYTA ranked the bottom three, and the profit
ability of FIYTA ranked fifth from the bottom.
FIYTA is a leading enterprisee in China’s watch
making industry. Its poor performance in the
analysis should be attributed to 2008 Financial Crisis,
which had many impacts of luxury industry. Facing
this situation, FIYTA has adjusted strategies to tide
over the difficulty and wormed out of trouble in
2010.
4 CONCLUSIONS
The empirical analysis of developing ability of
China’s retail business by using the method of
factorial analysis supports some conclusions as
follows:
First, according to the practical situation, the results
of empirical analysis are in general agreement with
the market status. Hence, the index system, models
the author used in this article is appropriate.
Second, the developing ability equation shows that:
Operating ability and profitability are two key
factors to the development of company. China’s
retail business has been facing severe challenges
since China joined to WTO. Domestic market is
occupied by some well-known multinational groups.
China’s companies won't win this battle only by low
pricing, operation expanding. They need to focus on
improving the operating ability and profitability. Our
government has established lots of policies to
expand domestic demand theses years; it comes
easier to make a profit for most of retail
corporations. However, in a positive situation, many
retail corporations ignore operation management. It
will weaken their developing abilities, make them
expose to huge risk in future development and be in
a position of disadvantage ultimately. So it's very
important for retail corporations to keep high
efficiency and high turnover ratio to avoid breaks of
fund chain which will lead to a financial crisis.
Third, the ranking of retail corporations shows that:
The financial crisis has considerable influenced on
retail business. Some corporations lived through the
difficulty. On one hand, these corporations may have
low price elasticity of revenue. On the other hand,
they have built mature operation and management
systems. To sum up, although the influence of 2008
financial crisis has been weakening gradually, it is
necessary for corporations to learn something from
the experience. Pay more attention to the internal
management. Try to defuse potential risks and adjust
strategies timely to keep a stable condition in any
situation.
REFERENCES
Weidong Li, 2008. Applied Multivariate Statistical
Analysis, Peking University Press. Beijing, 1
st
edition.
Zinai Li, 2008. Econometrics, Higher Education Press.
Beijing, 2
nd
edition.
Quan Liu, 2010. Factorial Analysis Applied in the Stock
Market. In China Academic Journal Electronic
Publishing House(2010).
Banguo Dong and Zhiyong Wang, 2010. The Analysis of
Asset Atructure of Listed Retail Enterprises. In China
Market (2010).
ICEIS 2011 - 13th International Conference on Enterprise Information Systems
556
