
MODELING SYSTEM POWER CONSUMPTION CONSIDERING
DVFS AND THERMAL EFFECT
Hyeong S. Kim, Frank Yong-Kyung Oh, Hyeonsang Eom and Heon Y. Yeom
School of Computer Science and Engineering, Seoul National University, Seoul, Republic of Korea
Keywords:
Power consumption, Modeling, DVFS, Thermal.
Abstract:
Increasing energy efficiency for a single system or data center is gaining much interest among IT operators
and researchers. There has been lots of research focused on improving energy efficiency by analyzing existing
systems and proposing a new system architecture. The most fundamental part of improving energy efficiency
is to accurately and efficiently measure the power consumed by the servers. In this paper, we model the power
consumption of a single server with resource utilization considering two factors, DVFS and thermal effect.
1 INTRODUCTION
Increasing energy efficiency of a single system or data
center is gaining much interest among IT operators
and researchers. Recent advances in cloud comput-
ing and distributed systems are accelerating the en-
ergy usage in data centers. This trend is causing in-
creased operating cost and environmental concerns.
Therefore, maximizing energy efficiency is a key is-
sue for IT operators. There have been lots of research
focused on improving energy efficiency by analyzing
existing systems and proposing a new system archi-
tecture. Several research papers propose methods to
use low power processors or SSDs to improve energy
efficiency (Vasudevan et al., 2011; Andersen et al.,
2009; Caulfield et al., 2009). Scaling down the clus-
ter in distributed systems is another way to effectively
improve energy efficiency (Chun et al., 2010; Harnik
et al., 2009).
The most fundamental part of improving energy
efficiency is to accurately and efficiently measure the
power consumed by the servers. The simplest method
is to directly measure the power consumption of the
servers by using hardware such as power meters.
However, it is not practical to attach power meters
to all the running servers due to economical reasons.
Therefore, there have been several research which use
inference techniques to indirectly measure the power
consumption of servers. Rivoire et al. analyzed sev-
eral methods to model the power consumption of a
single system (Rivoire et al., 2008). Initial effort was
to use resource utilization to infer the power con-
sumption (Fan et al., 2007; Qureshi et al., 2009). Re-
cent research uses performance monitoring counters
to measure the power consumption of servers (Kansal
et al., 2010; Koller et al., 2010). We can obtain lots of
information from the performance monitoring coun-
ters such as cycles per clock or number of L3 cache
misses.
However, existing literature lacks the following.
The first is that they do not consider the intrinsic
power management of processors. Modern proces-
sors employ Dynamic Voltage and Frequency Scaling
(DVFS) to dynamically adjust its frequency and volt-
age depending on the load. A few of previous litera-
ture mention that it is necessary to consider DVFS in
the power consumption model. However, none of au-
thors give any specific power model considering the
DVFS. Secondly, there is no power model that con-
siders thermal effect as well. Since the change in tem-
perature affects the power consumption of CPU, this
factor must be considered in modeling the power con-
sumption.
In this paper, we model the power consumption
of a single server with resource utilization. In our
model, we consider two factors, DVFS states and
thermal effect. Our assumption is that we can infer
the power consumption of a single system by mea-
suring the power consumption of the CPU since CPU
consumes most of the power provided to the system.
Several work already employ this assumption (Fan
et al., 2007; Qureshi et al., 2009). To model the power
consumption, we analyze the power consumption of
a server while 1) changing the CPU frequency and
2) changing the temperature of the CPU. With this
analysis, we propose a power model of a single sys-
149
S. Kim H., Yong-Kyung Oh F., Eom H. and Y. Yeom H..
MODELING SYSTEM POWER CONSUMPTION CONSIDERING DVFS AND THERMAL EFFECT.
DOI: 10.5220/0003507401490153
In Proceedings of the 6th International Conference on Software and Database Technologies (ICSOFT-2011), pages 149-153
ISBN: 978-989-8425-76-8
Copyright
c
2011 SCITEPRESS (Science and Technology Publications, Lda.)
tem with CPU utilization and CPU temperature. Our
model shows accurate estimation and similar trend to
the actual power consumption.
2 MODELING POWER
CONSUMPTION
We analyze the power consumption of a single server
while varying the frequency and the temperature of
the CPU.
2.1 DVFS and Thermal Effect
In current Linux, DVFS is controlled by a governor.
Users can configure the governor as one of the follow-
ings, performance, ondemand, conservative and pow-
ersave. Under performance governor, CPU runs at its
maximum frequency, whereas CPU runs at its min-
imum frequency under powersave governor. Onde-
mand governor periodically checks the current CPU
load and maximizes its frequency if the current load is
higher than the system threshold. Conservative gov-
ernor is different from the ondemand governor in that
it increases its frequency step by step. Since the on-
demand governor shows the minimum frequency and
the maximum frequency under idle and peak load, re-
spectively, we configured the server with ondemand
governor.
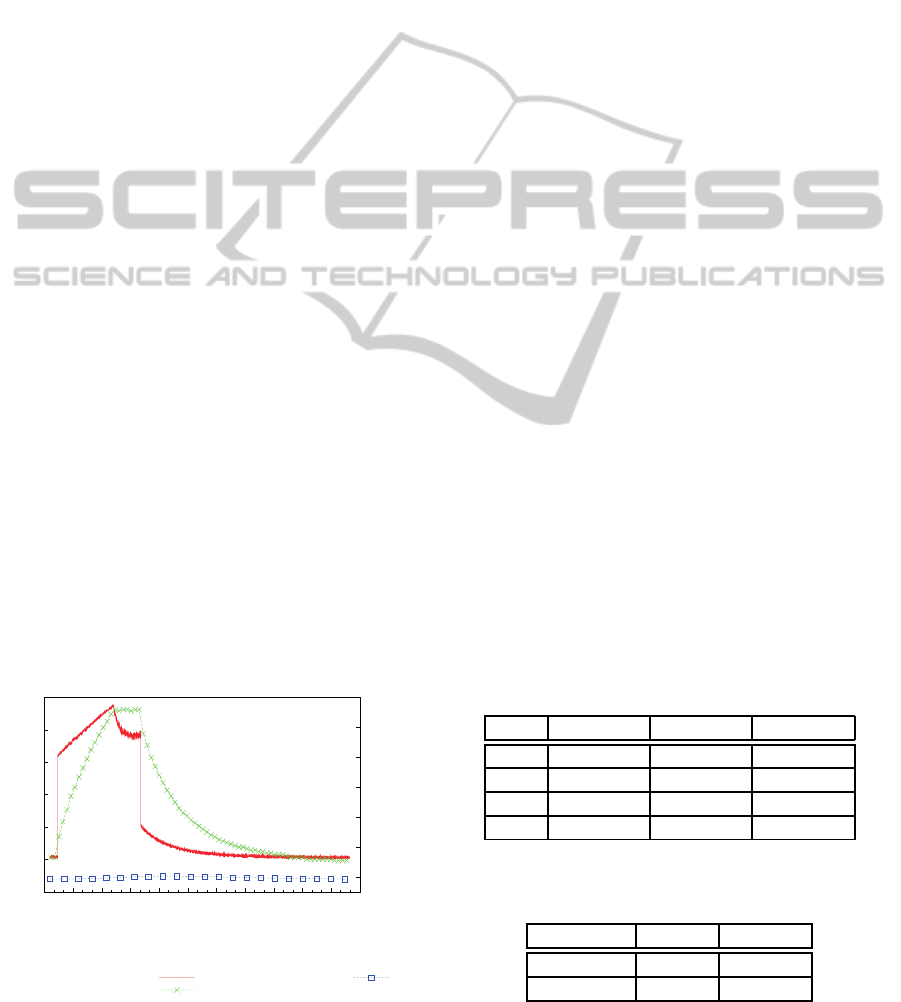
We show the power consumption and the tem-
perature change of a single server in Fig. 1. Our
target server has one quad-core processor with hy-
per threading disabled. We execute four CPU stress
test programs simultaneously and measure the power
consumption of the system with Yokogawa WT210
power meter. And we also measure the temperature
of CPU from both inside and outside.
60
70
80
90
100
110
120
16:48:00
16:51:00
16:54:00
16:57:00
17:00:00
17:03:00
17:06:00
17:09:00
17:12:00
17:15:00
17:18:00
17:21:00
30
40
50
60
70
80
90
Power consumption (Watt)
Temparature (C)
Time
Power
CPU temperature
Outside temperature
Figure 1: The change of power and temperature.
The server consumes about 70 W when it is in
idle state. We executed CPU stress test processes
at around 16:49 and killed them at around 16:58.
Four processors run at their maximum frequency and
the power increases up to 102 W. After that, the
power consumption continuously rises until the power
reaches around 117 W even though the utilization re-
mains the same - 100%. This is due to the increased
temperature of the CPU. In the figure, the temperature
of the CPU increases from 35.5 °C to 86 °C. Even if
all the processes are killed, the power consumption at
that time is about 10 W higher than that of the initial
power consumption. Note that the utilization of both
of the cases is the same - 0%. This is caused by the
increased CPU temperature.
When the power consumption reaches the maxi-
mum, the power suddenly drops to around 109 W and
becomes stabilized. This is because the CPU temper-
ature has reached the critical CPU temperature. As
shown in the figure, the CPU temperature does not in-
crease after the power consumption reaches the max-
imum. The CPU itself adjusts the frequency of the
CPU cores in order to maintain the temperature of
the CPU (this is called the CPU thermal throttling).
This is shown in Table 1. In this table, we show
the fraction of the time consumed in the frequency
of the four cores while the CPU temperature stays at
its critical value. Since the governor is set to the on-
demand governor, the frequency of the cores should
stay at their maximum frequency, which is 2.83 GHz
in our case. However, the actual frequency of the
cores shows abrupt changes so that the temperature
is maintained in a certain level. For all the cores, the
frequency was transitioned to its minimum about one
fourth of the execution time. In this case, the temper-
ature is maintained at around 86 °C.
We also show the power consumption when the
cores run with different frequencies.
Table 1: The fraction of the time consumed in CPU frequen-
cies during CPU throttling.
Core 2.83 GHz 2.33 GHz 2.00 GHz
0 0.74 0 0.26
1 0.72 0 0.28
2 0.70 0 0.30
3 0.74 0 0.26
Table 2: Power measurement with different CPU frequen-
cies.
Frequency idle peak
2.00 GHz 70.2 W 85.2 W
2.83 GHz 71.2 W 102.5 W
ICSOFT 2011 - 6th International Conference on Software and Data Technologies
150

We execute the same jobs and maintain the utiliza-
tion of 100% for all the cores. The result is shown
in Table 2. Although the utilization of both of the
frequencies is the same, the difference of the power
consumption is fairly large. The gap becomes larger
if the difference of the frequency becomes larger.
From this observation, we claim the following re-
sults. First, the thermal effect on CPU power con-
sumption is not ignorable since high temperature can
result in extra power consumption and the CPU fre-
quency throttling. Second, we cannot use the CPU
utilization only as a metric to measure the system
power consumption. This is due to the fact that even
if the system is in full utilization, the DVFS can re-
strict the frequency depending on the DVFS gover-
nor. Since the power consumption of the full uti-
lization under different frequencies is different, we
should consider the DVFS states in the power con-
sumption model.
2.2 Power Model
Our assumptions are as follows.
• CPU can have heterogeneous cores, which means
that the available frequencies of each core in the
same CPU packages can differ.
• We use the CPU utilization as our metric to mea-
sure the system power consumption. This as-
sumption is generally used in previous literature.
We model the current power consumption of
server n by the following equation.
P
n
= P
r
+ ∆P
t
, (1)
where P
r
is the power consumed by the computing
resources and ∆P
t
is the change on power incurred by
the thermal effect.
We first model the power contributed by the com-
puting resources in the following equation. We model
P
r
as the sum of the per-core power consumption. The
basic formula is similar to one presented by Fan et
al (Fan et al., 2007). The basic power consumption
formula has the following form,
P
n
= P
i
+ u(t) ·(P
p
− P
i
), (2)
where P
i
and P
p
are the power consumption when the
system is in idle and peak state, respectively. u(t)
is the utilization of the current time. Although Fan
et al. use heuristics computing u(t), the principle is
the same - interpolating the idle and peak power con-
sumption depending on the utilization. We modified
their model to reflect the frequency of each core.
We modeled it as the following equation.
P
r
= P
i
+
∑
c∈C
n
P
r
(c), (3)
where P
i
is the system idle power consumption, C
n
is the set of CPU cores of node n and P
r
(c) is the
power consumption contributed by the core c of node
n. P
r
(c) can be computed as follows.
P
r
(c) = u(c) · { ∆P
i
(s(c)) + (4)
(P
p
(s(c)) − P
i
(s(c)))},
where u(c) is the utilization of the core c of node
n and s(c) is the DVFS state (frequency) of core c.
Therefore, ∆P
i
(s(c)) is the increased idle power con-
sumption when the core c is in state s(c). Similarly,
P
i
(s(c)) and P
p
(s(c)) denote the idle and peak power
consumption when the core c is in state s(c).
Now we elaborate more on the power model with
the thermal effects. The basic model is similar to the
model proposed by Fan et al. in that we interpolate
the idle and peak power. In contrast to the power
consumption contributed by the computation, we use
system wide utilization to model the power consump-
tion contributed by the thermal effect. The powercon-
sumption is shown in Eq. 5.
∆P
t
= ∆P
i
t
+ u
t
· (∆P
p
t
− ∆P
i
t
), (5)
where ∆P
i
t
is the least and ∆P
p
t
is the highest power
consumption incurred by the thermal effect. u
t
is the
ratio of the current temperature to the peak tempera-
ture, which we compute as the following equation.
u
t
=
t
p
− t
c
t
p
− t
i
, (6)
where t
c
, t
i
and t
p
denote the current CPU tempera-
ture, the lowest and the highest CPU temperature, re-
spectively. We normalize the temperature to the high-
est temperature so that we can obtain the power in-
crease due to the thermal effect.
3 MODEL EVALUATION
We evaluated our model with several benchmark pro-
grams. First, we used the stress benchmark program
for the first experiment which we used in Section 2,
and also used SPECpower (SPECpower, 2011) for
the second. SPECpower is a software benchmark tool
to measure the power efficiency of the target system.
The parameters used in our server are shown in Ta-
ble 3. We obtain the values by measuring the power
consumption with various CPU DVFS states.
MODELING SYSTEM POWER CONSUMPTION CONSIDERING DVFS AND THERMAL EFFECT
151
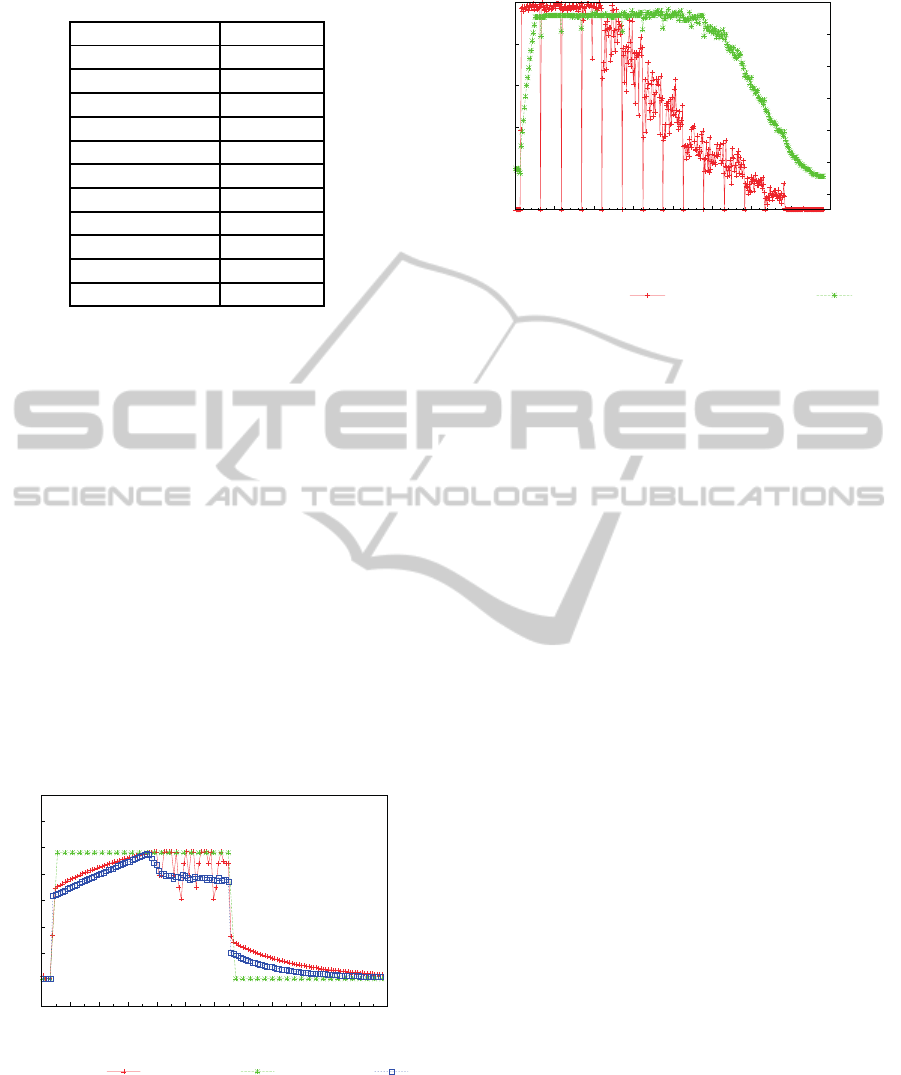
Table 3: Parameters used in our server.
P
i
70.2 W
P
p
118.07 W
∆P
i
t
0 W
∆P
p
t
16 W
t
i
32 °C
t
p
86 °C
∆p
i
(2.00 GHz) 0 W
∆p
p
(2.00 GHz) 3.56 W
∆p
i
(2.33 GHz) 0.5 W
∆p
p
(2.33 GHz) 6.2 W
∆p
i
(2.83 GHz) 1 W
∆p
p
(2.83 GHz) 8.04 W
We first show the result when we execute the CPU
intensive processes as we did in Section 2. We ex-
ecute four CPU stress test programs simultaneously
and measure the power consumption with the other
model, which is proposed by Fan et al. The result
is shown in Fig 2. As shown in the figure, Fan’s
model is very different from the actual power con-
sumption since they do not consider DVFS and tem-
perature. Their model maintains the maximum power
consumption since utilization of the system is 100%.
When the system utilization drops to zero, their model
immediately drops the power consumption to the min-
imum. However, our model shows changes according
to the frequency change and gradually increases the
power consumption according to the CPU tempera-
ture. Our model also reduces the power consumption
when the load is dropped to zero which shows similar
pattern with the actual power consumption.
60
70
80
90
100
110
120
130
140
20:00
22:00
24:00
26:00
28:00
30:00
32:00
34:00
36:00
38:00
40:00
42:00
44:00
Estimated power consumption (Watt)
Time
Our model Fan’s model Actual power
Figure 2: Comparison of estimated power consumption and
actual power consumption when CPU stress test programs
are executed.
In the next experiment, we use SPECpower
to evaluate our model. During the execution,
SPECpower maximally utilizes the system to obtain
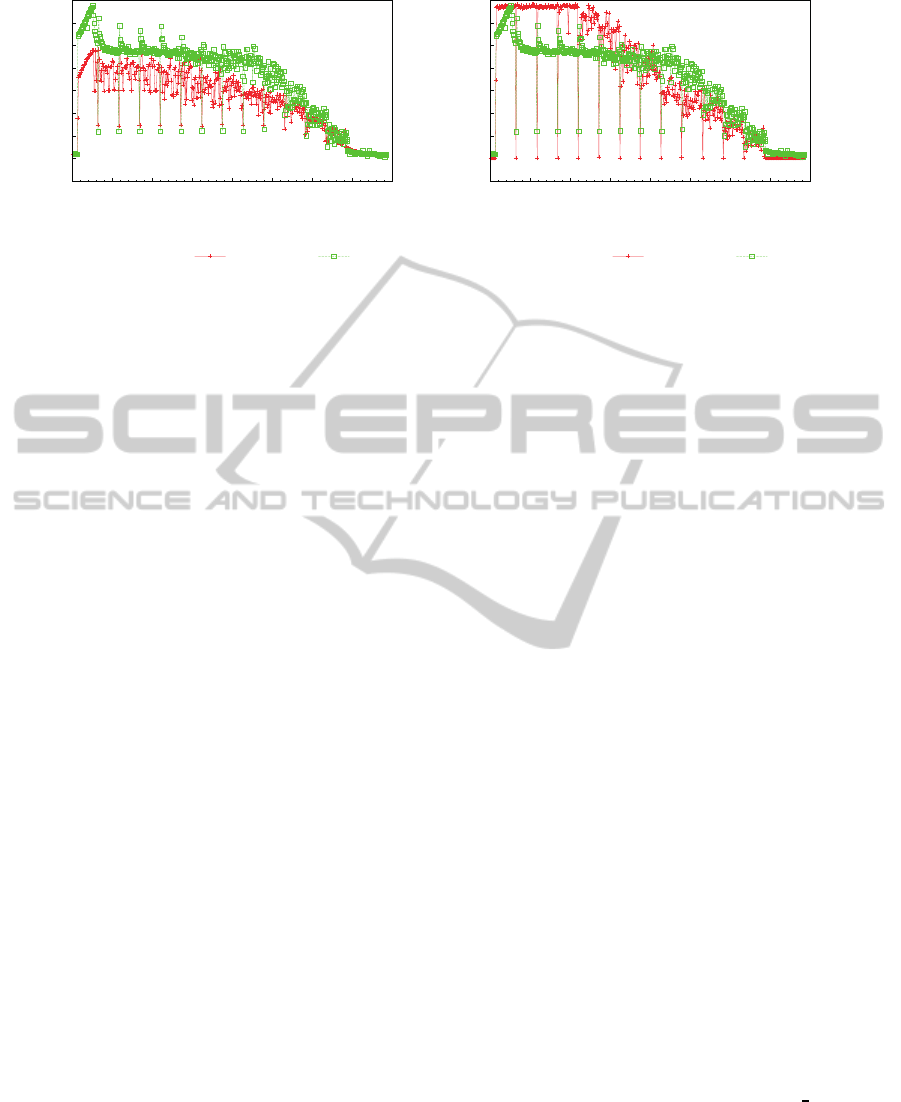
0%
20%
40%
60%
80%
100%
14:30:00
14:40:00
14:50:00
15:00:00
15:10:00
15:20:00
15:30:00
15:40:00
15:50:00
30
40
50
60
70
80
90
Utilization
Temparature (C)
Time
System utilization
CPU Temperature
Figure 3: System utilization and CPU temperature when
SPECpower is executed.
the maximum throughput of the target system. After
that, SPECpower imposes specific load on the system
so that it can obtain the throughput depending on the
load. The system utilization and the temperature dur-
ing the execution are shown in Fig. 3. After three
calibration periods, SPECpower imposes load on the
system by decreasing the load by 10% until the load
reaches 0. The utilization curve shows this trend.
We show the estimated power consumption by our
model and Fan’s model in Fig. 4. Actual power con-
sumption is also shown in the figure. First of all,
the curve of actual power consumption is similar to
the CPU temperature curve of Fig. 3. The utilization
curve in Fig. 3 drops faster than the CPU tempera-
ture, which means the utilization curve is not similar
to the actual power consumption curve. Although a
lot of existing literature uses the utilization to mea-
sure the power consumption, this graph shows that the
power consumption is more dependent on the CPU
temperature. This proves that our model is more ac-
curate than those use only utilization. The main dif-
ference between the actual power consumption and
our estimated model is that our model does not count
for other resources. Since SPECpower heavily uses
disk and memory, actual power consumption is larger
than the estimated power consumption by our model.
Now we compare our model to the model proposed
by Fan et al. Since Fan’s model is solely dependent
on the utilization, their model does not fit the actual
power consumption. Even though their model con-
siders other resources (ex. memory, disk, and net-
work) as well, the estimated model does not go along
with the curve of actual power consumption. Because
it uses a heuristic method, it produces higher power
consumption than the linear model in general.
ICSOFT 2011 - 6th International Conference on Software and Data Technologies
152
60
70
80
90
100
110
120
130
140
14:30:00
14:40:00
14:50:00
15:00:00
15:10:00
15:20:00
15:30:00
15:40:00
15:50:00
Power consumption (Watt)
Time
Our model
Actual power
(a) Our model and actual power consumption.
60
70
80
90
100
110
120
130
140
14:30:00
14:40:00
14:50:00
15:00:00
15:10:00
15:20:00
15:30:00
15:40:00
15:50:00
Power consumption (Watt)
Time
Fan’s model
Actual power
(b) Fan’s model and actual power consumption.
Figure 4: Comparison of estimated power consumption and actual power consumption when we execute the SPECpower.
4 CONCLUSIONS
Improving energy efficiency is becoming a key factor
in distributed systems. The most fundamental part is
to accurately and efficiently measure the power con-
sumption of a single system. In this paper, we pro-
posed a power consumption model which considers
the intrinsic power management of processors and the
thermal effect. Our model fairly fits the actual power
consumption for CPU intensive and moderate bench-
mark programs. Our future work is to infer the CPU
temperature through utilization so that we can support
systems which do not have CPU temperature sensors.
ACKNOWLEDGEMENTS
This research was supported by Future-based Tech-
nology Development Program through the National
Research Foundation of Korea (NRF) funded by
the Ministry of Education, Science and Technology
(20100020731).
REFERENCES
Andersen, D. G., Franklin, J., Kaminsky, M., Phanishayee,
A., Tan, L., and Vasudevan, V. (2009). FAWN: a fast
array of wimpy nodes. In Proceedings of the ACM
SIGOPS 22nd symposium on Operating systems prin-
ciples, SOSP ’09, pages 1–14, New York, NY, USA.
ACM.
Caulfield, A. M., Grupp, L. M., and Swanson, S. (2009).
Gordon: using flash memory to build fast, power-
efficient clusters for data-intensive applications. In
Proceeding of the 14th international conference on
Architectural support for programming languages and
operating systems, ASPLOS ’09, pages 217–228,
New York, NY, USA. ACM.
Chun, B.-G., Iannaccone, G., Iannaccone, G., Katz, R., Lee,
G., and Niccolini, L. (2010). An energy case for hy-
brid datacenters. SIGOPS Oper. Syst. Rev., 44:76–80.
Fan, X., Weber, W.-D., and Barroso, L. A. (2007). Power
provisioning for a warehouse-sized computer. In Pro-
ceedings of the 34th annual international symposium
on Computer architecture, ISCA ’07, pages 13–23,
New York, NY, USA. ACM.
Harnik, D., Naor, D., and Segall, I. (2009). Low power
mode in cloud storage systems. In Proceedings of
the 2009 IEEE International Symposium on Paral-
lel&Distributed Processing, pages 1–8, Washington,
DC, USA. IEEE Computer Society.
Kansal, A., Zhao, F., Liu, J., Kothari, N., and Bhattacharya,
A. A. (2010). Virtual machine power metering and
provisioning. In Proceedings of the 1st ACM sympo-
sium on Cloud computing, SoCC ’10, pages 39–50,
New York, NY, USA. ACM.
Koller, R., Verma, A., and Neogi, A. (2010). Wattapp: an
application aware power meter for shared data centers.
In Proceeding of the 7th international conference on
Autonomic computing, ICAC ’10, pages 31–40, New
York, NY, USA. ACM.
Qureshi, A., Weber, R., Balakrishnan, H., Guttag, J.,
and Maggs, B. (2009). Cutting the electric bill for
internet-scale systems. In Proceedings of the ACM
SIGCOMM 2009 conference on Data communica-
tion, SIGCOMM ’09, pages 123–134, New York, NY,
USA. ACM.
Rivoire, S., Ranganathan, P., and Kozyrakis, C. (2008).
A comparison of high-level full-system power mod-
els. In Proceedings of the 2008 conference on Power
aware computing and systems, HotPower’08, Berke-
ley, CA, USA. USENIX Association.
SPECpower (2011). http://www.spec.org/power ssj2008.
Vasudevan, V., Andersen, D. G., Kaminsky, M., Franklin,
J., Kozuch, M. A., Moraru, I., Pillai, P., and Tan,
L. (2011). Challenges and opportunities for effi-
cient computing with fawn. SIGOPS Oper. Syst. Rev.,
45:34–44.
MODELING SYSTEM POWER CONSUMPTION CONSIDERING DVFS AND THERMAL EFFECT
153
