
A MULTI-LEVEL ARCHITECTURE FOR COLLECTING
AND MANAGING MONITORING INFORMATION
IN CLOUD ENVIRONMENTS
Gregory Katsaros, Georgina Gallizo, Roland Kübert, Tinghe Wang
HLRS, Stuttgart, Germany
J. Oriol Fitó
Barcelona Supercomputing Center (BSC), Barcelona, Spain
Daniel Henriksson
Department of Computing Science and HPC2N, Umeå University, Umeå, Sweden
Keywords: Cloud computing, Monitoring, Information management, Energy efficiency monitoring.
Abstract: While the Cloud computing paradigm is maturing and gaining wide acceptance, topics like Quality of
Service assurance and resource monitoring will remain active fields of investigation and research. In this
paper, we identify characteristics of the monitoring infrastructure in Cloud environments and we present a
new architectural approach. The proposed mechanism is spanning across different levels of the
infrastructure, providing monitoring data from the application, virtual and physical infrastructure as well as
energy efficiency related parameters. Apart from the collection mechanism, we present a monitoring
management and storage framework which lies above the infrastructure layer. By exploiting open source
APIs combined with custom components we have come up with a generic yet efficient solution, applicable
to public, private and hybrid Cloud scenarios.
1 INTRODUCTION
The emergence of the Cloud Computing paradigms
of Software as a Service (SaaS), Platform as a
Service (PaaS) and Infrastructure as a Service (IaaS)
along with the actual appearance of providers for
such services (Amazon, Google, VMware etc.), has
lifted the topic of monitoring resources, services and
applications into a new level. The definition and
design of computer system monitoring is definitely
not a new topic. Early back in the 70s there have
been initiatives regarding monitoring in the frame of
controlling cost and improving performance of
computing (Carlson, 1972). With the introduction of
new architectural approaches, new technologies and
different business models a brand new market place
has been created. In order for this market to be
prosperous and receive the acceptance of the
consumers, the Quality of Service (QoS) of the
Cloud infrastructure as well as of the provided
service must be ensured and effectively monitored
(Menychtas, 2009) (Ferretti, 2010). The use of
virtualization technologies, the distribution of the
infrastructure, the scalability of the applications and
the energy consumption metrics are just a few
challenges to be overcome towards the development
of an effective Monitoring system in the Cloud. This
paper presents a holistic Monitoring Infrastructure
solution which, through a multi-level architecture,
aims to address the abovementioned challenges.
2 PROBLEM DEFINITION
AND RELEVANT INITIAVES
Even though monitoring of computational resources
is a relatively old topic, the definition of a
mechanism for Cloud Computing is a complex
232
Katsaros G., Galizo G., Kübert R., Wang T., Oriol Fitó J. and Henriksson D. (2011).
A MULTI-LEVEL ARCHITECTURE FOR COLLECTING AND MANAGING MONITORING INFORMATION IN CLOUD ENVIRONMENTS.
In Proceedings of the 1st International Conference on Cloud Computing and Services Science, pages 232-239
DOI: 10.5220/0003388602320239
Copyright
c
SciTePress

problem due to the immaturity of the Cloud
paradigm and the lack of standards for all those new
service models (SaaS, PaaS, IaaS etc.). To this end,
there are several issues raised from the realization of
this new architectural and business model. The
abstraction of the physical infrastructure and the
virtualization of the execution environment are
fulfilling the End User requirements as much as the
Provider’s business model. On the other hand, the
introduction of those technologies and concepts not
only distinguish the management of each level
(infrastructure, services, platform etc.) but also
isolates the information generated from those. In the
use case of a public Cloud (e.g. Amazon WS), the
End User does not have access to the monitoring
information of the infrastructure and the
Infrastructure Provider does not have access to the
application monitoring data. Some may not see this
as a deficiency, but rather the actual objective of this
abstraction introduced by the Cloud. Even if this
statement is absolutely right, the metrics that should
be monitored and could indicate the performance of
the application must be revised. An example is that
resource utilization is no longer the absolute and
reliable indicator and we should start focusing on
different values such as the response time of the
application. From another perspective, when
realizing more sophisticated scenarios including
private Clouds and Cloud federations (Figure 1) the
requirements of the monitoring infrastructure are
more complex. The existence of different type of
information providers (service, virtual environment,
physical infrastructure, energy efficiency etc.) points
out that a centralized aggregation and management
of the data could really become more effective. The
extraction of cross-layer information could allow
multi-disciplinary evaluation of those data (risk,
cost, energy, trust) through certain tools/services.
Currently, there are various APIs and solutions
available managing each layer separately but not a
holistic approach that could serve different types of
monitoring information and use case scenarios. To
this end, the introduction of a powerful monitoring
management framework could allow certain
providers to offer Monitoring as a Service (MaaS).
In such scenario, a provider could expose services
through which users could have access to the
monitoring information either raw or post-processed.
There are some initiatives that try to cope with
the new requirements of Monitoring in Cloud
environments. The RESERVOIR project
(Rochwerger et. al., 2009) is an EC-funded research
initiative aiming at the development of a Cloud-
enabled ICT infrastructure that can offer services as
Figure 1: Cloud federation.
utilities. Within the context of the project the Lattice
framework (Clayman, 2010) has been developed and
released. Lattice is an open source, Java based,
monitoring API, which offers monitoring
capabilities for resources and services on virtualized
environments. It offers a quite big API but is up to
the developer’s effort to build the management
framework. In the same direction, EMOTIVE Cloud
middleware (EMOTIVE, 2009) provides
management and monitoring of virtualized
resources. The focus of EMOTIVE is mainly on the
creation and management of virtual machines (VMs)
but they offer also features for VM monitoring
through the Libvirt API (Libvirt, 2005). Finally there
have been other research initiatives such as the
IRMOS project (IRMOS, 2008) that spent effort on
the development of a Service Oriented monitoring
framework applicable in virtual environments
(Katsaros 2010). The monitoring solution provided
by IRMOS is twofold: collecting low-level
information from the infrastructure as well as high-
level data from the application execution. Since the
IRMOS monitoring mechanism is dependent on the
Globus Toolkit framework (Foster, 2006), which is a
Java based API, a significant load into VMs has
been introduced and certain limitations regarding the
interoperability of the system as a whole.
In this paper we present an architecture for
Monitoring that focuses on the aggregation of data
from multiple Information Providers, management
of that data and a Data Model designed for flexible
post-processing of that monitoring data. The goal is
to provide a holistic approach that will introduce an
abstraction layer on top of the various sources of
information of the Cloud paradigm and effectively
store, manage and offer that data to other
components or actors of the framework. In addition,
we dedicate some effort to defining the metrics and
mechanisms for measuring the energy efficiency of
the physical infrastructure. We utilize knowledge
A MULTI-LEVEL ARCHITECTURE FOR COLLECTING AND MANAGING MONITORING INFORMATION IN
CLOUD ENVIRONMENTS
233
and experience from other projects (GAMES, 2009)
and integrated into our approach components and
principles that will allow us to extend the sources of
monitoring information gathered. By acquiring such
a variety of information regarding the same
execution, the assessment tools that can be situated
on top of the monitoring framework can operate in
an effective way orchestrating the deployment and
utilization of resources. In the following sections, we
elaborate on the structure and the capabilities of the
designed system, while in the end we summarize the
added value of it along with some future extensions.
3 PROPOSED APPROACH
3.1 Monitoring Infrastructure Overall
Architecture
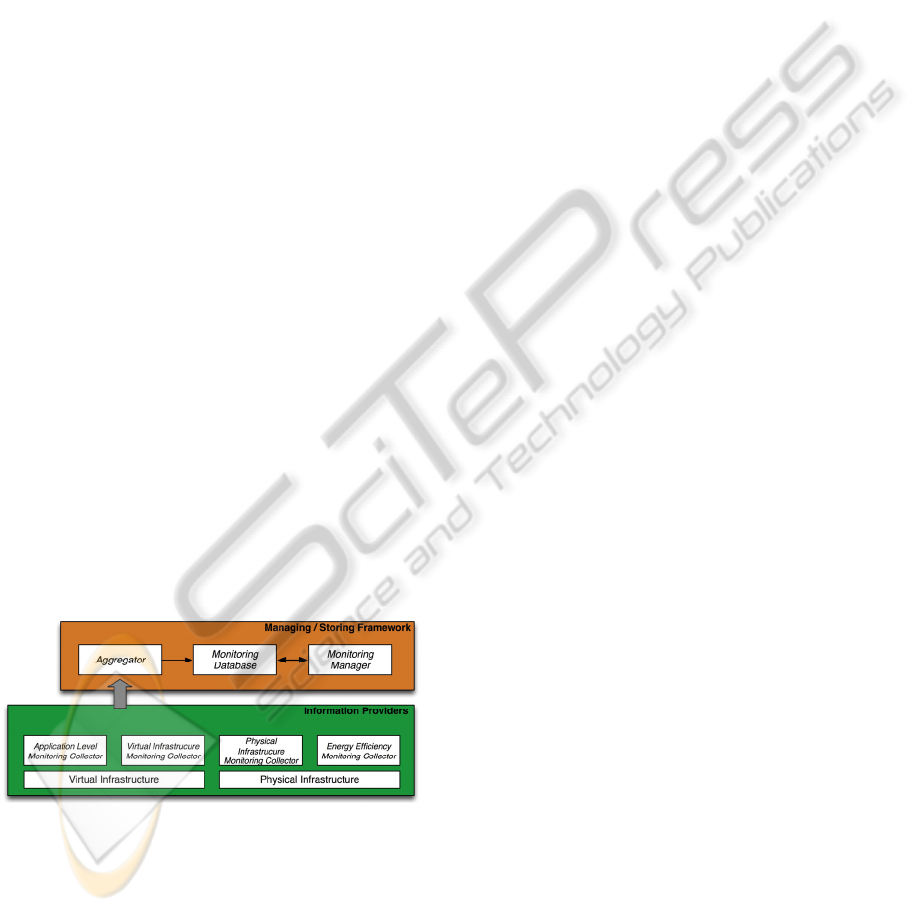
The proposed Monitoring Infrastructure architecture
is presented in Figure 2. Two different layers can be
distinguished:
• Information Providers: it comprises the
different sources where monitoring data is
collected from, as well as the components in
charge of collecting them (known as
“Collectors”). The Monitoring Infrastructure is
designed in a way that this layer is scalable,
allowing the incorporation of additional
sources, through the corresponding collectors.
• Managing / Storing of the data: this layer
includes those components in charge of
managing the data collected from the
monitoring information providers and storing
them in an aggregated database.
Figure 2: Architecture of Monitoring Infrastructure.
A more detailed description of the functionality
of each component of the infrastructure is described
in the following sections.
3.2. Monitoring Information Providers
3.2.1 Application Level Monitoring
Collector
This component collects high-level monitoring
information from the applications or services that are
being executed within the virtual environment.
The challenge is to extract data from inside VMs
and to make this available to the hosting site,
preferably without introducing tight dependencies
between the software in the VM and the surrounding
environments. This is a common problem for
monitoring of application or service based metrics in
all VMs that is not yet well studied.
The subcomponents responsible for reading and
publishing the monitoring data are sometimes
referred to as 'probes'. In, for example, Lattice, there
is normally a separate probe for each value that is to
be measured. Probes measuring some value (for
example current number of users using an Apache
Web server) can be reused in several different
services without modification. The alternative is to
have a custom data collector for each type of
service, managing all interesting values from a
single virtual machine.
A common data model for application or service
data has to be shared between the probes themselves
(producing the data) and the higher-level
components consuming the data, but the collector
software should be kept agnostic to the contents of
the application data.
Regardless of how the data passes through the
barriers of the virtual machine, an external data
collector component is responsible for making the
data available to the upper level of the monitoring
infrastructure. This may be done either in a pushing
manner, notifying the monitoring system when new
data is available, or in a pulling manner, exposing an
interface which allows pulling data on demand. The
Aggregator component of the Monitoring
Infrastructure (c.f. section 3.3.2) will generally
access the data via the pulling interface, on demand,
in order to avoid it to be overloaded by data being
pushed.
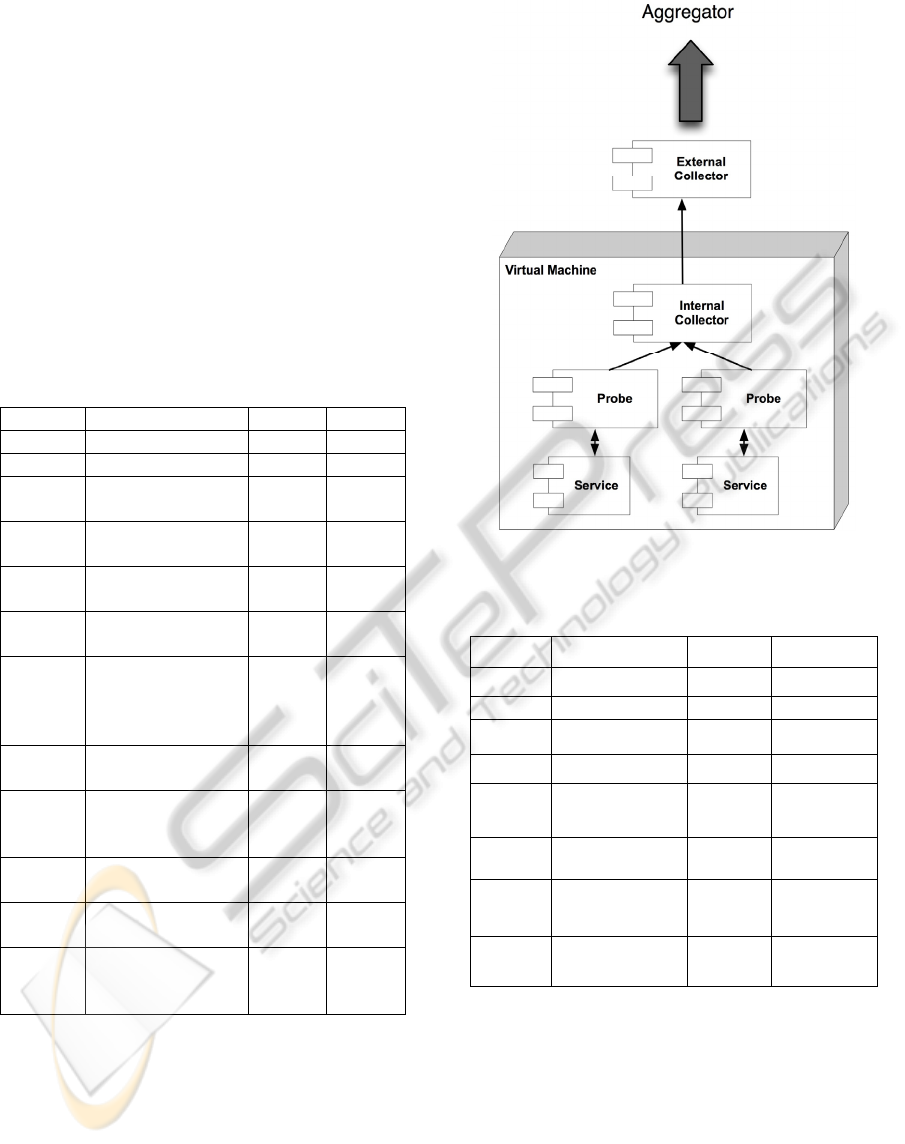
The diagram in Figure 3 shows a general
scenario for service-level monitoring. Data is
collected inside the virtual machine by some
component(s), which are either small probes or
fewer but more potent components. The collected
data is then externalized and forwarded to an
external component that is responsible for making
the data available to the common monitoring system
(Aggregator).
CLOSER 2011 - International Conference on Cloud Computing and Services Science
234
3.2.2 Virtual IT-Infrastructure Monitoring
Collector
Mainly, this component collects virtual IT-
infrastructure monitoring data (e.g. VM parameters).
All this monitoring information is returned by the
system in a XML document, similar to the outputs of
the Ganglia Monitoring System (Ganglia, 2000).
Additionally, we support getting monitoring
information from different virtualization
environments through the use of the Libvirt
virtualization API.
In particular, the set of virtual IT-infrastructure
parameters collected by this component are
described in the following table:
Table 1: Virtual IT-Infrastructure Parameters.
Parameter Description Data type Example
State The VM’s state String Running
IP address IP address of a VM String x.y.z.w
Virtual
domain
The virtual domain where a
VM is running
String dom0
Architecture
The system’s architecture of
a VM
String x86
# CPUs
The number of CPUs
available on the VM
Integer 4
CPUs’ speed
The speed of the CPUs (in
MHz)
Integer 3000 MHz
CPU allocated
The CPU capacity
(i.e. #CPUs*100)
dynamically assigned to a
VM
Integer 300
CPU usage
The current usage of CPU
(in %)
Float 0.25
Memory
The amount of memory (in
megabytes) allocated to a
VM
Integer 1024 MB
Memory
Usage
The current usage of
memory (in %)
Float 0.118
Bandwidth
The bandwidth of a VM (in
Kbytes/sec)
Integer
10
Kbytes/sec
Disk space
The amount of disk space
(in megabytes) available in
a given VM
Integer 2048 MB
3.2.3 Physical IT-infrastructure Monitoring
Collector
This component collects monitoring data regarding
the physical infrastructure. In particular to this kind
of monitoring information, we are able to obtain the
measurements as shown in Table 2.
Figure 3: Architecture diagram for Application Level
Monitoring Collector.
Table 2: Physical IT-Infrastructure Parameters.
Parameter Description Data type Example
IP address
IP address of a physical
node
String x.y.z.w
Architecture The node’s architecture String Amd64
CPUs
The number of CPUs
of a node
Integer 8
CPUs’
speed
The speed of the CPUs
(in MHz)
Integer 3000 MHz
Memory
The amount of memory
(in megabytes) of a
given node
Integer 8192 MB
Free
Memory
The amount of free
memory (in
megabytes)
Integer 2048 MB
Bandwidth
The bandwidth
available on the node
(in Kbytes/sec)
Integer 10 Kbytes/sec
Disk space
The amount of disk
space (in megabytes)
available in a node
Integer 1000000 MB
The implementation of this Monitoring Collector
is based on the Nagios tool. By setting specific
service checks we are able to obtain the presented
parameters with a certain time interval. In order to
forward the data to the next layer (Aggregator) we
extended the NDOUtils plugin (NDOUtils, 2006)
and created a Push interface. Our custom plugin
sends an XML structure to the Aggregator every
time that a service check is being executed. Figure 4
shows the structure and the operation of the
collector:
A MULTI-LEVEL ARCHITECTURE FOR COLLECTING AND MANAGING MONITORING INFORMATION IN
CLOUD ENVIRONMENTS
235
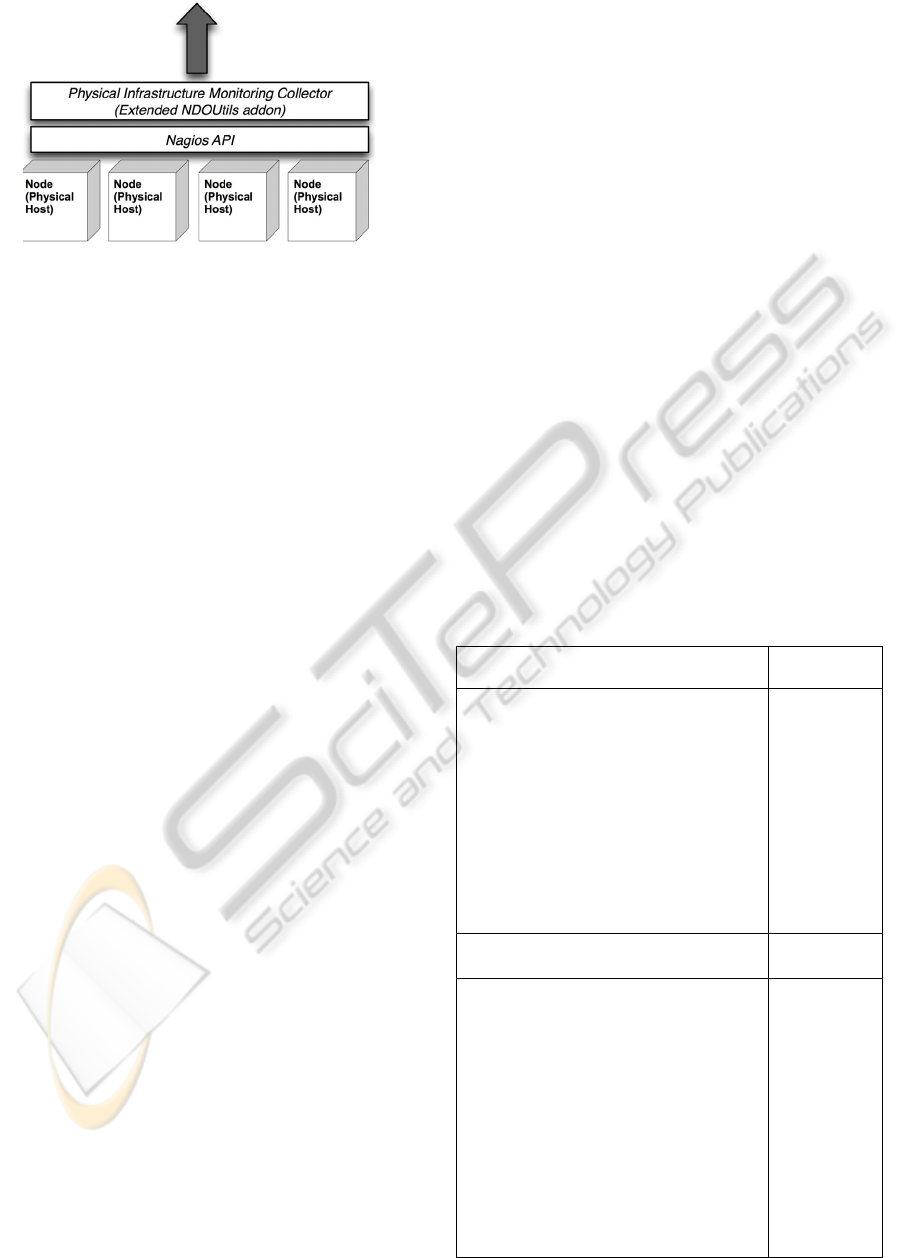
Figure 4: Physical Infrastructure Monitoring Collector.
3.2.4 Energy Efficiency Monitoring
Collector
Current methodologies for measuring and allocating
energy and carbon to IT are still very immature. In
order to get meaningful information, energy use and
associated carbon emissions must be measured in
association with tasks, resources, usage and other
workload parameters in the IT infrastructure.
Furthermore, they may vary from data center to data
center and other factors, such as the place, time of
day, measurement point, etc.
In the proposed approach we are using the
methodology of the GAMES project as a starting
point (D2.1 GAMES, 2010). In this context, the
monitoring and assessment of energy efficiency is
performed through different metrics, known as Key
Performance Indicators (KPIs) and Green
Performance Indicators (GPIs). Those indicators are
derived from variables that are measured and
monitored in the system at different levels of the
data center:
• Facilities (energy consumption of the
cooling / heating system, energy consumed by
the UPS, etc.)
• Single server (energy consumption by a single
compute node, CPU speed of a compute node,
etc.)
• Cluster server (aggregated information, as
average and absolute values, of all single servers
that are part of the cluster)
• Storage system (e.g. energy consumption,
workload, IO/second for different kinds of
read/write operations)
• Virtual systems associated with concrete services
deployed in the cloud infrastructure, such as
virtual machines, virtual storage and application
containers (power consumption per virtual
machine, percentage of virtual machine used by a
service/application, number of processes running
per application, etc.)
The abovementioned variables (KPIs and GPIs)
depend not only on parameters related purely to
energy consumption, but also on other information
collected by different Monitoring Collectors,
depending on the source level they are coming from
(Physical IT-Infrastructure, Virtual IT-Infrastructure,
Application/Service Level, Energy Efficiency). The
Energy Efficiency Monitoring Collector (which is
the focus of this concrete section) is in charge of
collecting only those parameters which are directly
related to energy consumption or carbon emissions,
and that are not collected by other collectors in the
infrastructure. This includes variables such as
temperature data, which is directly affecting others
like energy consumed by cooling systems. Once the
single measurements are collected, the KPIs and
GPIs necessary for energy efficiency assessment are
calculated at the Aggregator level (c.f. section
3.3.2).
We adopted the classification of GPIs and KPIs
as described in GAMES project (D2.1 GAMES,
2010) which defines: IT Resource Usage GPIs,
Application Lifecycle KPIs, Energy Impact GPIs,
and Organizational Factors GPIs. The most relevant
ones are included in Table 3.
Table 3: Energy Efficiency Parameters: GPIs and KPIs
(c.f. Appendix section).
IT Resource Usage GPIs
Application
Lifecycle KPIs
CPU Usage
Memory Usage
I/O Usage
Storage Usage
Corporate Average Data centre Efficiency
(CADE)
Data Centre Density (KWatts / m3)
Space, Watts and Performance (SWaP)
Deployed Hardware Utilization Ratio (DH-UR)
Deployed Hardware Utilization Efficiency (DH-
UE)
Response Time
Process
Time/Job
Duration
Throughput
Availability
Rate
Reliability
Recoverability
Application
Cost
Energy Impact GPIs
Organizational
Factors GPIs
Application Performance Indicators (e.g.
Transactions/KWh; FLOPS/KWh)
Power Usage Efectiveness (PUE)
Data Center Infrastructure Efficiency (DCiE)
Compute Power Efficiency (CPE)
Data Centre Energy Productivity (DCEP)
Data Centre Performance Efficiency (DCPE)
Coefficient of Performance of the Ensemble
(COP Ensemble)
CO2 Emission
Other energy efficiency indicators (e.g. Processor
Performance (MHz/Watt); Data transferred/Watt;
Storage Capacity/Watt; I/O transactions/Watt)
Compliance
Indicator
(compliance
with
government
regulations)
Infrastructural
Costs
Carbon Credit
Return of Green
Investments
(RoGI)
CLOSER 2011 - International Conference on Cloud Computing and Services Science
236
3.3 Managing / Storing the Data
3.3.1 Monitoring Manager
The Monitoring Manager component serves as the
orchestrator of the whole Monitoring process. The
role of this component is actually twofold and
includes the capabilities of: controlling the
Monitoring process (start/stop actions) and
providing the necessary interfaces towards other
internal components of the Cloud infrastructure (e.g.
Monitoring Evaluators and assessment tools, c.f.
section 4) as well as to other external consumers of
monitoring information (e.g. a Graphical User
Interface etc.). The importance of this component is
very high while it realizes the gateway for the
monitoring information to the rest of the Cloud
framework.
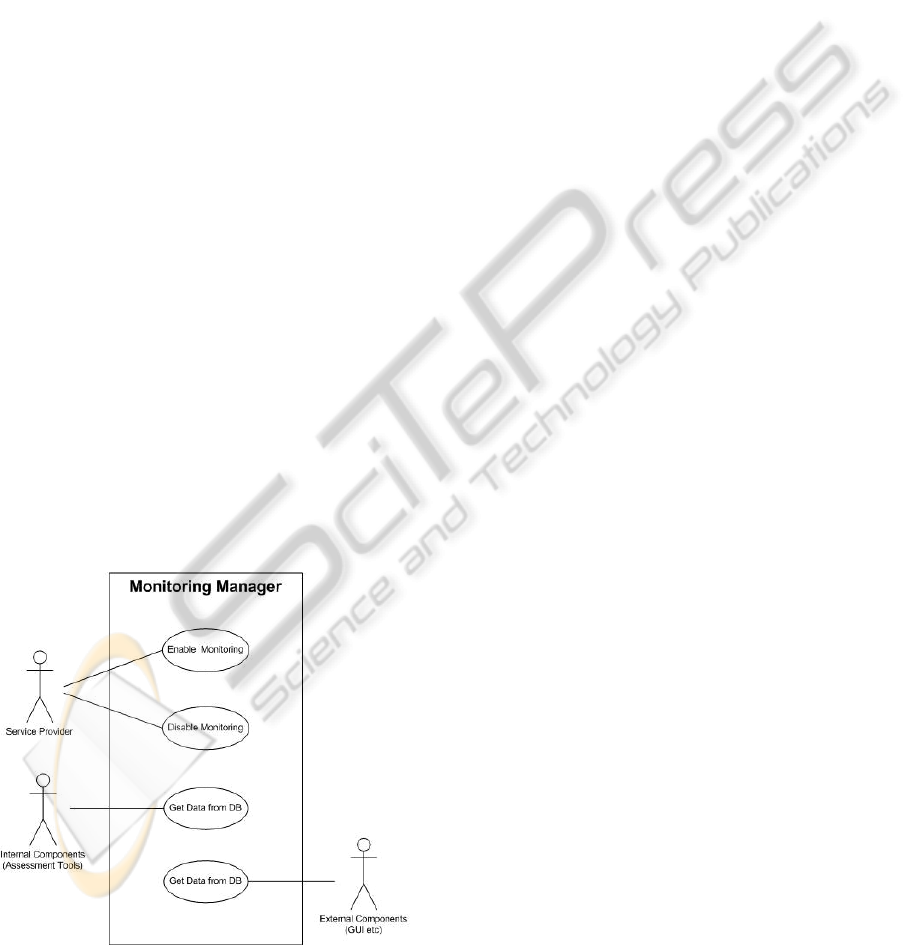
Three major actors have been identified as the
consumers of the interfaces exposed by the
Monitoring Manager (Figure 5):
• The Service Provider (SP) will be controlling
the monitoring process by using the respective
interfaces (Enable, Disable etc.).
• The assessment components of the Cloud
Infrastructure (Cost Assessment, Risk
Assessment, Energy Assessment tools etc.)
will interact with the Monitoring Manager in
order to receive Monitoring information from
the DB regarding some past executions.
• Finally, the external components that want to
have access to the data stored in the database,
such as a GUI, will have to interact with the
Manager components as well.
Figure 5: Monitoring Manager Use Cases.
3.3.2 Aggregator
As it can be understood from the name, the role of
this component is to collect, aggregate and store the
monitoring information coming from various
Information Providers. The challenge but at the
same time the objective when implementing that
component is the development of a lightweight
mechanism that effectively combines information
that comes from difference levels (from high-level
application monitoring to low-level energy related
data). A list of the capabilities of the Aggregator is
presented below:
• Performance oriented implementation:
efficient coding that allows the aggregation
process to be completed almost in real-time.
• Twofold operation: the component exposes a
REST interface (Fielding et. al, 2002) and
through a POST method any Information
Provider can submit a dataset. In addition to
that Push implementation, the Aggregator can
acquire data with a Pull mechanism. That
operation is realized through a configurable
file that includes the list of available
Information Providers. The type of those
providers and its respective collector (Nagios,
Ganglia, Globus etc.), the access path (URL,
MySQL, path etc.) as well as the time interval
of the data collection action will be defined in
that file with a certain syntax. The Aggregator
will then parse that file and create a custom
thread for each case in order to pull the
monitoring data.
• Storing the information to a database: the
outcomes of the aggregation are various
records, towards a database which follows the
schema of the designed data model (c.f.
section 3.4). The specific schema supports the
consistency of the collected data and allows
the effective extraction of information for
post-processing.
• Buffer of records: the Aggregator is able to
store temporary into a resource the last
aggregated record from the received data. An
interface for accessing those records is
provided in order for the assessment tools, and
other components of the framework to have
access to the monitoring information in real-
time (without accessing the database).
In Figure 6 we present the interfaces that the
Aggregator component exposes and the interaction
with the database:
A MULTI-LEVEL ARCHITECTURE FOR COLLECTING AND MANAGING MONITORING INFORMATION IN
CLOUD ENVIRONMENTS
237
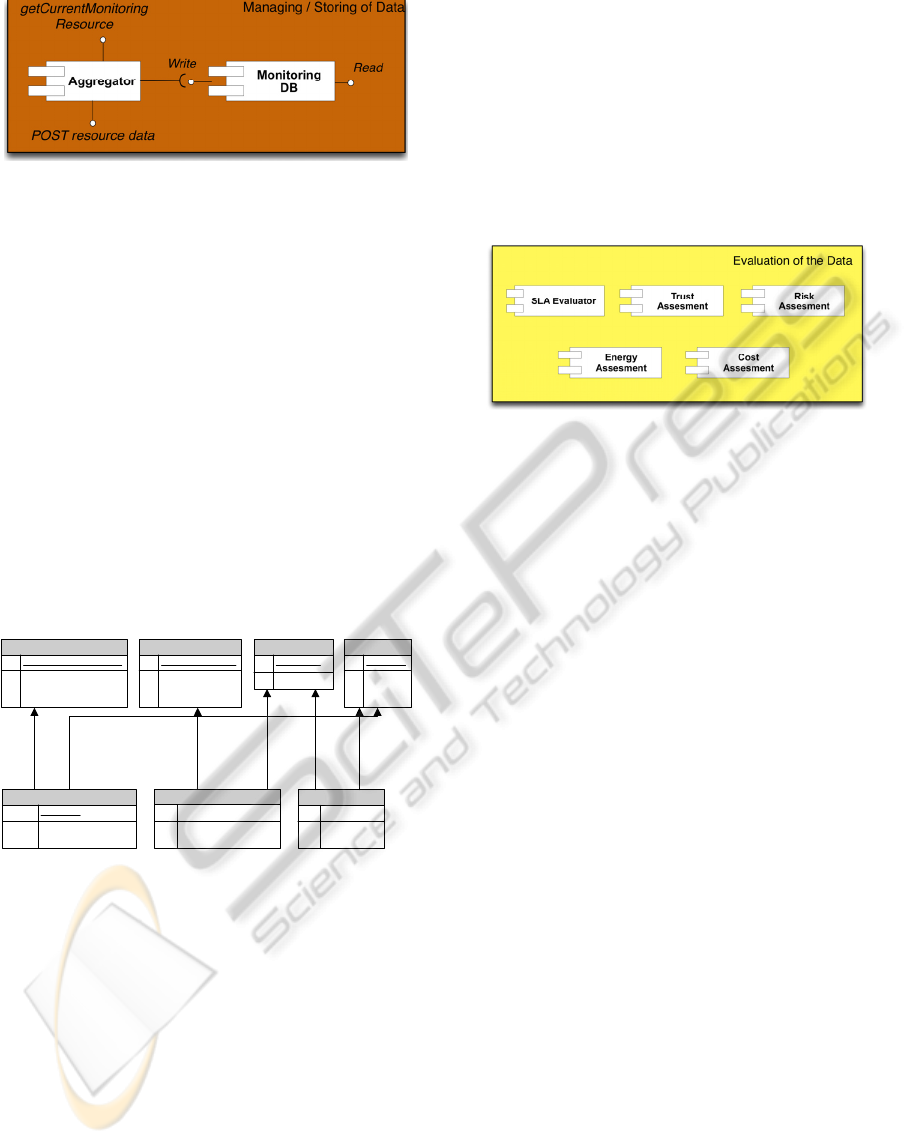
Figure 6: Interfaces of Aggregator and interaction with
DB.
The Aggregator offers two interfaces, one
towards the collectors (POST resources data), in
order to receive the monitoring information and
create related resources/entries to the database, and
one towards the rest of the framework in order for
the assessment tools and other components (such as
a Monitoring Stream interface etc.) to have direct
access to the last entry.
3.4 Data Model
Every monitoring solution for distributed and
services oriented architectures needs a well defined
data model in order for the collected information to
be managed efficiently. In that context, we have
designed a generic but yet consistent with the
proposed architecture data model (Figure 7).
SERVICE-IP
PK,FK1 service_ID
FK2 infrastructure_provider_ID
virtual_machine_ID
INFRASTRUCTURE_PROVIDER
PK infrastructure_provider_ID
name
contact
details
SERVICE
PK service_ID
name
type
details
MANIFEST
PK manifest_ID
service_details
MANIFEST_SERVICE
FK1 manifest_ID
FK2 service_ID
SERVICE_PROVIDER
PK service_provider_ID
name
contact
details
SERVICE_PROVIDER_SERVICE
FK1 service_provider_ID
FK2 manifest_ID
Figure 7: Proposed Data Model.
The major entities identified are the
Infrastructure Provider (IP) and the Service Provider
(SP). The first is obviously the one who offers IaaS
through his virtual infrastructure over physical hosts.
The second is interacting with the IP by deploying
his own services on the virtual machines in order to
offer SaaS to customers. The Manifest entity
presented in Figure 7 is actually the definition of a
service while the Service entity is an instance
generated from the respective Manifest. As a result,
there is a one-to-many relationship between the
Manifest and the Service entities. In addition, each
SP owns several Manifests from which he can
instantiate and deploy different services. Finally,
while any IP can host several service instances we
have defined the SERVICE-IP relationship in order
to keep track of the deployments.
4 FUTURE WORK
Within our future plans is to populate the framework
with several evaluation and assessment tools as an
extra hierarchical level on top of the management
and storage layer.
Figure 8: Evaluation layer.
As presented in Figure 8, we have identified a
number of evaluators starting from Service Level
Agreement (SLA) and including Trust, Risk, Cost as
well as Energy Assessment tools. Each one of those
components will interact with the Monitoring
Manager in order to acquire the historical data from
the database but also will communicate with the
Aggregator directly in order to get the last dataset
from the buffer and proceed to direct assessing, such
as SLA violation detection. Overall, the post-
processing of the data and the assessment of the
monitoring information will allow us to optimize the
resource utilization, identify the relation of the high-
level service deployment with the low-level energy
consumption, reduce the related costs, and diminish
risks and uncertainties when managing Cloud
environments. Furthermore, the Trust assessment
tool will assist us on drawing useful conclusions
regarding the relationships between customers,
services and their impact on resources.
5 CONCLUSIONS
In this paper we investigated briefly the
requirements of the monitoring infrastructure for
Cloud-enabled architectures and presented the latest
initiatives in that direction. We proposed an
architectural approach that is utilizing several open
source APIs (Nagios, Libvirt etc.) yet offering an
efficient, dynamic and scalable monitoring solution.
The designed mechanism involves monitoring
information collected from the physical hosts, virtual
host and applications/services. We have also
CLOSER 2011 - International Conference on Cloud Computing and Services Science
238

considered the collection of data regarding the
energy efficiency of the infrastructure. The topic of
monitoring on Service Oriented and Cloud
architectures will remain a field of active research
and development while the Cloud paradigm evolves
from being a trend to become a widely accepted
computing technology.
ACKNOWLEDGEMENTS
This work has been supported by the OPTIMIS
project (A.J. Ferrer et. al., 2010) and has been partly
funded by the European Commission’s ICT activity
of the 7th Framework Programme (FP7-ICT-2009-5)
under contract number 257115.
REFERENCES
Carlson, G. et.al, How to Save Money With Computer
Monitoring, Proceeding of the ACM Annual
Conference, ACM Press, Boston MA, USA, 1972
Rochwerger, B., Breitgand, D., Levy, E., Galis, A., Nagin,
K., Llorente, L., Montero, R., Wolfsthal, Y., Elmroth,
E., Cá
́
ceres, J., Ben-Yehuda, M., Emmerich, W., and
Galán, F. The RESERVOIR Model and Architecture
for Open Federated Cloud Computing, IBM Journal of
Research and Development, Vol. 53, No. 4. (2009)
Andreas Menychtas, Dimosthenis Kyriazis, Konstantinos
Tserpes, Real-time reconfiguration for guaranteeing
QoS provisioning levels in Grid environments, Future
Generation Computer Systems, Volume 25, Issue 7,
July 2009, Pages 779-784, ISSN 0167-739X.
Ferretti, S.; Ghini, V.; Panzieri, F.; Pellegrini, M.; Turrini,
E., "QoS–Aware Clouds," Cloud Computing
(CLOUD), 2010 IEEE 3rd International Conference
on, vol., no., pp.321-328, 5-10 July 2010
Clayman, S., Galis, A., Mamatas, L., Monitoring Virtual
Networks With Lattice, Network Operations and
Management Symposium Workshops (NOMS
Wksps), 2010 IEEE/IFIP, pp. 239-246
EMOTIVE Cloud, Elastic Management of Tasks In
Virtualized Environments, 2009, http://www.emotive
cloud.net/
Libvirt API, 2005, http://libvirt.org/
IRMOS Project, Interactive Realtime Multimedia
Applications on Service Oriented Infrastructures,
2008, http://www.irmosproject.eu/
Katsaros, G. et. al, A Service Oriented Monitoring
Framework for soft real-time applications, Service
Oriented Computing and Applications 2010, Perth,
Australia
Foster, I., Globus Toolkit Version 4: Software for Service-
Oriented Systems, IFIP International Conference on
Network and Parallel Computing, Springer-Verlag
LNCS 3779, pp 2-13, 2006.
GAMES Project, Green Active Management of Energy in
IT Service centres, 2009, http://www.green-
datacenters.eu/
Ganglia, 2000, http://ganglia.sourceforge.net/
Nagios Monitoring system, 2007, http://www.nagios.org/
NDOUtils addon, 2006, http://exchange.nagios.org/
directory/Addons/Database-Backends/NDOUtils/details
D2.1 GAMES, Layered Green Performance Indicators
Definition, project, June 2010
Fielding, R., et. al, Principled Design of the Modern Web
Architecture, ACM Transactions on Internet
Technology 2002
A. J. Ferrer, F. Hernandez, J. Tordsson, E. Elmroth, C.
Zsigri, R. Sirvent, J. Guitart, R.M. Badia, K.
Djemame, W. Ziegler, T. Dimitrakos, S.K. Nair, G.
Kousiouris, K. Konstanteli, T. Varvarigou, B. Hudzia,
A. Kipp, S. Wesner, M. Corrales, N. Forgo, T. Sharif,
and C. Sheridan, “OPTIMIS: a holistic approach to
cloud service provisioning”, First IEEE International
Conference on Utility and Cloud Computing (UCC
2010)
OPTIMIS Project, 2010, http://www.optimis-project.eu/
APPENDIX
CADE = Facility Efficiency (FE) * Asset Efficiency (AE),
where FE = Facility Energy Efficiency (FEE) * Facility
Utilization (FU), AE =IT Energy Efficiency (ITE) * IT
Utilization (ITU)
SWaP = Performance / (Space * Power Consumption)
DH-UR = n° servers running live applications / total
n° servers deployed
DH-UE = min. n° servers to handle peak load / total
n° servers deployed
PUE= Total Facility Power / IT Equipment Power
DCiE = IT Equipment Power / Total Facility Power
CPE=DCiE / IT Equipment Utilization
DCEP = output of data centre (bytes) / total energy for
data centre (kWh)
DCPE = effective IT workload / total facility power
COP Ensemble = Total Heat Dissipation / (Flow
Work + Thermodynamic Work) of cooling system
A MULTI-LEVEL ARCHITECTURE FOR COLLECTING AND MANAGING MONITORING INFORMATION IN
CLOUD ENVIRONMENTS
239
