LIFE SCIENCES VIEWING ROOM
Bart M. ter Haar Romeny
1
, Mark (L. C. M.) Bruurmijn
1
, Laurens E. O. Leeuwis
1
and Y. Kang
2
1
Department of Biomedical Engineering, Eindhoven University of Technology
Den Dolech 2, 5612 AZ, Eindhoven, The Netherlands
2
Sino-Dutch Biomedical and Information Engineering School of Northeastern University
11-3 Lane, WenHua Road, Shenyang, China
Keywords: Medical images, PACS, Life sciences, 3D viewing, Reading room, Education.
Abstract: A radiological picture archiving and communication system (PACS) has been installed at the department of
Biomedical Engineering of TU/e for student and researchers use. The availability of large sets of high
resolution 3D image data sets, and the extensive interactive 3D manipulation possibilities, turn out to be an
important support and stimulation for the students in their projects. The system can be considered an
ultimate interactive 3D anatomy book.
1 INTRODUCTION
Medical images play a crucial role in the diagnostic
process. It is estimated that 80% of all diagnoses are
done based on images. They are made in huge
numbers, with a wide variety of medical imaging
devices, such as X-ray systems, CT and MRI
scanners, ultrasound systems, PET scanners, etc.
Almost every modern hospital is now equipped with
a medical image database, accessible from a large
number of places throughout the hospital. Such a
system is called ‘Picture Archiving and
Communication System’ (PACS) (Huang 2010).
Typically it contains several tens of terabytes of
information, and has now fully replaced the film-
based archive and viewing.
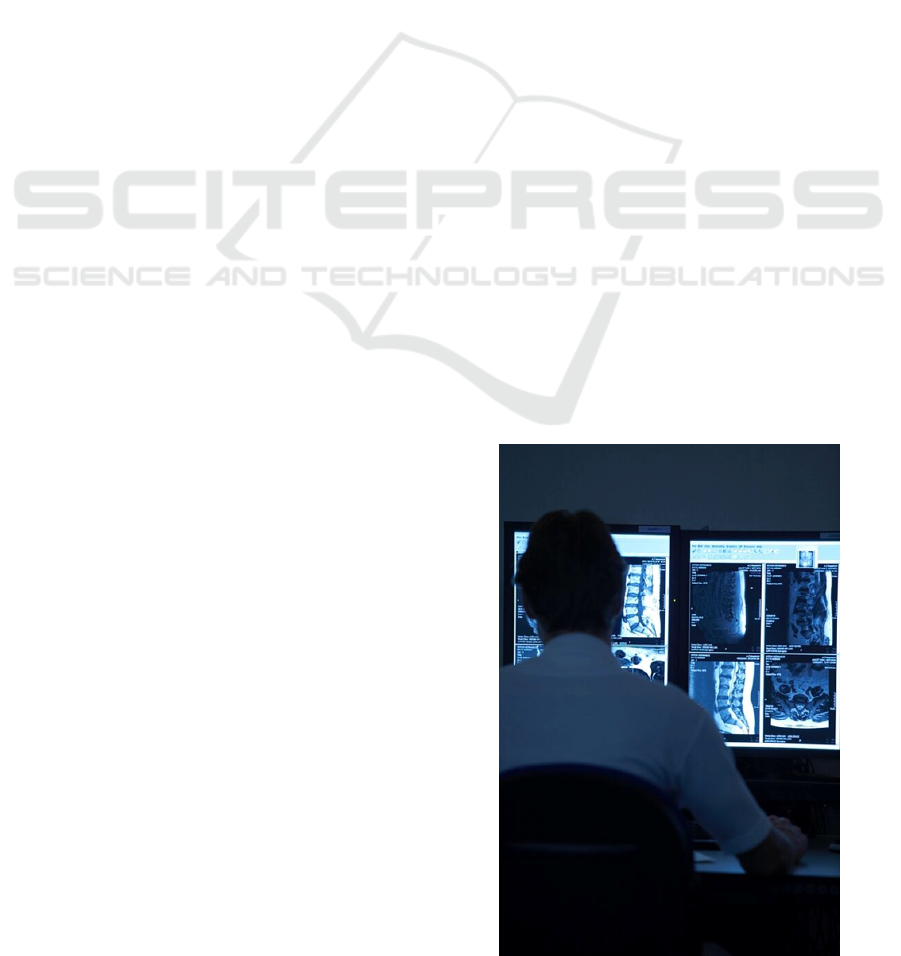
Viewing (also called ‘reading’) of the images, in
order to do the diagnosis, and comparing the current
exam with previous ones, is typically done in a
‘reading room’ (figure 1), on a PACS viewing
system. Such a system is not only capable of
browsing quickly in the database and retrieve the
image data, but also has a wide range of additional
functions, such as interactive 3D viewing, slicing of
3D data in any direction, automated detection of
anomalies such as polyps, narrowed bloodvessels
(stenosis), diminished perfusion, etc. (Beutel et al.
2000]. Modern medical image analysis software is
able to perform these tasks (ter Haar Romeny 2007,
Fitzpatrick 2009). The field of ‘computer-aided
detection and diagnosis’ is rapidly evolving. PACS
has a positive influence on the education of
radiologists in training (Mullins et al. 2001). At
technical universities, where students are trained to
become a specialist / engineer in medical image
analysis, such valuable patient datasets are often not
available, or only in limited numbers and types.
Figure 1: Reading room at a radiology department.
445
M. ter Haar Romeny B., (L. C. M.) Bruurmijn M., E. O. Leeuwis L. and Kang Y..
LIFE SCIENCES VIEWING ROOM.
DOI: 10.5220/0003353704450448
In Proceedings of the 3rd International Conference on Computer Supported Education (CSEDU-2011), pages 445-448
ISBN: 978-989-8425-49-2
Copyright
c
2011 SCITEPRESS (Science and Technology Publications, Lda.)
We installed a PACS for student use at the
Biomedical Engineering Department of Eindhoven
University of Technology, the Netherlands. This
system contains an exhaustively complete set of
anonymized high resolution 2D and 3D medical
imaging datasets of a wide range of modalities,
primarily of normal subjects. The system has a fast
GPU based 3D viewing mode for huge datasets. As
such, it forms a rather unique, fully interactive
anatomy book.
2 LIFE SCIENCES VIEWING
ROOM
The acquisition of two PACS workstations from the
company Rogan Delft is made possible by a
generous gift of the Eindhoven University Fund
(UFE). These two workstations, communicating
over a gigabit network with a 1 TB server-side
database, are set up in the so called Life Sciences
Viewing Room, which is given a prominent place in
the department. Both workstations consist of a
powerful pc with 4 GB RAM and an NVidia GTX
8800 graphics card (GPU). The data can be viewed
using three professional Eizo medical displays: two
Radiforce G22 monitors (black-and-white, 10 bit
colordepth, 2 megapixel) and one Radiforce R22
color display.
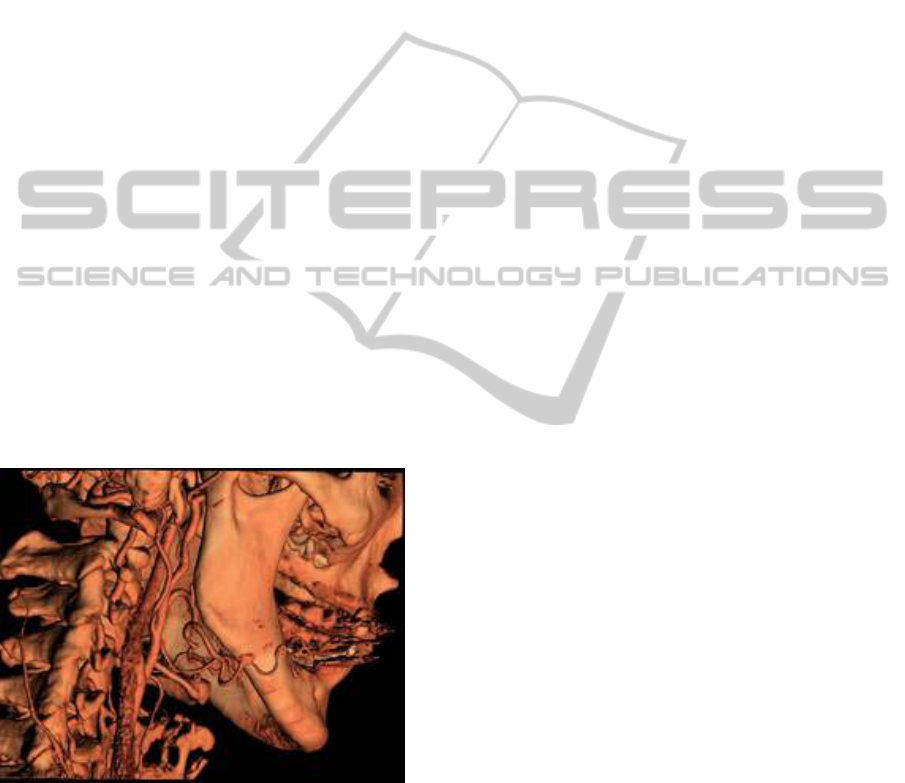
Figure 2: 3D view of the carotid arteries with severe
stenosis. CT data. Courtesy: 3mensio Inc.
The high graphical performance of the workstations
allows software like 3viseon by the Dutch company
3mensio Medical Imaging BV to render astounding
volumes in real time on the GPU (Figure 2). This
adds a very special dimension to the system. The
students can interactively inspect any anatomical
part of the body, be it from CT or MRI data, zoom,
rotate, cut away views, fly through intestines or
blood vessels, do measurements, and act just like a
professional radiologist during his careful inspection
of the data. The system is also equipped with extra
software for grabbing movies of any screen action,
enabling the student to make promotional material
for his project presentation, or show these proudly at
home.
The two systems are located in the experimental lab
of the department, and are fulltime accessible. For
one of the systems a dedicated room is constructed
with dimmable lighting, and theatre sitting for 16
people, for discussions and presentations.
The medical 2D and 3D datasets are collected
from collaborating hospitals and industry, and from
general accessible databases on the internet,. The
system may currently be one of the most complete
interactive anatomy books around. The available
data are mostly of normals, with some pathology.
This serves the purpose of general viewing for the
students. If a project is done on e.g. heart valves,
these can be studied interactively and in full detail in
3D on the system. Next to medical data the system is
now filled with images from the life sciences—the
reason why the facility is calles Life Sciences
Viewing Room—such as microscopy from a wide
range of microscopes available in the Biomedical
Engineering Department (conventional light,
confocal, and 2-photon scanned laser microscopes),
and high field (6-9 Tesla) small bore MRI systems
for small animal imaging.
Two student assistants are appointed to fill the
system with relevant high resolution, high quality
data. The system now has a rather complete set of
anatomical areas, with many modalities, and is
growing. About 250 datasets are currently available.
The book Gray’s Anatomy is located on the user’s
desk for reference. The graphical user interface
(GUI, Figure 4) of the system is designed by these
assistants, enabling a first graphical selection on
anatomical region, then modality, then a specific
patient, and finally a specific dataset of that patient.
All data are in the standard DICOM format (DICOM
– Digital Imaging and Communications in Medicine,
a universal standard adopted by the medical imaging
industry and community), and have been carefully
anonymized. To further prevent any chance of
recognizing the face of a patient, We exchange data
with a similar database in our sister BMIE School in
Shenyang, China. There, the 3D viewing and
manipulation software is based on the PACS viewer
of Neusoft Inc.
CSEDU 2011 - 3rd International Conference on Computer Supported Education
446
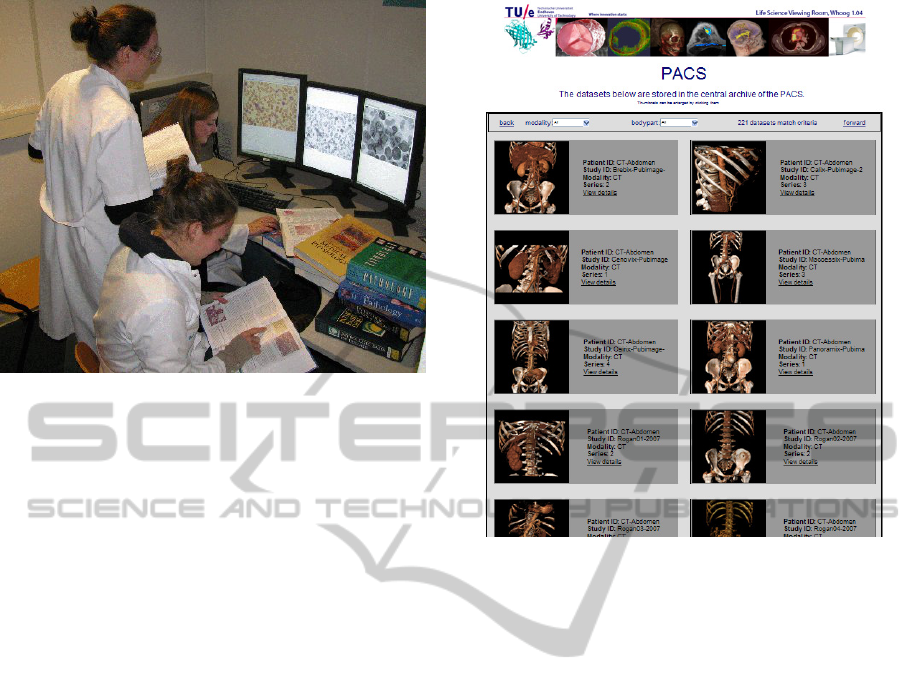
Figure 3: Students active with the casus to analyse micro-
scopy images of blood cells for pathology.
3 ROLE IN EDUCATION
The system can be accessed at all times by all
students. It is however also part of the regular
curriculum. Two courses exploit the new interactive
viewing capabilities. During the so-called Skills-
Labs, at the end of the last year of the Bachelor
curriculum, the students have to generate
demonstration movies of 3D manipulation of a
specific and specified anatomical region, answering
specific question about the 3D anatomy such as
‘where exactly is the polyp located’, ‘what is the
shortest distance of the kidney surface to the skin’,
‘what is the diameter of the carotid artery just above
the bifurcation’. Students work in pairs during these
labs.
A second course is a so-called casus, a first-year
BSc project of six weeks for groups of eight students
(Figure 3), entitled Image Processing for Pathology.
In this casus students build an automated system to
assist the pathologist to analyze cells from
microscopy images. They need to ‘find the sick cells
among the healthy ones’. They are free in the
selection of the type of disease, type of images, and
task to solve. An interesting spirit of competition
emerges between the typically 8-10 groups of
students simultaneously active. The cell analysis
software is developed in Wolfram’s Mathematica 7.
The Life Sciences Viewing Room facility is used
to view and inspect the data, and to run a dedicated
program (Huygens, by SVI Inc.) to sharpen the
microscopy images by deconvolution. The actual
working and experimenting with this program gives
Figure 4: User interface with thumbnails to quickly select
a particular 3D dataset.
them a much better understanding of the underlying
theoretical principles of deconvolution, which are
non-trivial for most students.
In our sister BMIE school in Shenyang, China,
we have set up a new curriculum with emphasis on
Design Centered learning. We foresee that their
copy of the Life Sciences Viewing Room will enable
the same ‘explorative urge’ of the students, and
facilitate the use of extended datasets in current
projects of research on image analysis and
visualization.
4 DISCUSSION
The system is much appreciated by the students.
Besides the already developed virtual anatomy book,
the ambition is to have the Life Sciences Viewing
Room grown into a pivot of biomedical images for
the faculty, containing images from all research
areas in the department, which can be used for
various educational goals. It also turns out to have
an attractive role in demonstrations of the current
status in biomedical imaging, for visiting parents
and new employees alike.
This system is easy to build, and might benefit of
joining a network of users, who each supply new
LIFE SCIENCES VIEWING ROOM
447

and additional datasets in a shared database to each
other. For patient security, care should be taken to
properly anonymize all data, to prevent any chance
of recognition. Students appreciate the ‘playing with
data’, are introduced to the many sophisticated
viewing applications, and embrace it as an exciting
new tool for fast and visual image manipulation and
analysis, be it for medical or life sciences data.
ACKNOWLEDGEMENTS
We like to thank the sponsors of the PACS system,
Rogan Delft BV, Organon, Unilever, 3mensio Medi-
cal Imaging, the TU/e BME department and Olym-
pus ‘58 en ‘74/ESC, and Neusoft Medical Systems
Inc. for the availability of the 3D PACS viewing
software.
REFERENCES
PACS:http://en.wikipedia.org/wiki/Picture_archiving_and
_communication_system
Beutel, J., Kim, Y., Display and PACS, SPIE Press, 2000.
DICOM standard: http://medical.nema.org/.
Fitzpatrick J. M., Sonka M., Handbook of Medical
Imaging, Volume 2. Medical Image Processing and
Analysis. SPIE Press Monograph Vol. PM80/SC,
2009.
Huang, H. K., PACS and Imaging Informatics: Basic
Principles and Applications. John Wiley and Sons,
2010.
Mullins ME, Mehta A, Patel H, McLoud TC, Novelline
RA.Impact of PACS on the education of radiology
residents: the residents' perspective. Acad Radiol.
8(1):67-73, 2001.
Rogan PACS viewing software: http://www.ncdcorp.com/
vpx_viewer.php
Silva-Lopes, V. W., Monteiro-Leal, L. H., Creating a
Histology–Embryology Free Digital Image Database
Using High-End Microscopy and Computer
Techniques for On-Line Biomedical Education, The
Anatomical Record (part B: New Anat.) 273B:
126–131, 2003.
ter Haar Romeny, B. M., Image Processing on Diagnostic
Workstations, in: Image Processing in Radiology,
Current Applications (E. Neri, D. Caramella, C.
Bartoluzzi, Eds.), Springer Verlag, 2007.
Website Life Sciences Viewing Room: http://bmia.bm
t.tue.nl/lsvr.
CSEDU 2011 - 3rd International Conference on Computer Supported Education
448
