
Novel Method of the Noise-Reduction in 3D X-Ray
Computed Tomography
N. S. Kulberg
1
, T. V. Yakovleva
1
, Yu. R. Kamalov
2
, V. A. Sandrikov
2
L. V. Osipov
3
and P. A. Belov
3
1
Dorodnicyn Computing Centre of the Russian Academy of Science
Vavilova st., 40, Moscow 119333, Russian Federation
2
National Research Centre of Surgery
Abrikosovsky per. 2, Moscow 119992, Russian Federation
3
Izomed, ltd
Timiryazevskaya st. 1 corp. 2 Moscow 127422, Russian Federation
Abstract. There is described a novel technique of the noise suppression in
X-Ray computed tomography (CT) images. At describing this technique a spe-
cial attention is paid to the subsequent 3D reconstruction of the human body in-
ternal structures being investigated. The work has been implemented under the
support of the Russian Foundation of Basic Research (RFBR), project № 08-01-
12011-ofi.
1 Introduction
The necessity of the noise reduction in CT images is caused by the fact that the con-
trast of the soft tissues X-ray images is rather small (congruous to the noise level or
even less than noise), so that it does not allow separating the useful elements of an
image from the noise. By means of the visual analysis of two-dimensional picture a
qualified specialist is able to see and to identify the details of interest even in signifi-
cantly noised image. However in many practical cases it has appeared to be impossi-
ble to acquire the accurate 3D images of the needed structures by means of the soft-
ware algorithm being used for the volume image reconstruction. At the same time the
3D computed tomography reconstruction of images is an important (in some cases
necessary) diagnostic tool. That’s why the expanding of the scope of its application is
rather an actual task. The principle advantages of 3D reconstruction are as follows:
1) The possibility of the detailed examination of an object of interest in various
planes and at various angles;
2) The possibility of making measurements of the volumes of objects having the
complicated geometrical shape;
3) The possibility of getting a more clear and demonstrative representation of the
specific interconnections of various anatomic formations and structures.
These advantages of 3D reconstruction increase the diagnostic informative capacity
at the examination by means of multi-slice spiral computed tomography (MSCT),
enhance the operator’s assurance in diagnose conclusion and, besides, provide the
non-specialists in ray diagnostics the possibility of evaluating the results of the pro-
S. Kulberg N., V. Yakovleva T., R. Kamalov Y., A. Sandrikov V., V. Osipov L. and A. Belov P. (2010).
Novel Method of the Noise-Reduction in 3D X-Ray Computed Tomography.
In Proceedings of the Third International Workshop on Image Mining Theory and Applications, pages 92-99
DOI: 10.5220/0002963200920099
Copyright
c
SciTePress

posed diagnostic method rather clearly what in its turn allows determining the proper
tactics of the patients’ cure.
The diagnostics informative capacity of 3D reconstruction of the computed tomo-
graphy images in its many aspects is caused by the quality of initial images, especially
by the ratio of the useful information to the noise, what is of special importance at
contrasting the objects of interest for their further more detailed analysis.
2 Comparison with Similar Techniques
The principle point of the traditional and mostly investigated techniques of the digital
images noise suppression consists in frequency and statistical filtering [1]. However
the techniques based upon just a simple filtration work mainly without taking into
account the differences in geometrical properties between the useful and the noise
elements of an image. That is why these techniques have appeared to be of low effi-
ciency and they are not widely used in practice.
There is a significant number of papers which investigate the approaches based
upon the threshold processing of wavelet-transformation of an image [2]. The further
development of the idea of wavelet-transformation has lead to the so-called curvelet
transform that implies the basis decomposition functions to be determined to not only
a scale of the image elements but also to their angular attitude [3].
The most well-known commercial product in the field of the image improvement
techniques is the GOPView technology that has been elaborated by Swedish company
ContextVision [4]. Besides of other fields of application this technology is used for
the purposes of computed tomography images improvement. The operation of this
technique is characterized by a common approach at which the image under investiga-
tion is described by means of a set of vector “features”, so that the vector’s direction
characterizes the “class” of an object (for example, the orientation of the boundary
between two areas) and the vector’s length characterizes the so-called “certainty” of
the feature’s revealing. In this technique an image processing is implemented by
means of the determination of the “features” fields and by their consequent analysis.
In an approach that is proposed by us in the present paper these is no need in an in-
termediate step of the above-mentioned technique. Namely, in our approach the step
of the “features” separation and analysis is absent: just the elements of the initial
image are directly subjected to the analysis and filtration. The so-called «transparency
masks», being used in our technique are well adapted to the image elements with
various angular attitude. This is a distinctive feature of our technique if compared
with the wavelet-filtration. At the same time the proposed technique is significantly
simpler from the viewpoint of the computational complexity than the curvelet trans-
form.
3 Brief Description of the Noise Suppression Technique
In the present work we apply the method that was previously elaborated by us for the
acoustic images noise suppression. The applicability of such an approach to images of
93

different physical nature will be considered below. Let us describe here the principles
of the processing algorithm operation. The papers [5,6] present a detailed description
of this algorithm.
An initial image
fx, y
()
can be presented as a following sum:
fx, y
()
= M
0
x, y
(
)
+ m
0
x, y
(
)
(1)
Here
m
0
x, y
()
is a small-scaled image structure including mainly the information
about small elements of an initial image.
The function of the large-scaled structure
M
0
x, y
()
= fx, y
(
)
∗ψ x, y
(
)
(2)
contains the information about rather large elements of an initial image and can be
calculated by means of the application of a low frequency filter (LFF) to the initial
image function
fx, y
()
. Here the function ψ x, y
(
)
is a pulse characteristic of the
LFF, and the sign
∗ means convolution.
For the construction of improved image we use the auxiliary “reconstruction func-
tion”
Rx, y
()
for macro-structure and rx, y
(
)
for micro-structure:
f
E
x, y
()
= M
1
x, y
(
)
+ m
1
x, y
(
)
=
= Rx, y
()
M
0
x, y
()
+ rx, y
()
m
0
x, y
()
(3)
The functions
Rx, y
()
and rx, y
()
represent the numerical criteria of the “usefulness”
of any element of the image.
To determine the function
Rx, y
(
)
a simple threshold algorithm is applied what al-
lows increasing the brightness of the output image at the boundaries of the extended
bright areas and near the points of significant brightness jumps.
The function
rx, y
()
is determined by the following formula
rx, y
()
=αm
0
x, y
()
∗ψ
1
x, y
()
γ
(4)
where
ψ
1
x, y
()
represents a pulse characteristic of the LFF and the parameters α
and
γ
are the user-tuned parameters of the algorithm.
This algorithm was elaborated for the ultrasound diagnostics images speckle-noise
suppression. At developing the mathematical foundation of this algorithm we have
proved the spatial spectrum of such a noise decreases with the frequency increase in
average inversely proportional to the frequency
~
1
Ω
, while the spatial spectrum of
the useful elements of an image is characterized by the decrease velocity
~
1
Ω
2
. This
difference between the spectrum decrease velocities for various image elements is the
main point of the “transparency masks” construction algorithm for the image texture
noise suppression.
94

4 The Applicability of the Method for CT Images Processing
First of all, one should consider if the approaches having been developed for the ultra-
sound images processing are applicable to the processing of computed tomography
images or not, as the physical principles of these images construction are absolutely
different.
The common principles of the X-ray computed tomography are well known [7],
and there is no need to describe them here in detail. Let us describe here only the
aspects that are of principle importance for the operation of our algorithm.
The ultrasound speckle-noise is determined by he interference of the waves of ra-
ther big wavelength (of the order of sub-millimeters) and, consequently, its spatial
correlation radius is comparable with the wavelength.
The nature of the noises in computed tomography image is quite different. Such an
image is obtained by means of the digital processing of a lot of transmission X-ray
shots. There are two principle mechanisms of the noise appearance in an X-ray image:
the fluctuation of X-ray quanta number that is registered by a receiver surface unit
(the so-called quantum noise), and also the fluctuations caused by the characteristics
of the digital receiver elements. In digital systems both mentioned noise components
have a zero radius of the spatial correlation, and, consequently, are characterized by
the non-decreasing spectrum (the so-called “white noise”). There is a third component
of the noise caused by the influence of the secondary irradiation, but we shall not
consider it here, as it is negligibly small in modern X-rays systems.
The number of the registered by the receiver quanta is obeyed to the Poisson’s dis-
tribution. In practice due to the central limit theorem we get a normal distribution with
the average value and the dispersion proportional to the value
I
0
μ
, where I
0
is the
intensity of the initial irradiation, and
μ
is the average linear coefficient of the irradi-
ation attenuation in a medium.
At formation a tomography image a set of transmission pictures is subjected to the
Radon transform. As this transformation is linear, both above mentioned estimations
remain valid: the tomography image noise remains “white” and obeys to the normal
distribution.
As the formula (4) is derived by us just based upon the fact, that the noise spectrum
decreases slower than the image useful element spectrum, it is evident that this formu-
la for the mask of the small-scaled structure reconstruction is applicable in the case of
computed tomography images as well. On the other hand, as the noise obeys to the
normal distribution, one can confirm that for the extended homogeneous areas of an
image the function
M
0
x, y
()
gives the best estimation of the sampled average value.
At the present time the separate two-dimensional slices of a tomography images
are subjected to the processing (although in a perspective the possibility to expand
this method for a three-dimensional case is also considered). The read-offs of an ini-
tial tomogram come to the processing in Hounsfield units (HU), which are derived
from the linear absorption coefficient
μ
by the following expression:
Hx, y
()
= 1000 ×
μ
x, y
(
)
−μ
w
μ
w
95

where μ
w
is the coefficient of the irradiation absorption in a distilled water. The pro-
posed algorithm of the calculation of a function
Rx, y
(
)
does not work correctly with
the initial values
H
, that’s a reverse transformation of these values to the values of
the linear coefficient
μ has to be implemented.
5 The Conditions of the Clinical Measurements
In the process of the computed tomography investigations implementation a series of
strictly spatially oriented (according to the assigned parameters) 2D images sets is
obtained.
The initial data (the series of 2D CT images) are obtained at multi-slice spiral
computed tomograph (MSCT) Somatom V2 of Siemens company (Germany) at usage
of a standard three-phased protocol of the liver examination.
This protocol consisted of : 1) native phase (without contrasting); 2) arterial phase
and 3) venous (portal) phase with contrasting. For obtaining the arterial and venous
phases 100 ml of contrast solution (Omnipak 350 and Vizipak 320) were introduced
via bolus injection into the ulnar vein through the 18-20 G catheter.
The parameters of computed tomography images for the phases of contrasting were
the same: 160—200 mA (depending upon the patients constitution), 120 kV, the vi-
sion field of 30—40 cm, collimation of 1,5 mm and 3 mm, the table velocity: 12,5
mm/rotation, the rotation velocity: 0,5 sec. The reconstructions were implemented
every 0,8 mm for arterial phase, and every 1,5 mm for venous phase. The average
density in the liver vessels after contrasting was at least by 30 HU higher than the
average density of the liver parenchyma.
By using the knowledge about the disposition of 2D images in 3D space and apply-
ing the special algorithm a 3D array of computed tomography data has been obtained.
An analysis of the series of CT images was implemented at the workstation MultiVox
2D/3D, realized at a personal computer within the compound of an automated radiol-
ogy system (ARIS MULTIVOX, Russia). The techniques developed in the present
work have been implemented as a software package called RASP System
®
. The im-
age processing program and a detailed report on the clinical trials is available at
http://www.rasp.su.
Depending upon the diagnostics purposes for each of three phases of the examina-
tion protocol the following modes of the 3D visualization were used:
1) The multi-planar visualization with the choice of an arbitrary cut or without it;
2) Segmentation of the objects of the interest based on the density thresholds (“au-
tomatic” segmentation) or manual segmentation of the objects of interest. For Multi-
Vox 2D/3D at the segmentation of the liver vessels the method of their extraction
from 3D data array by the threshold density with the subsequent manual linking or the
objects having the similar density and being distanced from each other by 1 voxel;
3) The volume visualization with or without minimal or maximum intensity projec-
tions;
4) The combination of various modes, the usage of various of “transparency” con-
ditions.
96
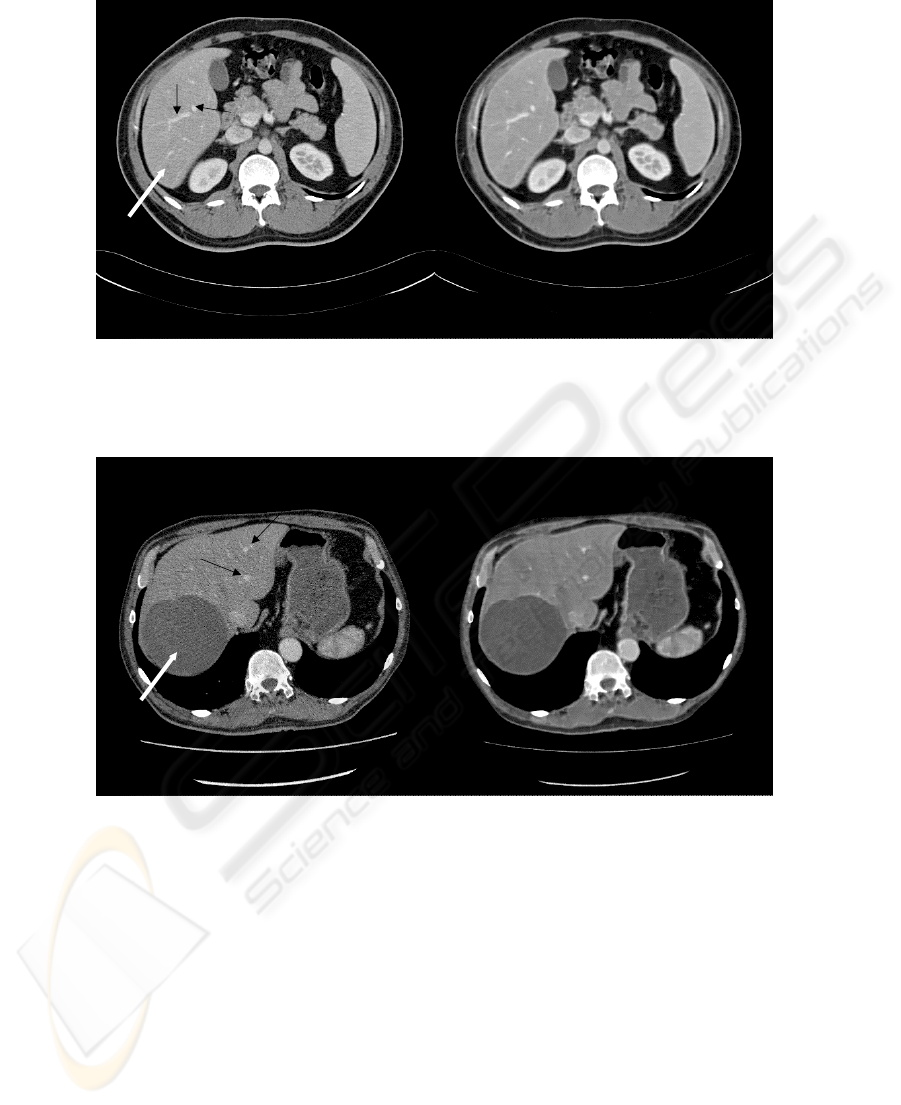
Fig.1. Two-dimensional slices of tomography images before and after the processing at an
average level of noising the picture. Liver (thick white arrow), contrasted vessels (thin black
arrows). The principle attention was paid to the improvement of the contrasted liver vessels
visualization.
Fig. 2. Two-dimensional slices of tomography images before and after the processing at high
level of the picture noising. The liver focal lesion (thick white arrow), the contrasted vessels
(thin black arrows).
Some results of an image processing are presented in the paper. The Fig. 1 and Fig.
3 illustrate the results of the processing of tomography images with an average noise
level. The most significant result is the vessels contrast enhancement. The utility of
such a processing is rather better seen in 3D reconstruction. Due to significant noise
reduction and contrast enhancement one can see greatly better vessels and kidneys
macroanatomy details.
97
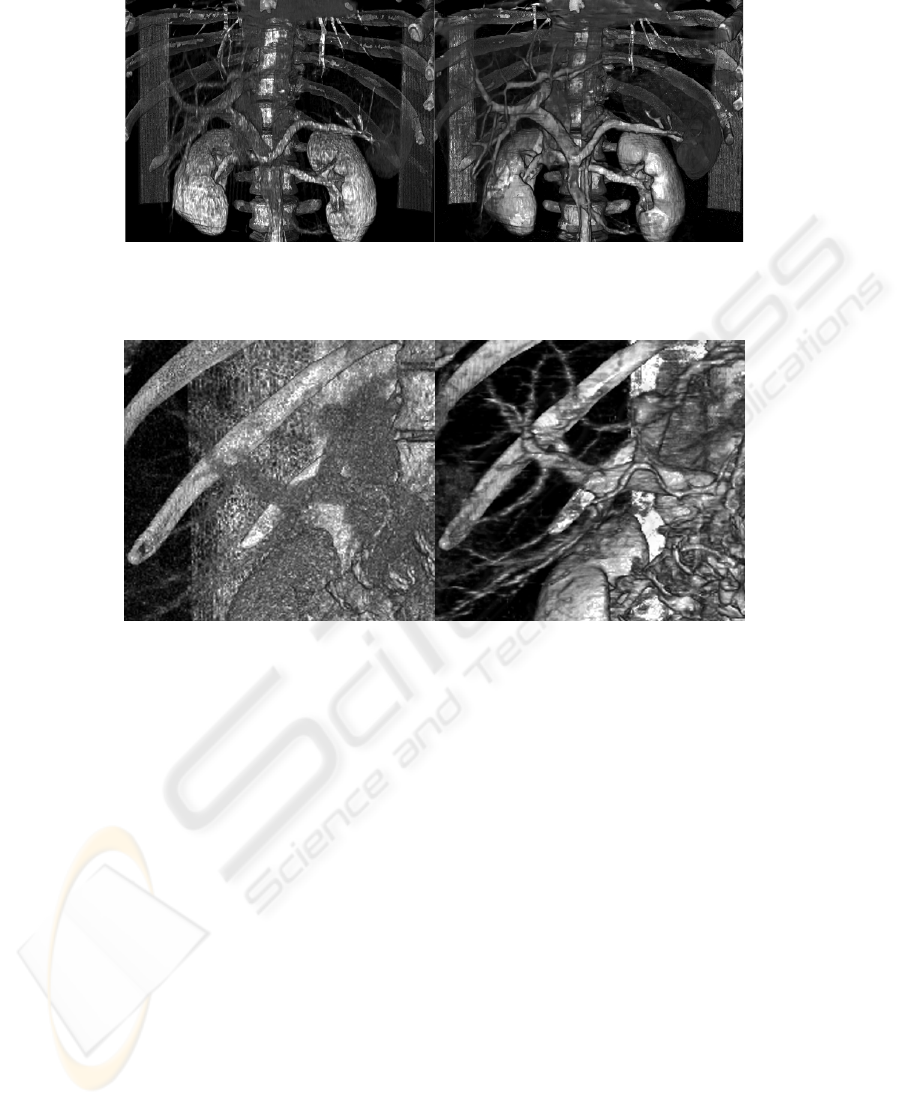
Fig. 3. The three-dimensional reconstruction of a tomography images before and after the
processing at an average level of the picture noising. The contrasted liver vessels (portal vein,
kidney veins).
Fig. 4. The three-dimensional reconstruction of a tomography images before and after the
processing at the strong level of the picture noising. The contrasted liver vessels.
Fig. 2 and Fig. 4 illustrate the processing of a strongly noised tomography images.
In this case the analysis of even two-dimensional cross-sections may appear to be
rather difficult, while in processed images the vessels are seen significantly better.
The three-dimensional reconstruction of this tomography images has not yielded the
desired results: the liver vessels either are not visualized at all or are presented by the
dotted areas (what makes it impossible, in particular, to implement the evaluation of
their volume). At reconstruction of the processed tomography images one can visual-
ize vessels significantly more clearly; in this case they are visualized without breaks.
6 Conclusions
The elaborated technique allows an efficient suppressing the noise of computer tomo-
graphy images and ensures a significantly improved three-dimensional reconstruction
of the objects under examination.
The object “liver” and the case of 3D computed tomography images have been
chosen just as an example. The application of 3D visualization is possible at any type
98

of 2D tomography images (ultrasound, CT, MRT) and practically in any part of the
human body (from head to foot).
References
1. R. Gonsalez and R. Woods, Digital Image Processing, second ed. Prentice Hall, 2001;
2. Semler, L.; Dettori, L.; Furst, J. Wavelet-based texture classification of tissues in computed
tomography. 18th IEEE Symposium on Computer-Based Medical Systems, 2005. Proceed-
ings. Volume , Issue , 23-24 June 2005, pp. 265—270
3. Jean-Luc Starck, Emmanuel J. Candès, and David L. Donoho. The Curvelet Transform for
Image Denoising. IEEE Transactions on Image Processing, vol. 11, No. 6, June 2002, pp.
670—684
4. Official site of the ContextVision company http://www.contextvision.com;
5. Kulberg N. S., Yakovleva T. V., Kamalov Yu. R., Sandrikov V. A.Osipov L. V., Belov P.
A. The Elaboration and Clinical Testing of a New Technique of Image Quality Improve-
ment in Ultrasound Medical Diagnostics, Proceedings of the Second International Work-
shop on Image mining, Theory and Applications in conjunction with VISAAP 2009, Lis-
bon, Portugal, February 2009, pp. 63—72.
6. Kulberg N. S., Yakovleva T. V., Kamalov Yu. R., Sandrikov V. A.Osipov L. V., Belov
P. A., Development and Trial of a New Method of Image Enhancement for Ultrasonic Med-
ical Diagnostics, Acoustical Physics, 2009, vol. 55, № 4—5, pp. 538—546.
7. S. Webb et al. The Physics of Medical Imaging. IOP Publishing Ltd, 1988
99
