
CONSTRUCTING THE HYBRID DITHERING MATRIX WITH
EQUAL CLUSTERED DOT DENSITY
Xu Guoliang and Tan Qingping
Computer College, National University of Defense Science and Technolgy, Changsha Hunan, China
Keywords: Image Halftone, Dithering Matrix, Geometry Subdivision, Delaunay Triangulation, PSNR.
Abstract: Hybrid halftone has great strengths over amplitude and frequency modulated halftone in offset printing.
Modern CTP systems employ hybrid dithering algorithm, because dithering algorithm is a very efficient
halftone algorithm. The shapes, distribution and density of clustered dots in halftone images depend on
hybrid dithering matrix. This research proposes a new method to construct a hybrid dithering matrix with
equal clustered dot density, based on a new geometry subdivision derived from Delaunay Triangulation.
The matrix helps increase clustered dot density and maintain constraints of the offset printing procedure.
This paper also discusses the uniformity of expanded central point set and quality of quadrilaterals of the
geometry subdivision by comparing PSNR and quality factor value with that of the previous work.
1 INTRODUCTION
Halftone images are classified into three categories
in terms of dot shape and distribution: AM, FM and
Hybrid halftone images. (1) Amplitude Modulated
(AM) halftone uses different size of clustered dots to
represent different grey values. Each clustered dot
belongs to a dot unit tiled in the halftone plane. It is
better if the percentage of black pixels in the dot unit
equals to the average grey value of the pixels in the
same location of the continuous tone image. AM
halftone is often used in laser printer, laser copier
and traditional offset printing. (2) Frequency
Modulated (FM) halftone randomly distributes dots
(pixels) of output device and uses dot density to
represent grey value. Dot density is defined as the
number of dots in a unit area. The dot density of FM
halftone is usually much higher than that of AM
halftone. High dot density will make a smooth edge
for line works and fine patterns. FM halftone fits for
high resolution devices, such as ink jet printer. (3)
Hybrid halftone dots vary both in size and density of
clustered dots to represent different grey values. It
combines the advantages of both AM and FM
halftone and is widely used in CTP (Computer to
Plate) systems.
In most cases, all halftone algorithms are often
described as the following three computing
procedures: point procedure, neighbouring point
procedure and iteration procedure. Algorithm of
point procedure is very simple and highly efficient
in speed. One typical point procedure, dithering
algorithm, requires a dithering matrix that will be
tiled in halftone plane. When a dithering algorithm
halftones a continuous tone image, it first compares
the value of the pixels of continuous tone image with
the element values of dithering matrix in the
corresponding position. Then, it sets the halftone
pixel to “0” or “1”, if the pixel value of the
continuous tone image is greater or less than the
value of the element of the matrix. Halftoning with
dithering matrix is often referred to as screening.
This research originates from the observation of
the unbalanced clustered dot densities shown in
Figure 1 and Figure 2 together. It is a vital issue for
hybrid halftone to maximize dot density in halftone
image and maintain the constraints of offset printing
procedure. There are two constraints of offset
printing procedure: (1) a minimum clustered dot size
that could be reliably reproduced in print; (2) a
standard dot gain curve of offset printing. The
positive clustered dot size in the light region and the
negative clustered dot size in the shadow are small,
when the clustered dot density is high. Therefore, we
balance the dot density in the highlight and shadow
of hybrid halftone image at all grey levels in order to
maximize the clustered dot density.
The main contributions of this research are: (1)
propose a new geometry subdivision of the halftone
plane, of which all the faces (or regions) are quadri-
61
Guoliang X. and Qingping T. (2010).
CONSTRUCTING THE HYBRID DITHERING MATRIX WITH EQUAL CLUSTERED DOT DENSITY.
In Proceedings of the International Conference on Imaging Theory and Applications and International Conference on Information Visualization Theory
and Applications, pages 61-67
DOI: 10.5220/0002830400610067
Copyright
c
SciTePress
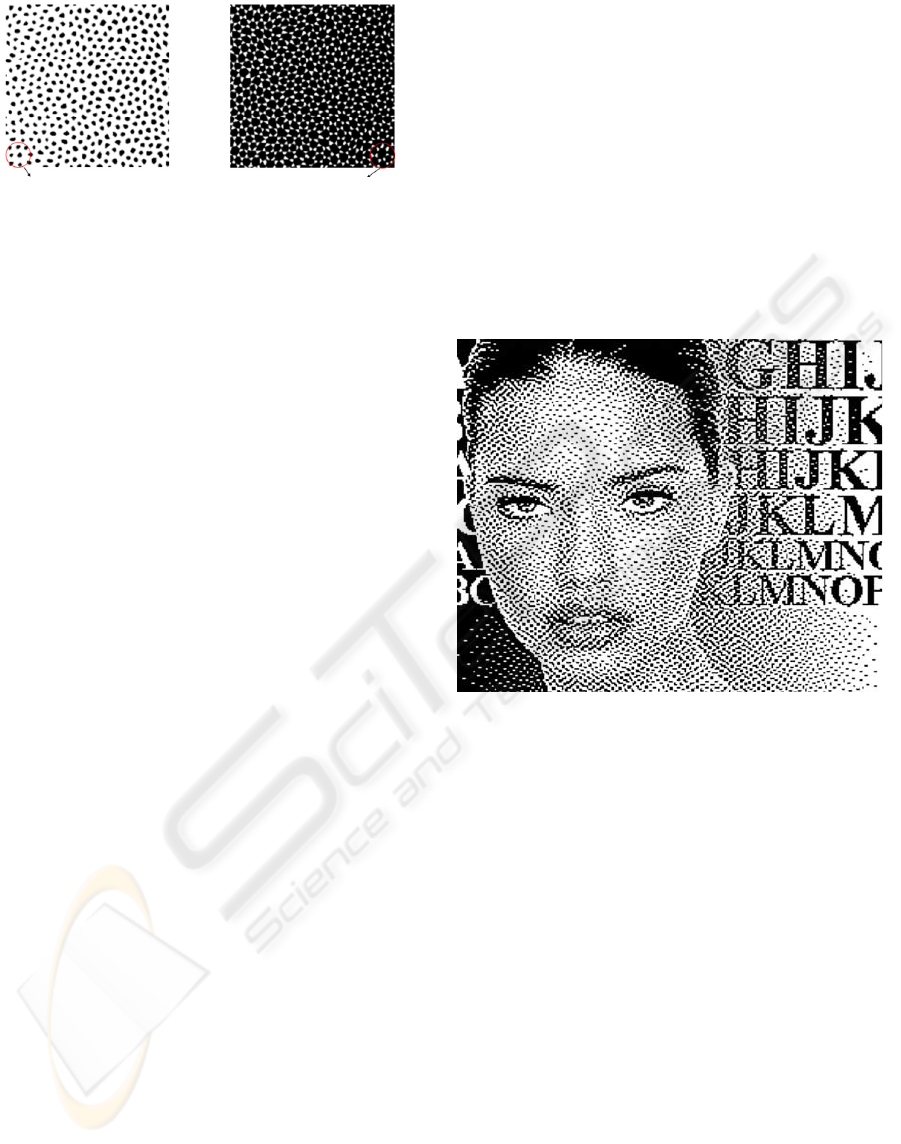
7 clustered dots
Figure 1: Detail of
highlight.
13 clustered dots
Figure 2: Detail of
shadow.
laterals. The subdivision is constructed with points
of a expanded central points set as a vertex set; (2)
evaluate the quality of quadrilaterals in the proposed
geometry subdivision in this research; (3) analyze
the uniformity of the expanded central point set by
comparing PSNR of the initial central point sets; (4)
construct a dithering matrix with equal clustered dot
density.
2 RELATED WORK
A lot of research concerning hybrid screening has
been conducted since the 1990s. Screening is a
technique to halftone continuous tone images with
dithering algorithms. Printing industry usually uses
screening technology in desk top printers, ink jet
printers and RIPs (Raster Image Processor) for
printing industry.
Barco first launched its hybrid screening product
SAMBA for flexo printing. It combines AM and FM
halftone in a single screening process. It halftones
continuous tone images with FM halftone in tint
under 10% and above 90%. It halftones continuous
tone images with AM halftone in tint between 10%
and 90%. So, it has the merits of FM halftone, for
instance, fine detail of FM in the highlight instead of
the demerits of FM halftone, for instance, excessive
dot gain of FM in the middle tone.
Other companies, like Founder Electronic and
Dainippon Screen, issued their hybrid screening
products such as FAM and Spekta. However, few
papers have been published on the design of these
products.
Among the academic researches related to
halftone technology, Ulichney first proposed the
blue noise model for FM halftone (Ulichney, 1988).
According to Ulichney’s theory, the ideal halftone
image distributes the same-sized dots as
homogeneously as possible. By doing so, the
spectral content of the image is composed entirely of
high-frequency spectral components. And as blue is
the high-frequency component to visible white light,
it is named blue noise model. However, blue noise
model does not work for some printing procedures
such as offset printing, because separate pixels can
not be reproduced reliably. Hybrid screen is applied
in offset printing instead of FM screen.
Later, Lau formalized the concept of green noise
model for hybrid screen and proposed an algorithm,
EDODF (Error Diffusion with Output-Dependent
Feedback), to design such screens based on
enforcing certain spatial-statistical characteristics of
green noise (Lau et al, 1998; Lau et al, 2000).
However, it is very difficult to control the shape of
clustered dot with his method (see Figure 3).
Figure 3: Sample image halftoned by EDODF algorithm.
Damera-Venkata and Lin used the void-and-
cluster algorithm with a donut filter to create green
noise screens (Damera-Venkata and Lin,2004).
Ostromoukhov proposed a hybrid screen design
method based on stochastic seeding and Delaunay
triangulation (Ostromoukhov and Hersch,1999
).
This method apparently has the strength to control
the shape of the clustered dots. Tu tried other ways
of filling tint in the Delaunay triangulation (Tu et al,
2000). The clustered dot densities in highlight and
shadow have big difference for the result of research
in (Ostromoukhov and Hersch,1999; Tu et al, 2000),
as illustrated in Figure 1 and Figure 2.
Xu proposed two theorems to guide the
optimization of the geometry subdivision from
Delaunay triangulation, with which a dithering
matrix with balanced clustered dot densities were
constructed (
Xu and Tan, 2009). We will elaborate on
these theorems in Section 3.
IMAGAPP 2010 - International Conference on Imaging Theory and Applications
62

3 GEOMETRY THEORY FOR
OPTIMIZING HYBRID
DITHERING MATRIX
In the existing research, constructing hybrid
dithering matrix based on a geometry subdivision
usually follows this procedure (Ostromoukhov and
Hersch,1999; Tu et al, 2000): (1) randomly
distribute some dots in a tile unit of a halftone plane
as the vertex of geometry subdivision; (2) calculate a
geometry subdivision to a tile unit of the halftone
plane with the above central points as the vertex of
the subdivision; (3) produce the dithering matrix by
filling grey gradient tint in the regions of the
subdivision above and make the vertex of the
subdivision the darkest point and the centre of the
region as the lightest point. Then, the grey mode
image filled is converted directly to a dithering
matrix by taking the pixel value of the image as the
value of element of the matrix in the corresponding
position. The requirements for the geometry
subdivision are: (1) The narrow shape of region
should be avoided to make the shape of clustered dot
favourable in printing; (2) The vertex’s number is
expected to be as close as to the region’s number of
the subdivision. It is the best case as a result of
balancing clustered dot density in all grey levels, if
the vertex number equals the region’s number.
In the previous research, (Ostromoukhov and
Hersch,1999; Tu et al, 2000) first generate a pseudo
random distribution of central point with space
filling curve in a 1024x1024 square areas. Then,
mark in a 1024x1024 reference image with a disk of
radius r when a central point is added. After all
pixels of the referenced image have been marked,
the central point set is ready for the next step. When
the disk covers pixels are beyond (0..1023, 0..1023),
the pixels of coordinate mod by 1024 will also be
marked. The mod operation makes the central point
image mosaic seamlessly. Because Delaunay
triangulations maximize the minimum angle of all
the angles of the triangles in the triangulation, they
tend to avoid skinny triangles. Delaunay
triangulation is a good choice of geometry
subdivision to produce a hybrid dithering matrix
with favourable clustered dot shape. However, the
clustered dot density in highlight is greatly different
from the clustered dot density in shadow area.
Figure 1 and Figure 2 altogether show this
difference. Figure 1 and Figure 2 are the enlarged
detail of highlight and shadow of Figure 5 in
(Ostromoukhov and Hersch,1999). There are 7
positive clustered dots inside the marked circle of
Figure 1, whereas there are 13 negative clustered
dots inside the same sized circle of Figure 2.
Because of the great differences of clustered dot
densities and minimum dot size constraint for offset
printing, a comparatively low clustered dot density
has to be selected.
To explain the observation of Figure 1 and
Figure 2 theoretically, the research in
(Xu and Tan, 2009) deducted two theorems from
Euler formula.
[Theorem 1] G is a Delaunay triangulation
pattern that could be seamlessly tiled. The total
number of vertex, edges and faces of G are V, E and
F. F= V/2+2.
Proof: Because G is a geometry subdivision that
can be tiled seamlessly, it can be converted to a
multi-face object without hole and Euler formula can
be applied to G.
V-E+F=2 (1)
Every triangle has three edges and every edge is
shared by two triangles, so 3F=2E.
E=(3/2)F
(2)
Replace E in (1) with left side of (2):
V-(3F/2)+F=2
V=F/2+2 (3)
The geometry subdivision adopted to construct
dithering matrix usually has more than 1,000 faces.
Divide the two sides of equation (3) by F, we have
V:F≈1:2. [Theorems 1] explains why the ratio of
clustered densities in light and shadow areas is about
0.5.
[Theorem 2] G is a geometry subdivision that
can be tiled seamlessly. The total vertex, edges and
faces of G are V, E and F. If all the faces of the
division are quadrilaterals, then F=V-2.
Proof: Same as proof above:
V-E+F=2 (4)
If all faces of the G are quadrilaterals, every
quadrilateral has 4 edges and every edge is shared by
two quadrilaterals. So, 4F=2E
E=2F
(5)
Replace E in equation (4) with 2F
V-2F+F=2
F=V-2
[Theorems 2] suggests: if the geometry
subdivision compromises more quadrilaterals, the
ratio of the clustered dot densities in shadow and
light areas is closer to 1. According to [Theorem 2],
CONSTRUCTING THE HYBRID DITHERING MATRIX WITH EQUAL CLUSTERED DOT DENSITY
63
an optimized algorithm is designed to merge
triangles of Delaunay triangulation as much as
possible while trying to keep quadrilaterals merged
in good shape. In the research of (Xu and Tan, 2009),
the ratio of the clustered dot densities was improved
to 0.9 from 0.5 without any change to the central
point set.
This research adopts an approach different from
the optimizing algorithm in (Xu and Tan, 2009). It
first expands pseudo random central point set. Then,
it makes an all-quadrilateral subdivision with the
expanded central point set. A dithering matrix of
equal clustered dot densities is constructed, based on
the all-quadrilateral geometry subdivision. Because
this approach changes the initial central point set, a
further study on the uniformity of the expanded
central point set is conducted by comparing its
PSNR with PSNR of the images of the central point
set generated with different pseudo seeds.
4 ALL-QUADRILATERAL
GEOMETRY SUBDIVISION
In the first step of this research, we generate an
initial central point distribution over halftone plane
by using the algorithm 1-3 of (Xu and Tan, 2009).
The radius r defines minimum distance between
central points. In the experiment, r is set to 14. In the
second step, we calculate the Voronoi graph with the
central point set. Delaunay triangulation is obtained
by connecting the neighbouring central points in the
two regions which share the same edge of the
Voronoi graph.
B
’
C
’
A
’
P
C
B
A
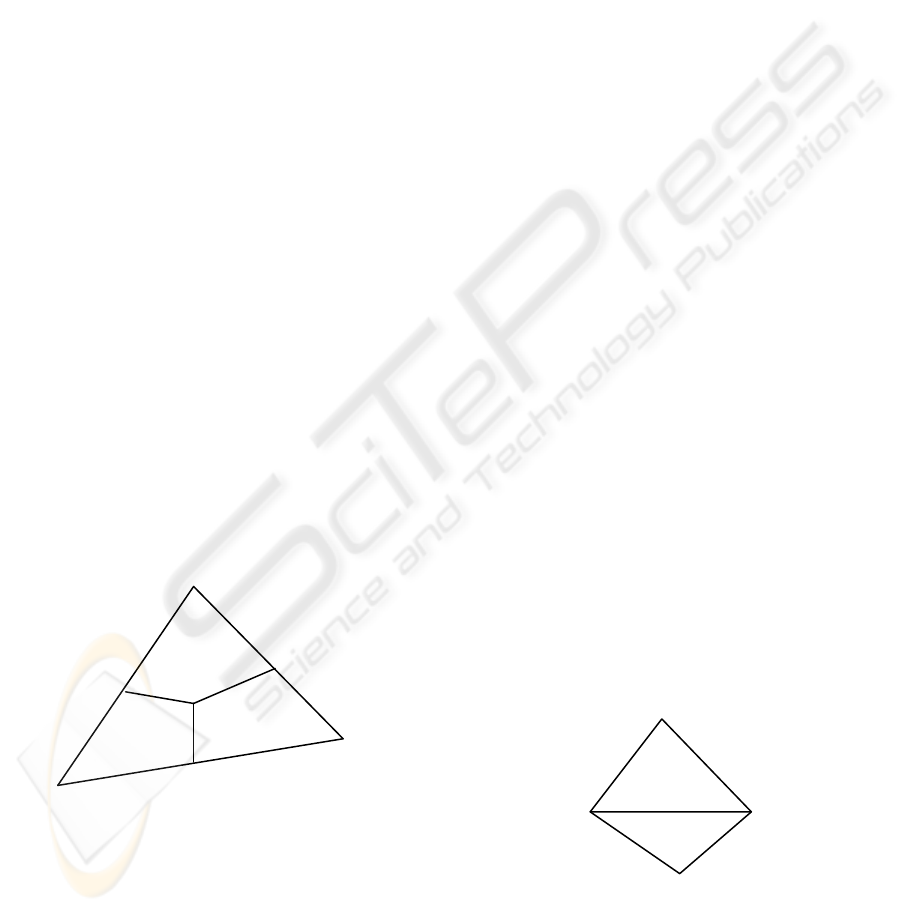
Figure 4: Split a triangle into quadrilaterals.
Now, take a triangle in Delaunay triangulation as
an example to explain the principle to construct all-
quadrilateral geometry subdivision. First, find the
weight of the triangle ABC in point P. Next, connect
P with three central points of the three edges of the
triangle ABC. The triangle is split into three
quadrilaterals (Figure 4). Then, all the triangles of
Delaunay triangulation will be converted to
quadrilaterals in this way. The new subdivision is
different from the optimized subdivision of (Xu and
Tan, 2009) in the following two aspects:
(1) The new geometry subdivision is
constructed with a central point set expanded from
the initial central point set by adding the weight
points and central points of edge of triangles.
(2) All regions of the new geometry
subdivision are quadrilaterals, whereas the regions
of the geometry subdivision optimized in (Xu and
Tan, 2009) are a combination of quadrilaterals and
triangles.
The vertex of the geometry subdivision is taken
as the centre of the negative clustered dot. The
image composed of the central points can also be
regarded as a halftone image of minimum non-zero
grey value. The image composed of the central
points can mosaic seamlessly according to the
previous description. We will further discuss the
quality issue of quadrilaterals.
The region’s narrow shape in the geometry
subdivision should be avoided, because the clustered
dot is formed in the region. By following the
definition of Delaunay triangulation, a quadruple is
defined as the quality factor the quadrilaterals (Xu
and Tan, 2009). When merging triangles besides an
edge into quadrilateral (Figure 5), quality factor of
A
1
A
2
A
3
A
4
(or edge A
1
A
3
) is calculated as follows:
Firstly, convert the angles of quadrilateral
A
1
A
2
A
3
A
4
to A
1
′, A
2
′, A
3
′ and A
4
′ according to
formula (6). Then, sort the angles in ascend order
and put it in a quadruple like (A
i1
′, A
i2
′, A
i3
′, A
i4
′),
where i
1
,i
2
,i
3
,i
4
∈{1,2,3,4},A
i1
′≤A
i2
′≤A
i3
′≤A
i4
′.
The quadruple is called quality factor of
quadrilateral A
1
A
2
A
3
A
4
.
(6)
A
1
A
2
A
3
A
4
Figure 5: Defining quality factor of a quadrilateral.
For the convenience of comparing the quality of
quadrilaterals in geometry subdivision of this
research and (Xu and Tan, 2009), the quadruple is
{
A
i
′
0
,
A
i
>=180
=
A
i
, A
i
<=90
180-A
i
,
180>A
i
>90
IMAGAPP 2010 - International Conference on Imaging Theory and Applications
64
converted to a real value QF in conformity with
formula (7). The value QF ranges from 0 to 7.9.
QF=log
10
(A
i4
′
*
90
3
+A
i3
′
*
90
2
+ A
i2
′
*
90+A
i1
′)
(7)
The greater value of QF indicates better quality
of the quadrilateral. We calculate QF of
quadrilaterals in geometry subdivision of this
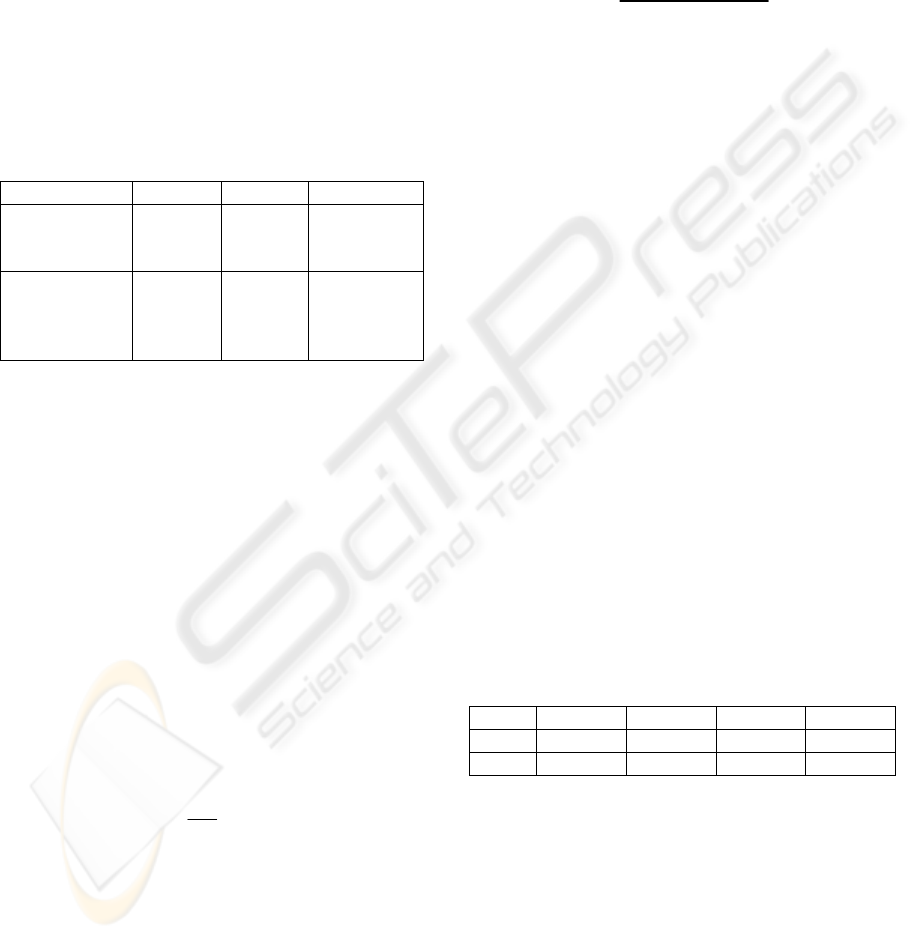
research and (Xu and Tan, 2009) and use Table 1 to
compare the quality of quadrilaterals in these two
subdivisions. In Table 1, Min_QF, Max_QF and
Average_QF are minimum, maximum and average
value of QF respectively. Table1 shows that quality
factor of the quadrilaterals in this research is better
than that in (Xu and Tan, 2009).
Table 1: Comparing QF of quadrilaterals.
Min_QF Max_QF Average_QF
All-
quadrilaterals
subdivision
7.6857 7.8218 7.7920
Optimized
subdivision in
(Xu and Tan,
2009)
7.4150 7.8218 7.7150
5 UNIFORMITY OF THE
EXPANDED CENTER POINT
SET
The purpose of this research is to produce a hybrid
dithering matrix with equal clustered dot densities.
Because some extra central points besides initial
central points are added in the process of obtaining
all-quadrilateral geometry subdivision, the expanded
central point set should be evaluated by comparing
its uniformity with that of the initial central point
set.
If the image of central points is regarded as a
1024x1024 halftone image, its average grey value g
is defined as:
N
C
g
N
P
=
(8)
NC is the number of central points and NP is the
total number of pixels of the image. The image of
central point can also be viewed as the result of
halftoning an image of constant grey value g. PSNR
(Peak Signal Noise Ratio) is often used to measure
the quality of image. In this research, the uniformity
of central point set is measured by PSNR defined in
the following procedure:
(1) Calculate the average grey value g;
(2) Filter the central point image with HVS
model and we get x(i,j), the human perceived image
of central point;
(3) Calculate PSNR with formula (9), where
g
max
is maximum grey value. Let it be 1.0 here.
PSNR=log(
2
11
2
11
max
((, ) )
MN
ji
MN
ji
g
x
ij g
==
==
−
∑∑
∑∑
)
(9)
Greater PSNR means better uniformity for the
central point image. The expanded central point
image and initial central point image have different
dot densities. To reduce factors affecting the
comparing result, we scale down the expanded
central point image to the same dot density of the
initial central point image and crop it to 1024x1024.
The reason why we filter the image with HVS model
is that all printed halftone images are observed by
human eyes. It is due to the HVS model that the
halftone image looks similar to the original
continuous tone image. Table 2 lists PSNR of the
four central point images. D
1
is the expanded central
point image both cropped and scaled. D
2
is the initial
central point image. D
3
and D
4
are the central point
image that is generated with radius 14 and different
random seeds.
Table 2 shows PSNR of the tested pseudo
random central point images. PSNR of D
2
, D
3
and
D
4
varies in a range 43.3744~44.5205. PSNR of D
1
is out of this range. The quality (uniformity) of
expanded central point image D
1
is inferior to the
initial central point image D
2
. But PSNR of D
1
is
very close the above range. It is reasonable to think
PSNR of D
1
is still within the acceptable range.
Table 2: PSNR of image of central point set.
D
1
D
2
D
3
D
4
PSNR 43.1944 44.5205 43.3744 43.4002
g 0.0056 0.0051 0.0055 0.0055
6 CONSTRUCTING HYBRID
DITHERING MATRIX
In Section 4, the triangle of Delaunay triangulation
is split into three quadrilaterals to make an all-
quadrilateral geometry subdivision. Thus, we fill
these quadrilaterals with gradient tint to make a
dithering matrix.
CONSTRUCTING THE HYBRID DITHERING MATRIX WITH EQUAL CLUSTERED DOT DENSITY
65
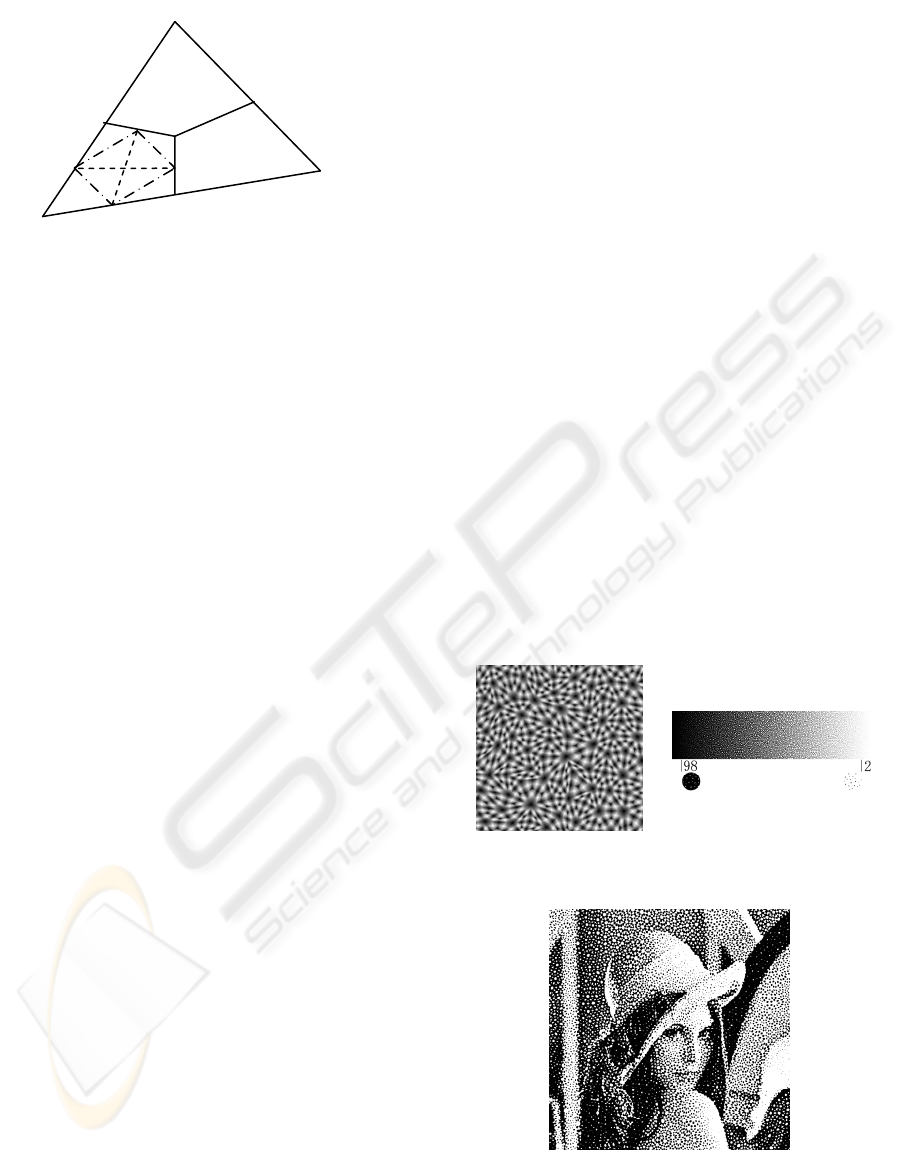
Figure 6: Filling gradient in quadrilaterals.
Take the quadrilateral PC′AA′ as an example to
show the procedure of filling quadrilateral with
gradient tint (see Figure 6 also):
(1) Find the central point of all the four edges of
the quadrilateral PC′AA′ : K
1
, K
2
, K
3
, K
4
;
(2) Connect K
1
and K
3
with a line in between
K
1
K
3
. Connect K
2
and K
4
with a line in between
K
2
K
4
. O is the cross point of the line K
1
K
3
and K
2
K
4
.
Take O as the centre of positive clustered dot and
vertex P, C′, A, A′ as the centres of 4 negative
clustered dots;
(3) Fill quadrilateral OK
1
PK
2
with gradient tint
a) Filling triangle K
1
PK
2
the gradient tint
with 20 stages grey levels:
First, fill triangle K
1
PK
2
with grey level
g=0.5;
Then, shift K
1
K
2
in the track of K
1
P and
K
2
P to K
1
′ and K
2
′ while keeping the line
K
1
′K
2
′ paralleled to K
1
K
2
; each step is 1/20 of
the distance from P to line K
1
K
2
; grey value g
filled is increased by 0.025 in each step;
b) Fill the gradient tint into triangle K
1
OK
2
with 19 grey level stages;
First, fill grey level g=0.475 into triangle
K
1
PK
2
;
Then, shift K
1
and K
2
in the track of K
1
O
and K
2
O to K
1
′ and K
2
′ while maintaining K
1
′
K
2
′ paralleled to K
1
K
2
; each step is 1/20 of the
distance from O to line K
1
K
2
, and grey value g
filled is decreased by 0.025 in each step;
(4) The same filling procedure will be applied to
quadrilaterals OK
2
C′K
3
, OK
3
AK
4
and OK
4
A′K
1
.
The graphics of the dithering matrix image
described above is programmed in PostScript
language. With PostScript, it is easy to scale up and
down with ‘scale’ operator to produce the dithering
matrix of different clustered dot densities, which can
also be adapted to the output devices with different
resolutions.
The procedure to produce the dithering matrix is
described as follows:
First, we print the postscript file of dithering
matrix with Harlequin RIP and output it to a 600
DPI grey mode TIFF file. In Photoshop, the grey
image is smoothed by Gaussian filter to bring the
clustered dot a smooth edge. The parameters
employed in Gaussian filtering are: Radius=4,
Amount=100%. Next, we paste the above filtered
image into a new image of two different layers in
Photoshop. Then, we horizontally move the top layer
rightwards. When the left edge of the top layer
precisely matches the bottom layer, the distance by
which the top layer has been moved is the width of
pattern that can mosaic seamlessly. The size of the
image pattern that can mosaic seamlessly is a
2134x2134 image. Figure 7 is the mosaic unit
image. For clearness of the pattern, only a part of
image is shown in Figure 7. In the following step,
we directly convert the mosaic unit image to a
2134x2134 dithering matrix, in which the element
value of the matrix is the pixel value of the unit
mosaic image. Finally, we make a new dot shape
named ‘AccurateBalanced’ with the dithering matrix
and embed it into Harlequin RIP. Figure 8 and
Figure 9 are two samples produced with this dot
shape. From Figure 8 it is obvious that clustered dot
densities (98%) in shadow and light area (2%) are
the same. Figure 9 is an image halftone by the
Harlequin RIP with ‘AccurateBalanced’ dot shape.
Figure 7: Dithering
matrix.
Figure 8: Halftoned grey
image.
Figure 9: Halftoned image sample.
K
3
O
C’
K
4
K
2
A
’
P
C
B
A
B’
K
1
IMAGAPP 2010 - International Conference on Imaging Theory and Applications
66

7 CONCLUSIONS
This research proposes a new method to expand a
Delaunay triangulation to an all-quadrilateral
geometry subdivision. Based on the proposed
subdivision, we construct a hybrid dithering matrix
with equal clustered dot densities. The strengths of
this result are described as follows: (1) The clustered
dot density equals in all grey levels; (2) The quality
factor of the quadrilaterals is improved when
compared with that of the quadrilateral in the
optimized geometry subdivision in (Xu and Tan,
2009); (3) The uniformity of the expanded central
point set is proved to be acceptable by comparing its
uniformity with the variance of the uniformity of
central point distribution generated by different
pseudo random seeds.
The new hybrid dither matrix has an obvious
weakness: the shadow pattern consists of one big
negative clustered dot surrounded by several small
negative clustered dots (Figure 7). The big negative
clustered dot is centred on the vertex of the
geometry subdivision with five or more edges. The
small negative clustered dots are centred on the
vertex of 4 edges (central point of the edges of
Delaunay triangle) or on the vertex of 3 edges
(weight point of Delaunay triangle). The average
number of edges connected to a vertex is 4 for an
all-quadrilateral geometry subdivision. Further study
deserves to be conducted to make a geometry
subdivision with more 4 edges vertex to reduce the
local unbalance of the clustered dot size.
REFERENCES
Damera-Venkata N., Lin Q., 2003. AM-FM screen design
using donut filters.
Proc. SPIE,5293(469): 469–480.
Lau D. L., Arce G. R., Gallagher N. C., 1998. Green-noise
digital halftoning. Proc. IEEE,,86(12):2424–2444.
Lau D. L., Arce G. R., Gallagher N. C., 2000. Digital
color halftoning with generalized error-diffusion and
multichannel green-noise masks.
IEEE Trans. Image
Process.
, 9(5):923–935.
Ostromoukhov V., Hersch R. D., 1999. Stochastic
clustered-dot dithering. Journal of Electronic Imaging,
8(4): 439–445.
Tu Chang-He, Pan Rong-Jiang, Meng Xiang-Xu, 2000.
An algorithm for building stochastic clustered-dot
screens.
Chinese journal of computers,23(9):931-937
(in Chinese).
Ulichney R. A., 1988. Dithering with blue noise. Proc.
IEEE
, 76(1): 56-79.
Xu Guoliang, Tan Qingping, 2009. Research on balancing
clustered dot density for hybrid halftone dithering
algorithm.
Chinese journal of computers,.32 (8): 1550
1559 (in Chinese).
CONSTRUCTING THE HYBRID DITHERING MATRIX WITH EQUAL CLUSTERED DOT DENSITY
67
